

1.5.3. The variance and the standard deviation
A
key step in developing a measure of variability that includes all the
data items involves the computations of the differences between the
data values and the mean for the data set. The difference between ![]() and the mean
and the mean
(![]() for a sample,
for a sample, ![]() for a population) is called a deviation about the mean. Since we are
seeking a descriptive statistical measure that summarizes the
variability or dispersion in the entire data set, we want to consider
the deviation of each data value about the mean. Thus for a sample
size
for a population) is called a deviation about the mean. Since we are
seeking a descriptive statistical measure that summarizes the
variability or dispersion in the entire data set, we want to consider
the deviation of each data value about the mean. Thus for a sample
size ![]() and
data values
and
data values![]() ,
we will need to compute the deviations
,
we will need to compute the deviations
![]() ,
,![]() ,
……..
,
……..![]() .
.
We
might think of summarizing the dispersion in a data set by computing
the average deviation about the mean. The only trouble with such an
attempted definition is that it would not give us much information
about the variation present in the data; the mean  would
be zero for every sample, because the sum
would
be zero for every sample, because the sum ![]() equals
zero for every sample. The positive and negative deviations cancel
each other out. Hence if we are to use the deviations from the mean
as a measure of dispersion we must find another approach. As we
already know, one way is computing the average absolute deviation as
a measure of variability. While this measure is sometimes used, the
one most often used is based on squaring the deviations to eliminate
the negative values. The average of the squared deviations for a data
set representing a population or sample is given a special name in
statistics. It is called the variance.
equals
zero for every sample. The positive and negative deviations cancel
each other out. Hence if we are to use the deviations from the mean
as a measure of dispersion we must find another approach. As we
already know, one way is computing the average absolute deviation as
a measure of variability. While this measure is sometimes used, the
one most often used is based on squaring the deviations to eliminate
the negative values. The average of the squared deviations for a data
set representing a population or sample is given a special name in
statistics. It is called the variance.
The
population
variance is
denoted by the Greek symbol ![]()
(pronounced “sigma squared”). The formula for population variance is
(1) 
where
![]()
![]()
![]() .
.
It is frequently desirable to have a measure of dispersion whose units are the same as those of the observations. Since the variance is given in squared units, the square root of the variance would be given in units that we need.
Thus,
if we take the square root of the variance, we have the measure of
dispersion that is known as the population standard deviation and
denoted by![]() .
By definition we have
.
By definition we have

In
many statistical applications, the data set we are working with is a
sample. When we compute a measure of variability for the sample, we
often are interested in using the sample statistic obtained as an
estimate of the population parameter,![]() .
At this point it might seem that the average of the squared
deviations in the sample would provide a good estimate of the
population variance. However, statisticians have found that the
average squared deviation for the sample has the undesirable feature
that it tends to underestimate the population variance
.
At this point it might seem that the average of the squared
deviations in the sample would provide a good estimate of the
population variance. However, statisticians have found that the
average squared deviation for the sample has the undesirable feature
that it tends to underestimate the population variance![]() .
Because of this tendency toward underestimation we say it provides a
biased estimate.
.
Because of this tendency toward underestimation we say it provides a
biased estimate.
Fortunately,
it can be shown that if the sum of the squared deviations in the
sample is divided by![]() ,
and not
,
and not![]() ,
then the resulting sample statistic will provide an unbiased estimate
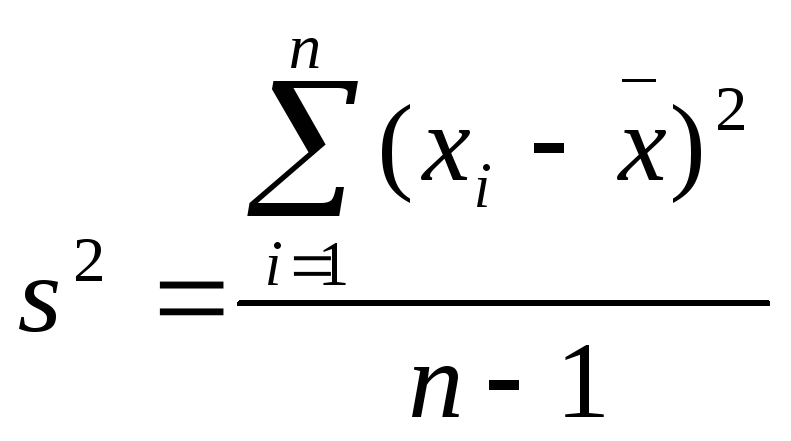
of the population variance. For this reason the sample
variance
is not defined to be the average squared deviation in the sample.
Sample variance is denoted by
,
then the resulting sample statistic will provide an unbiased estimate
of the population variance. For this reason the sample
variance
is not defined to be the average squared deviation in the sample.
Sample variance is denoted by ![]() and
is defined as follows:
and
is defined as follows:
(2) 
To
find the sample standard deviation (denoted by![]() ),
one must take the square root of the sample variance:
),
one must take the square root of the sample variance:
![]()
![]()
![]()

Example:
Find the variance and the standard deviation for the sample data
21, 17, 13, 25, 9, 19, 6, and 10
Solution:
When
we compute ![]() by
applying formula (2), the computations can most conveniently be shown
in a table. The table will be composed of three columns: a column for
the observations
by
applying formula (2), the computations can most conveniently be shown
in a table. The table will be composed of three columns: a column for
the observations![]() ,
a column for the
,
a column for the
deviations
of the observations from the sample mean ![]() ,
,
and
a column for the squared deviations![]() .(Table1.2)
.(Table1.2)
(Table 1.2)
21 17 13 25 9 19 6 10 21-15=6 17-15=2 13-15=-2 25-15=10 9-15=-6 19-15=4 6-15=-9 10-15=-5 36 4 4 100 36 16 81 25 120
302
![]()
![]()
![]()
![]() ;
;

![]()
![]()
 ;
;
and![]() .
.
From the computational point of view, it is easier and more efficient to use short-cut formulas to calculate the variance. By using the short-cut formula, we reduce the computation time and round off errors.
The short-cut formulas for calculating variance are as follows:

and

Example:
Find the variance and the standard deviation for the sample of
16, 19, 15, 15, and 14
Solution:
Let us apply

Step1: Find the sum of values,
![]()
Step2: Square each value and find the sum
![]()
Step3: Substitute in the formula and calculate

![]()
![]()
Hence the sample variance is 3.7 and sample standard deviation is 1.9.