

138 CHINA’S RISE
Evolution of Energy Demand in China
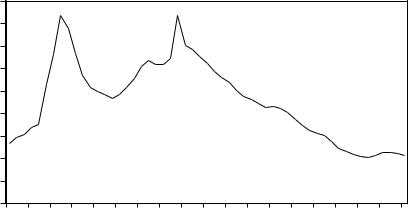
Decades of state planning and ideological aspiration prior to reform in the late 1970s had distorted China’s energy demand profile. Rather than embracing a development strategy compatible with its natural endowments (China is rich in labor, poor in capital, arable land, and technology) as Japan, Hong Kong, Taiwan, and others had done, leaders ignored comparative advantage and dragged China—kicking, screaming, and sometimes starving—toward Soviet-style industrialization. In fits and starts over 30 years, resources were shifted out of agriculture and into energyintensive industries like steel and cement. Between 1949 and 1978, industry’s share of economic output grew from 18 to 44 percent, and the amount of energy required to produce each unit of output tripled (figure 7.1).5 This command-and-control fiasco resulted in severe inefficiency, which, ironically, created the potential for impressive catch-up growth later—what we think of as a Chinese miracle today.
In 1978 leaders began to unleash China’s potential. Faced with continued worry about famine, Beijing let farmers “catch their breath” by reforming agricultural production targets and raising prices, with dramatic results. Farm output increased, and the early 1980s saw rural residents with more time on their hands, cash in their pockets, and freedom to use it as they chose. Much of this new wealth was invested into township and village enterprises (TVEs) set up to exploit what China was best suited for: labor-intensive light manufacturing. These TVEs became an engine of economic growth and the first step away from energy-intensive industry, a shift that would shape China’s energy footprint for the next 20 years.6
Reform also brought changes within heavy industry, which reduced the energy intensity of Chinese growth. Economic incentives—the right to aspire to and keep profits—were introduced where only planned mandates existed. Awareness among enterprises of bottom-line profits made them focus more on top-line expenses, including on energy. And as enterprises were becoming more aware of the impact of energy costs on profitability, their energy bills were growing as a result of partial liberalization of oil, gas, and coal prices. The introduction of limited competition for both customers and capital, not just from other state-owned enterprises (SOEs) but also from a growing private sector, made energy cost management all the more important. Domestic competition was accompanied by gradual integration with world markets; lower trade barriers not only brought pressure on SOEs from energy-efficient foreign companies but also allowed them to acquire the more energy-efficient technology their competitors enjoyed. China’s small existing base of modern plants and equipment enabled it to absorb new technology quickly, significantly improving the efficiency of the country’s capital stock.7
By 2000, Chinese economic activity required two-thirds less energy per unit of output than in 1978 (figure 7.1). Energy intensity improvement on
Peterson Institute for International Economics | www.petersoninstitute.org
ENERGY IMPLICATIONS OF CHINA’S GROWTH 139
Figure 7.1 Energy intensity of the Chinese economy, 1953–2007
tons of coal equivalent per million real renminbi
450 |
|
|
|
|
|
|
|
|
|
|
|
|
|
|
|
|
|
|
400 |
|
|
|
|
|
|
|
|
1978: Reform |
|
|
|
|
|
|
|
||
|
|
|
|
|
|
|
|
begins |
|
|
|
|
|
|
|
|
||
|
|
|
|
|
|
|
|
|
|
|
|
|
|
|
|
|
||
350 |
|
|
|
|
|
|
|
|
|
|
|
|
|
|
|
|
|
|
300 |
|
|
|
|
|
|
|
|
|
|
|
|
|
|
|
|
|
|
250 |
|
|
|
|
|
|
|
|
|
|
|
|
|
|
|
|
|
|
200 |
|
1958: Great |
|
|
|
|
|
|
|
|
|
|
|
|
|
|
||
|
Leap Forward |
|
|
|
|
|
|
|
|
|
|
|
|
|
||||
|
|
|
|
|
|
|
|
|
|
|
|
|
|
|
||||
150 |
|
|
|
|
|
|
|
|
|
|
|
|
|
|
|
|
|
|
100 |
|
|
|
|
|
|
|
|
|
|
|
|
|
|
2002: Energy |
|
||
|
|
|
|
|
|
|
|
|
|
|
|
|
|
|
|
|||
50 |
|
|
|
|
|
|
|
|
|
|
|
|
|
|
intensity trend |
|||
0 |
|
|
|
|
|
|
|
|
|
|
|
|
|
|
reverses |
|
|
|
|
|
|
|
|
|
|
|
|
|
|
|
|
|
|
|
|
|
|
1953 |
1956 |
1959 |
1962 |
1965 |
1968 |
1971 |
1974 |
1977 |
1980 |
1983 |
1986 |
1989 |
1992 |
1995 |
1998 |
2001 |
4 |
2007 |
200 |
||||||||||||||||||
Source: CEIC data from National Bureau of Statistics of China, China Statistical Yearbook, various years.
this scale was unprecedented for a large developing country and meant that in 2001, China accounted for 10 percent of global energy demand rather than the 25 percent based on 1978 energy performance.
Investment-Led Energy Surprise
At the start of the new millennium in 2001, China’s leaders expected the energy intensity improvements that had been taking place since 1978 to continue. Economic reform was an accepted reality and was assumed to presage further energy efficiency. China had decided to join the World Trade Organization (WTO), locking in greater market competition at home and recognizing the importance of comparative advantage.8 Most energy forecasters at home and abroad assumed that the structural shift away from energy-intensive heavy industry would persist; at least, no one expected the evolution to reverse quickly. Further, GDP growth was expected to expand by 7 to 8 percent for the coming decade, fast but not furious.9 In 2001 both the Chinese government and the International Energy Agency (IEA) predicted 3 to 4 percent energy demand growth between 2000 and 2010 (figure 7.2).
Both wildly missed the mark. The economy grew much quicker than anticipated in 2001–06, but the real surprise was a change in the energy intensity of economic growth. Energy demand elasticity (ratio of energy demand
Peterson Institute for International Economics | www.petersoninstitute.org
Figure 7.2 Energy demand, historic and recent forecasts, 1974–2030
billion tons of oil equivalent
4.0
China 2007
3.5
3.0 |
United States |
2.5
2.0
OECD Europe
1.5 |
China 2002 |
India
1.0
0.5
Japan
0
1974 |
1978 |
1982 |
1986 |
1990 |
1994 |
1998 |
2002 |
2006 |
2010 |
2014 |
2018 |
2022 |
2026 |
2030 |
OECD = Organization for Economic Cooperation and Development
Note: The International Energy Agency, in its 2002 World Energy Outlook, predicted Chinese energy demand would reach 2.1 billion tons of oil equivalent by 2030. Just five years later, in its 2007 World Energy Outlook it raised its 2030 forecast for China’s energy demand by 1.7 billion tons of oil equivalent (a 79 percent upward revision) to 3.8 billion tons of oil equivalent.
Sources: Historic data from International Energy Agency, World Energy Statistics and Balances 2007; projections from International Energy Agency, 2007 World Energy Outlook.
140
Peterson Institute for International Economics | www.petersoninstitute.org
ENERGY IMPLICATIONS OF CHINA’S GROWTH 141
growth to GDP growth) increased from 0.4 between 1978 and 2001 to 1.1 between 2001 and 2006.10 Energy consumption grew four times faster than predicted to 16 percent of global demand in 2006. And yet on a per capita basis, China’s energy demand remains one-sixth that of the United States, triggering anxiety about how much more growth is to come.11
This upside surprise not only shocked domestic and international energy markets but also prompted a fundamental reassessment of China’s energy future—and hence the world’s. In its 2007 World Energy Outlook, the IEA raised its 2030 forecast for China’s energy demand by 1.7 billion tons of oil equivalent (a 79 percent upward revision) to 3.8 billion tons of oil equivalent from the 2.1 billion tons of oil equivalent it had predicted in its 2002 outlook. The new forecast is more than India’s total projected demand for that year.12 Under this scenario, China will account for 22 percent of global energy demand, more than Europe, Russia, and Japan combined, easily surpassing the United States as the world’s largest energy consumer.
What caused China’s two-decade history of energy intensity improvements to change course? Many China watchers assume that the recent evolution of China’s energy profile reflects growth in consumption and transportation—for instance, air conditioning and personal cars. This is not correct. Consumption-led energy demand will be the major driver in the future and is already significant in absolute terms, but the main source of today’s growth is energy-intensive heavy industry. Industrial energy efficiency has continued to improve over the past six years: Every new steel mill is more efficient than the last one; but the structural shift away from heavy industry toward light industry has reversed, and a new steel plant—no matter how much more efficient than its predecessor—uses substantially more energy than a garment factory. Industry today accounts for two-thirds of final energy consumption in China, while the residential, commercial, and transportation sectors account for 12, 5, and 13 percent, respectively.13 This is high by either developedor developingcountry standards (table 7.1).
When pundits express shock at how much more energy intensive China is than, say, Japan, they usually ignore the important factor of what the country makes. High energy intensity partly reflects the role of industry in the Chinese development model, as opposed to India, which has taken a more services-heavy approach, or Japan, which has lowered its energy intensity in part by migrating its energy-intensive sectors to China. As shown in table 7.2, industry accounts for 48 percent of all economic activity in China compared with India at 29 percent and Japan at 26 percent. So the fact that one unit of economic output requires five times as much energy in China as in Japan says more about the type of economic activity taking place in China than the efficiency with which it occurs (though energy efficiency in most industries in China lags OECD averages, discussed later). And economic activity in China is increasingly skewed toward investment.
Peterson Institute for International Economics | www.petersoninstitute.org

142 CHINA’S RISE
Table 7.1 Energy demand by sector, 2005 (percent)
|
|
|
|
|
|
|
United |
|
Sector |
China |
India |
Russia |
Brazil |
Japan |
EU-27 |
States |
World |
Agriculture |
4.6 |
7.2 |
2.3 |
4.9 |
0.9 |
2.2 |
1.1 |
2.4 |
Industry |
63.8 |
52.1 |
38.4 |
41.1 |
38.3 |
32.4 |
26.8 |
37.8 |
Commercial |
4.7 |
3.0 |
8.1 |
6.8 |
17.7 |
10.5 |
13.0 |
9.0 |
Residential |
12.3 |
16.7 |
26.2 |
10.3 |
15.7 |
22.0 |
16.8 |
17.1 |
Transportation |
12.8 |
18.5 |
22.7 |
36.9 |
26.9 |
29.8 |
41.4 |
31.5 |
Other |
1.9 |
2.5 |
2.1 |
0.0 |
0.0 |
3.0 |
0.9 |
2.0 |
Total (million tons |
890 |
199 |
417 |
128 |
348 |
1,249 |
1,546 |
6,893 |
of oil equivalent) |
|
|
|
|
|
|
|
|
|
|
|
|
|
|
|
|
|
Note: This table excludes biomass but includes nonenergy use of energy commodities.
Source: International Energy Agency, World Energy Statistics and Balances 2007.
Table 7.2 GDP by sector, 2005 (percent)
|
|
|
|
|
|
OECD |
United |
|
Sector |
China |
India |
Russia |
Brazil |
Japan |
Europe |
States |
World |
Agriculture |
12.5 |
18.8 |
5.5 |
5.7 |
1.5 |
2.3 |
1.0 |
n.a. |
Industrya |
47.5 |
28.8 |
39.5 |
29.3 |
26.2 |
27.3 |
20.7 |
28.2 |
Services |
39.9 |
52.4 |
55.0 |
65.0 |
72.3 |
70.5 |
78.3 |
n.a. |
Total (billions of |
2,303 |
809 |
765 |
882 |
4,554 |
13,671 |
12,434 |
44,730 |
US dollars) |
|
|
|
|
|
|
|
|
|
|
|
|
|
|
|
|
|
n.a. = not available
OECD = Organization for Economic Cooperation and Development
a. Industry includes manufacturing and construction.
Source: Economist Intelligence Unit Country Data based on national sources.
Is it the case then that energy intensity booms whenever there is an investment boom in China? Investment as a share of China’s GDP approached its current high of 43 percent two other times, in the late 1970s and the early 1990s, when it also created a surge in industrial activity.14 From an energy standpoint, the current investment cycle is different. Based on a review of the literature, data analysis, and primary research, we postulate a number of things.
First, China is now producing domestically, rather than importing, more of the energy-intensive basic products (such as steel and aluminum) used to construct the roads and buildings investment pays for. China now accounts for 49 percent of global flat glass production, 48 percent of global cement production, 35 percent of global steel production, and 28 percent
Peterson Institute for International Economics | www.petersoninstitute.org

ENERGY IMPLICATIONS OF CHINA’S GROWTH 143
Figure 7.3 China’s share of global production, 2006
percent |
|
|
|
|
|
|
|
|
60 |
|
|
|
|
|
|
|
|
50 |
|
|
|
|
|
|
|
|
40 |
|
|
|
|
|
|
|
|
30 |
|
|
|
|
|
|
|
|
20 |
|
|
|
|
|
|
|
|
10 |
|
|
|
|
|
|
|
|
0 |
|
|
|
|
|
|
|
a |
|
glass |
Cement |
Steel |
|
Sedans |
Ethylene |
GDP |
|
Flat |
|
Patents |
||||||
|
|
Aluminum |
Semiconductors |
|||||
|
|
|
|
|
|
|
||
a. Refers to share of US patents awarded to foreign countries.
Sources: CEIC data from ISI Emerging Markets; US Patent and Trademark Office; International Energy Agency; Pilkington, “Flat Glass Industry—Summary,” www.pilkington.com; International Iron and Steel Institute, www.worldsteel.org; US Geological Survey; Comtex, www.comtex.com; and authors’ estimates.
of global aluminum production (figure 7.3).15 Some of this production reflects migration of industry from other parts of the world not only to serve Chinese demand but also for export. Where China used to be a net importer of many energy-intensive goods, it has now become a major global exporter of steel, aluminum, and cement.
Second, the energy impact of China’s investment cycles is worsening: With each boom more finance is pumped in to build domestic energyintensive industrial capacity. The implication is that energy policy alone cannot fix the energy problem, and it must be incorporated into the larger agenda for rebalancing China’s growth; this agenda must include adjustments to the financial system, environmental protection regimes, trade policy incentives, and other variables discussed in this book.
Third, the changing composition of China’s industrial structure is less the result of ideological aspiration (as it was for Mao Zedong) than competition among provinces and localities to grow GDP, tax revenue, and corporate profits.16 Not just Beijing but also local interests, including industrial enterprises, set the rules of competition. And regardless of who
Peterson Institute for International Economics | www.petersoninstitute.org
144 CHINA’S RISE
sets the rules, implementation is a local matter. Within this context of competition, short-term economic incentives—low operating costs and prof- its—explain much of the increase in heavy industrial activity.
On the profit side, after-tax earnings in energy-hungry industries have been good, thanks to depreciation, dividend waivers for SOEs, transfer payments, and other factors. Heavy-industry profits have risen from nearzero in the late 1990s to a level comparable to that of their light-industry counterparts—ranging from 4 to 7 percent in steel, glass, chemicals, and cement in recent years.17 With China modernizing over 170 cities of more than 1 million people, certainly there is a large domestic market for basic materials, and supply was squeezed by breakneck growth after 2001. But with overcapacity arising almost as soon as the first profits come in, the ability of firms to sell surplus production in international markets has been critical to remaining profitable.
China’s energy-intensive industry enjoys low operating costs, which has allowed for rising profit margins and a dramatic growth in capacity that is at the center of China’s overinvestment in heavy industry. Local governments often provide deeply discounted land, and they often do not enforce regulations to protect air and water. Construction time is short, and labor costs are low. These benefits apply to all industries; however, they are particularly valuable in the energy-intensive sector, where capital costs are large. The financial system also favors heavy industry: SOEs worry little about the threat of default, and borrowing rates are not even high enough to afford depositors a positive real rate of return. Not only are profit margins high (for borrowers, not depositors) but also SOEs do not have to distribute the profits to their shareholder (the state), leaving them with plenty to reinvest. The following subsections lay out these various operating cost advantages in detail.
Energy Prices and Environmental Costs
Energy prices in China, once highly subsidized, have gradually converged with world prices over the past 30 years. Yet, given local idiosyncrasies in pricing, dual supply channels for many legacy SOEs, arrears, and other factors, it can be difficult to accurately assess the price a specific firm pays for coal, gas, oil or electricity. Chinese prices for raw energy commodities including coal and natural gas, particularly in interior provinces close to resource deposits, can be significantly cheaper than those in the OECD. For coal, low prices result not from subsidization but rather from low extraction costs in areas isolated from international markets. As transportation bottlenecks ease, coal prices will continue to rise toward world prices. Coke, a coal-derived fuel used in steelmaking, was once significantly cheaper inside China than on international markets due to limitations on Chinese coke exports. In recent years, however, the gap between Chinese
Peterson Institute for International Economics | www.petersoninstitute.org

ENERGY IMPLICATIONS OF CHINA’S GROWTH 145
Figure 7.4 Industrial electricity prices, 2006
US dollars per kilowatt hour 14
12 |
|
|
|
|
|
|
|
|
|
|
|
|
|
10 |
|
|
|
|
|
|
|
|
|
|
|
|
|
8 |
|
|
|
|
|
|
|
|
|
|
|
|
|
6 |
|
|
|
|
|
|
|
|
|
|
|
|
|
4 |
|
|
|
|
|
|
|
|
|
|
|
|
|
2 |
|
|
|
|
|
|
|
|
|
|
|
|
|
0 |
|
a |
|
|
a |
|
|
|
|
|
a |
a |
a |
Kazakhstan |
Russia |
|
nce |
Taiwan |
|
|
|
|
|||||
Brazil |
Fra |
Norway Canada |
States |
Korea |
Poland |
China |
|
|
Japan |
||||
|
|
|
|||||||||||
|
|
|
|
|
United |
South |
|
|
GermanyKingdom |
|
|||
|
|
|
|
|
|
|
|
|
|
|
United |
|
|
a. 2005 data.
Sources: US Department of Energy, Energy Information Administration; International Energy Agency; CEIC data from National Development and Reform Commission Price Monitoring Center.
and global coke prices has significantly narrowed. Beijing directly controls natural gas prices, attempting to keep them competitive in the face of competition from the Middle East in gas-intensive industries like petrochemicals. But this approach has failed to encourage development and delivery of sufficient quantities of natural gas to meet demand, and authorities are allowing domestic prices to increase.
Reported prices of electricity—the form in which China’s industry increasingly receives its energy—are high compared with those in developing and some developed countries (figure 7.4). However, based on our conversations with Chinese business leaders and industry analysts, it is likely that many industrial enterprises do not bear the full cost implied by national average figures from the Statistical Bureau. The National Development and Reform Commission (NDRC) sets electricity tariffs province-by- province based on the recommendations of local pricing bureaus, which answer to local officials. While the NDRC would like to see energy pricing rationalized to reduce overall energy consumption, it is sensitive to local social and economic development concerns. Energy-intensive firms in China typically consume more energy per unit of output than their peers
Peterson Institute for International Economics | www.petersoninstitute.org
146 CHINA’S RISE
in the OECD (on average, 20 to 40 percent more, according to some estimates18) and are thus sensitive to electricity price increases (as well as gas and coke prices, which may be low).
The recent surge in global commodity prices and inflation has challenged Beijing’s commitment to price reform. Gasoline and diesel prices, which are also directly controlled by the state, were increased by 10 and 7 percent, respectively, during 2007. In the six months following a price increase in October 2007, crude oil costs rose 33 percent, leaving Chinese gasoline and diesel prices 20 and 40 percent below US levels on average at the end April 2008.19 Coal prices also increased significantly in 2007 and during the first quarter of 2008, yet Beijing has been reluctant to increase electricity prices. As with natural gas, price controls restrict supply rather than boost demand. Loss-making oil refineries cut back production, causing filling stations to ration. In the first two months of 2008, some power generators were unwilling to buy coal at higher prices, leading to a drawdown in inventories, which contributed to the blackouts during the Chinese Spring Festival. By mid-June, these shortages had grown severe enough that the government had little choice but to raise prices, 18 percent for gasoline and diesel and 5 percent for electricity, improving the operating economics of the country’s refiners and power plants.20
Energy prices in China have not historically reflected environmental costs. Over 80 percent of the country’s electricity is generated from coal. At the end of 2006, less than 15 percent of coal power plants had flue gas desulphurization (FGD) systems (used to remove SO2 from emissions streams) installed and even fewer had them running.21 Operating an FGD system reduces production efficiency by 4 to 8 percent and therefore contributes to higher electricity prices. If all the power plants in China installed and operated FGD systems, average electricity tariffs could rise by 10 to 20 percent.22 Industries that burn coal directly (such as steel and cement) are subject to sulfur taxes, but these are generally too low to reduce pollution. Other air pollutants, such as nitrogen dioxide and mercury, are largely unregulated. Regulated or not, enforcement generally falls to the provincial and local governments, which must balance environmental concerns against economic growth priorities. In the absence of a strong environmental regulator, like the US Environmental Protection Agency, that balance is skewed toward near-term economic growth, as industry threatens to cut jobs and tax revenue if enforcement of environmental regulations is ratcheted up.
Land and Construction
In China, land is not privately owned in perpetuity but owned and allocated by the government on the people’s behalf. While private land ownership does not exist, long-term (generally 50-year) leases do and are
Peterson Institute for International Economics | www.petersoninstitute.org
ENERGY IMPLICATIONS OF CHINA’S GROWTH 147
bought and sold between both individuals and enterprises. In more developed urban real estate markets like Beijing and Shanghai, there is little difference between these land leases and an ownership deed. They are priced at market terms and transferred between holders with little interference from the state. Outside the cities, however, the government largely handles land transfers. Local officials can take farmland to create industrial parks, compensating farmers only the agricultural value, not the industrial-use value. In other words, local officials can price land well below what a firm would pay elsewhere in the world, and since industrial users will pay taxes while farmers will not, there is a powerful incentive to put land to industrial use. While land use prices are rising in coastal areas, new swaths of heavily discounted farmland are being offered for industrial use in China’s interior to lure investment.
In interviews with the authors, directors of energy-intensive firms in China emphasized the land cost advantage. The cost of transforming the land is low, and construction time short. Local governments often contribute generously to groundwork—grading, infrastructure buildout, and clustering related segments of the value chain. Relocating existing residents, carrying out environmental impact assessments, and other steps are accelerated in China to a degree not found elsewhere. Construction labor costs are dramatically lower in China than in the OECD countries. An aluminum smelter that would take three or more years to build in the United States at high labor and ground preparation costs can be constructed in China in under a year and at much lower daily cost.23 (For political and social factors bringing about low land and construction costs in China, see chapters 4 and 5.)
Capital and Consolidation
Beijing does not intend for China’s financial system to relentlessly favor heavy industry; nonetheless, the outcome has been just that: too much capital to build energy-guzzling industrial capacity. This outcome is rational from a short-term financial perspective because industrial operating costs are low, excess capacity can be exported without inducing normal exchange rate effects (thanks to the heavily managed exchange rate), and borrowers are mostly state-owned firms to which loan officers bear little career risk lending. Further, foreign firms are willing to join in many projects, contributing technology and creating backward linkages to developed-country markets.
While central authorities lean against approving investments in sectors where they see (national) overcapacity, local authorities encourage additional investments. Beijing has tried to curb lending to steel, aluminum, cement, and other industries in recent years. It has tried to prevent lending to new firms in the automobile sector; force consolidation in steel,
Peterson Institute for International Economics | www.petersoninstitute.org

148 CHINA’S RISE
Table 7.3 Industrial profit margins, on an earnings-before-tax basis (percent)
Industry |
1998 |
2002 |
2006 |
Heavy industry |
|
|
|
Iron and steel |
0.80 |
4.60 |
5.20 |
Nonferrous metals |
–0.80 |
3.20 |
6.80 |
Cement and glass |
–0.40 |
3.70 |
5.30 |
Paper and pulp |
1.80 |
5.00 |
5.20 |
Basic chemicals |
1.00 |
4.00 |
5.60 |
Light industry |
|
|
|
Textiles and apparel |
0.20 |
3.10 |
3.90 |
Furniture manufacturing |
3.70 |
4.00 |
4.40 |
Computers and telecom |
4.30 |
4.80 |
3.30 |
Electronic machinery |
2.60 |
5.00 |
4.70 |
|
|
|
|
Note: Calculated as earnings before tax divided by total sales revenue.
Source: CEIC data from ISI Emerging Markets.
coal, and other sectors; and raise borrowing costs for energy-intensive industries in general. But in most cases, especially at the local level, financing of additional capacity continues, and little unauthorized capacity is ever shut down.
Since 1998, profit margins on an earnings-before-tax (EBT) basis24 have recovered from less than 1 percent to between 4 and 7 percent for China’s most energy-hungry industries (table 7.3). In 2007 profit margins in metals, glass, chemicals, and cement exceeded those in textiles, apparel, furniture, and electronics. The aluminum industry has seen a particularly dramatic increase in profitability, with EBT margins increasing from 5 to 14 percent in the past four years. Recent survey work calculating return on investment in 12,400 firms across the country supports sectorwide profit data trends.25 Since 2002, iron and steel profits have surpassed those in most light industries.26
Some debate whether China’s firms are truly profitable. Shan Weijian of TPG, an investment firm, argues that the value of debt-to-equity swaps and bank recapitalization has exceeded the entire pretax profits of the industrial sector since 1999—suggesting zero profitability but for lax bank financing on a gargantuan scale. This theory suggests that the direction China is headed is wrong but that from the borrowers’ short-term perspective, does not contradict their instinct to pile into energy-intensive industries. Additionally, if banks are told not to lend or to charge higher rates, many SOEs can self-finance with retained earnings: Enterprise bank deposits—like household deposits—earn minimal interest, so there is little reason not to reinvest. If SOE shareholders—the government—were paid a reasonable share of profits as dividends, these firms’ investment criteria
Peterson Institute for International Economics | www.petersoninstitute.org

ENERGY IMPLICATIONS OF CHINA’S GROWTH 149
Table 7.4 Global steel industry: Production, market share, and industry concentration, 2006
|
|
|
Share of top |
|
Production |
Share |
three firms |
|
(million tons |
(percent of |
(percent of domestic |
Country/region |
of crude) |
global production) |
production)a |
China |
422 |
34.60 |
14.10 |
EU-25 |
198 |
16.30 |
44.70 |
Japan |
116 |
9.50 |
69.30 |
United States |
99 |
8.10 |
59.70 |
Russia |
71 |
5.80 |
55.10 |
South Korea |
48 |
4.00 |
85.80 |
World |
1,219 |
100 |
— |
|
|
|
|
a. Share of domestic production from the three largest companies in 2005.
Sources: CEIC data from ISI Emerging Markets; International Iron and Steel Institute, www.world steel.org; company annual reports.
might be different, but the dividend policy reforms announced for 2008 are trivial in this regard.27
High profits impede rational resource allocation. The NDRC has promoted steel industry consolidation for years, not only to reduce energy consumption but also to nurture Chinese steel companies with scale to compete worldwide. Yet the number of steel enterprises doubled between 2002 and 2006, as firms saw profit opportunities and joined in. The three largest of China’s 7,000 steel companies are now world class but accounted for only 14 percent of Chinese production in 2006. Compare this with Japan, South Korea, and the United States, where the top three companies each control well over half the market (table 7.4). China’s steel industry is balkanized, with many provinces promoting their own champions. Local officials often resist attempts to consolidate firms. Conditions are similar in other energyintensive industries. At the end of 2006, China had 381 aluminum companies, 3,388 paper and pulp companies, 2,982 glass companies, 5,210 cement companies, and 20,083 chemicals companies. Despite government attempts at consolidation, these industries have further fragmented, as rising profits and local encouragement attract more companies (table 7.5).
Were it not for the export safety valve, this pile-on would have created profit-eroding overcapacity. China’s metals companies, in particular, have been able to utilize capacity and remain profitable by selling overseas, accounting for much of the growth in China’s trade surplus since 2004. In 2002 China’s steel imports exceeded exports by 450 percent. In 2006 exports exceeded imports by 230 percent, making China not only the world’s largest steel producer but also the largest exporter. China’s iron and steel industry was responsible for 18 percent of national energy consumption
Peterson Institute for International Economics | www.petersoninstitute.org