


Fires in the United States During 2011
Fact Sheet
1,389,500 fires were reported in the U.S. during 2011.
Increase 4% from 2010 3,005 civilian fire deaths On civilian death occurred
every two hours and 55 minutes 17,500 civilian fire injuries
One civilian injury occurred every 30 minutes
$11.7 billion in property damage
A fire department responded to a fire every 23 seconds
Fires in the United States During 2011
Structure
Fires
35%
Outside
and Other
Fires
49%
Vehicle
Fires
16%
484,500 structure fires occurred in the U.S. during 2011.
Less than 1% increase from 2010
2,640 civilian fire deaths
15,635 civilian fire injuries
$9.7 billion in property damage One structure fire was reported every 65 seconds
219,000 vehicle fires occurred in the U.S. during 2011.
Increase 2% from 2010
300 civilian fire deaths
1,190 civilian fire injuries
$1.4 billion in property damage
One vehicle fire was reported every 144 seconds
686,000 outside and other fires occurred in the U.S. during 2011.
increase 8% from 2010 65 civilian fire deaths
675 civilian fire injuries
$616 million in property damage
One outside fire was reported every 46 seconds
Fire Loss in the U.S., 9/12 |
v |
NFPA Fire Analysis and Research, Quincy, MA |

NFPA’s Fire Safety Resources
NFPA´s wealth of fire-related research includes investigations of technically significant fire incidents, fire data analysis, and the Charles S. Morgan Technical Library, one of the most comprehensive fire literature collections in the world. In addition, NFPA´s Fire Protection Research Foundation is a source of independent fire test data. Find out more at: www.nfpa.org/research
Properly installed and maintained smoke alarms are necessary to provide a warning of any fire to all occupants. You can find out more information about smoke alarms here: NFPA Smoke Alarm Information
Home fire sprinkler systems provide even greater protection. These systems respond quickly to reduce the heat, flames, and smoke from a fire until help arrives. More information about home fire sprinklers may be found at www.firesprinklerinitiative.org
Research Advocacy
Codes & |
Public |
Standards |
Education |
NFPA also develops, publishes, and disseminates more than 300 consensus codes and standards intended to minimize the possibility and effects of fire and other risks. Among these are:
NFPA1: Fire Code:
NFPA 101: Life Safety Code®:
NFPA 13R: Standard for the Installation of Sprinkler Systems in Residential Occupancies up to and Including Four
For consumers: NFPA has consumer safety information regarding causes, escape planning, fire & safety equipment, and many other topics.
For Kids: Sparky.org has important information for kids delivered via fun games, activities, and cartoons.
For public educators: Resources on fire safety education programs, educational messaging, grants & awards, and many other topics.
Fire Loss in the U.S., 9/12 |
vi |
NFPA Fire Analysis and Research Quincy, MA |
Number of Fires
In 2011, public fire departments responded to 1,389,500 fires in the United States, according to estimates based on data the NFPA received from fire departments responding to its 2011 National Fire Experience Survey (see Tables 1 and 2). (A fire department is a public organization that provides fire prevention, fire suppression and associated emergency and non-emergency services to a jurisdiction such as a county, municipality, or organized fire district.) This represents an increase of 4.4% from last year.
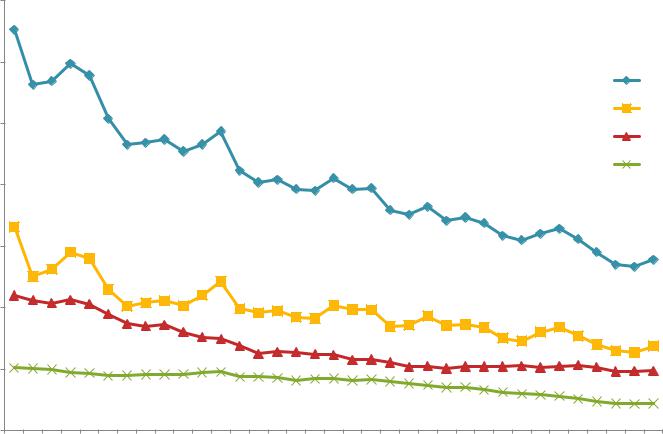
There was an estimated 484,500 structure fires reported to fire departments in 2011, a very slight increase of 0.5%, or virtually no change from a year ago. For the 1977-2011 period, the number of structure fires were at their peak in 1977 when 1,098,000 structure fires occurred (see Figure 1). The number of structure fires then decreased quite steadily particularly in the 1980s to 688,000 by the end of 1989 for an overall decrease of 37.3% from 1977. Since 1989, structure fires again decreased steadily for an overall decrease of 24.7% to 517,500 by the end of 1998. They stayed in the 505,000 to 530,500 area from 1999 to 2008, before the decrease to 480,500 in 2009, and the slight increases in 2010 and 2011.
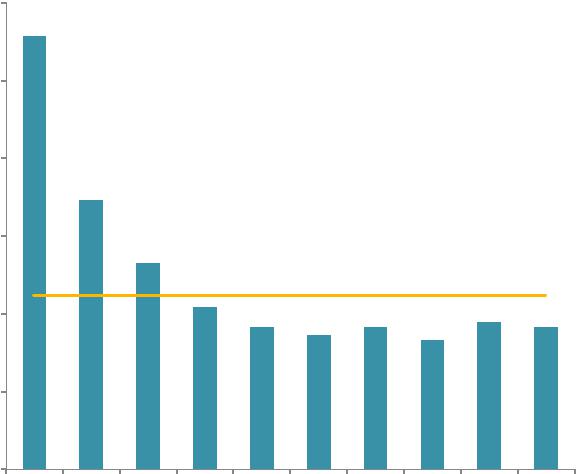
Fire incident rates by community size were examined for the 2007-2011 period (see Figure 2). The smallest communities (populations less than 2,500) had the highest rate with 11.1 which was more than twice the average national rate.
Of the structure fires, 386,000 were residential fires, accounting for 80% of all structure fires, and a very slight increase of 0.5% from a year ago. Of the residential structure fires, 274,500 occurred in oneand two-family homes, accounting for 56.7% of all structure fires. Another 95,500 occurred in apartments accounting for 19.7% of all structure fires.
For nonresidential structure fires, some property types showed several changes: an increase of 18.2% to 6,500 in institutional properties, and an increase of 11.1% to 10,000 in industrial properties.
For the 1977-2011 period, the number of outside fires were at their high in 1977 when 1,658,500 outside fires occurred. The number of outside fires decreased steadily the next six years to 1,011,000 in 1983 for a considerable decrease of 39.0% from 1977. Outside fires changed little for the rest of the 1980s except for 1988 when 1,214,000 occurred. Outside fires dropped to 910,500 in 1993, and stayed near the 1,000,000 level
Fire Loss in the U.S., 9/12 |
1 |
NFPA Fire Analysis and Research Quincy, MA |
Table 1
Estimates of 2011 Fires, Civilian Deaths, Civilian Injuries
and Property Loss in the United States
|
|
|
Percent Change |
|
Estimate |
Range1 |
From 2010 |
|
|
|
|
Number of Fires |
1,389,500 |
1,361,500 |
+4.4** |
|
|
to 1,417,500 |
|
Number of Civilian |
|
|
|
Deaths |
3,005 |
2,665 to 3,345 |
-3.7 |
|
|
|
|
Number of Civilian |
|
|
|
Injuries |
17,500 |
16,540 to 18,460 |
-1.2 |
|
|
|
|
Property Loss2 |
$11,659,000,000 |
$11,319,000,000 |
+0.6 |
|
|
to 11,999,000,000 |
|
The estimates are based on data reported to the NFPA by fire departments that responded to the 2011 National Fire Experience Survey.
1These are 95 percent confidence intervals.
2This includes overall direct property loss to contents, structures, vehicles, machinery, vegetation, and anything else involved in a fire. It does not include indirect losses. No adjustment was made for inflation in the year-to-year comparison.
**Change was statistically significant at the .01 level.
Fire Loss in the U.S., 9/12 |
2 |
NFPA Fire Analysis and Research Quincy, MA |
Table 2
Estimates of 2011 Fires and
Property Loss by Property Use
|
|
Number of Fires |
Property Loss¹ |
||
|
|
|
Percent Chang |
|
Percent Chan |
Type of Fire |
|
Estimate |
from 2010 |
Estimate |
from 2010 |
|
|
|
|
|
|
Fires in Structures |
484,500 |
+0.5 |
$9,693,000,000 |
-0.2 |
|
Fires in Highway Vehicles |
187,500 |
+1.6 |
$1,016,000,000 |
+2.9 |
|
|
|
|
|
|
|
Fires in Other Vehicles² |
31,500 |
+1.6 |
$334,000,000 |
-14.1 |
|
|
|
|
|
|
|
Fires Outside but no vehicle (outside-storage, |
|
|
|
|
|
Crops, Timber, etc.) |
79,000 |
+9.0 |
$541,000,000 |
+31.0** |
|
|
|
|
|
|
|
Fires in Brush, Gras |
|
|
|
|
|
Wildland (excluding crops and timber) |
|
|
|
|
|
with no value or loss involved |
338,000 |
+11.2 |
— |
— |
|
|
|
|
|
|
|
Fires in Rubbish |
|
|
|
|
|
Including dumpsters (outside of structures), |
|
|
|
|
|
with no value or loss involved |
180,500 |
+4.3 |
— |
— |
|
|
|
|
|
|
|
All Other Fires |
88,500 |
+4.7 |
$75,000,000 |
-14.8 |
|
|
|
|
|
|
|
Total |
1,389,500 |
+4.4 |
$11,659,000,000 |
|
|
The estimates are based on data reported to the NFPA by fire departments that responded to the 2011 National Fire Experience Survey.
1This includes overall direct property loss to contents, structure, a vehicle, machinery, vegetation or anything else involved in a fire. It does not include indirect losses, e.g., business interruption or temporary shelter costs. No adjustment was made for inflation in the year-to-year comparison.
2This includes trains, boats, ships. aircraft, farm vehicles and construction vehicles.
*Change was statistically significant at the .05 level. **Change was statistically significant at the .01 level.
Fire Loss in the U.S., 9/12 |
3 |
NFPA Fire Analysis and Research Quincy, MA |
Table 3
Estimates of 2011 Structure Fires and
Property Loss by Property Use
|
Structure Fires |
Property Loss1 |
||
|
|
Percent |
|
Percent |
|
|
Change |
|
Change |
Property Use |
Estimate |
from 2010 |
Estimate |
from 2010 |
|
|
|
|
|
|
|
|
|
|
Public Assembly |
12,500 |
+4.2 |
$446,000,000 |
+5.9 |
|
|
|
|
|
Educational |
5,000 |
-9.1 |
44,000,000 |
-42.1** |
|
|
|
|
|
Institutional |
6,500 |
+18.2 |
52,000,000 |
+40.5 |
|
|
|
|
|
Residential (Total) |
386,000 |
+0.5 |
7,054,000,000 |
-0.4 |
Oneand Two-Family |
|
|
|
|
Homes2 |
274,500 |
-1.6 |
5,746,000,000 |
-2.5 |
Apartments |
95,500 |
+5.5 |
1,168,000,000 |
+13.1 |
Other Residential3 |
16,000 |
+10.3 |
140,000,000 |
-7.3 |
|
|
|
|
|
Stores and Offices |
18,500 |
+2.8 |
625,000,000 |
-14.4 |
|
|
|
|
|
Industry, Utility, |
|
|
|
|
Defense4 |
10,000 |
+11.1 |
620,000,000 |
+20.4 |
|
|
|
|
|
Storage in Structures |
27,000 |
-3.6 |
721,000,000 |
-4.6 |
|
|
|
|
|
Special Structures |
19,000 |
-5.0 |
131,000,000 |
+28.4 |
|
|
|
|
|
Total |
484,500 |
+0.5 |
$9,693,000,000 |
-0.2 |
The estimates are based on data reported to the NFPA by fire departments that responded to the 2011 National Fire Experience Survey.
1This includes overall direct property loss to contents, structure, a vehicle, machinery, vegetation or anything else involved in a fire. It does not include indirect losses, e.g., business interruption or temporary shelter costs. No adjustment was made for inflation in the year-to-year comparison.
2This includes manufactured homes.
3Includes hotels and motels, college dormitories, boarding houses, etc.
4Incidents handled only by private fire brigades or fixed suppression systems are not included in the figures shown here. *Change was statistically significant at the .05 level.
**Change was statistically significant at the .01 level..
Fire Loss in the U.S., 9/12 |
4 |
NFPA Fire Analysis and Research Quincy, MA |
3,500,000 |
3,264,500 |
|
|
|
|
|
|
|
|
|
|
|
|
Figure 1 |
|
|
|
|
|
|
|
|
|
|
|
|
|
|
|
|
|||||
|
|
|
|
|
|
|
|
|
|
Estimate of Fires by Type |
|
|
|
|
|
|
|
|
|
|
|
|
|
|
|||||||||||
|
|
|
|
|
|
|
|
|
|
|
|
|
|
|
|
|
|
|
|
|
|
|
|
|
|
|
|
||||||||
|
|
|
|
|
|
|
|
|
|
|
|
|
in the United States (1977-2011) |
|
|
|
|
|
|
|
|
|
|
|
|
|
|||||||||
3,000,000 |
|
|
|
|
|
|
|
|
|
|
|
|
|
|
|
|
|
|
|
|
|
|
|
|
|
|
|
|
|
|
|
|
|
|
|
|
|
|
|
|
|
|
|
|
|
|
|
|
|
|
|
|
|
|
|
|
|
|
|
|
|
|
|
|
|
|
|
|
|
|
Total |
|
|
|
|
|
|
|
|
|
|
|
|
|
|
|
|
|
|
|
|
|
|
|
|
|
|
|
|
|
|
|
|
|
|
|
Outside |
2,500,000 |
|
|
|
|
|
|
|
|
|
|
|
|
|
|
|
|
|
|
|
|
|
|
|
|
|
|
|
|
|
|
|
|
|
|
Structure |
|
|
|
|
|
|
|
|
|
|
|
|
|
|
|
|
|
|
|
|
|
|
|
|
|
|
|
|
|
|
|
|
|
|
|
|
|
|
|
|
|
|
|
|
|
|
|
|
|
|
|
|
|
|
|
|
|
|
|
|
|
|
|
|
|
|
|
|
|
|
|
Vehicle |
2,000,000 |
|
|
|
|
|
|
|
|
|
|
|
|
|
|
|
|
|
|
|
|
|
|
|
|
|
|
|
|
|
|
|
|
|
|
|
|
1,658,500 |
|
|
|
|
|
|
|
|
|
|
|
|
|
|
|
|
|
|
|
|
|
|
|
|
|
|
|
|
|
|
|
|||
1,500,000 |
|
|
|
|
|
|
|
|
|
|
|
|
|
|
|
|
|
|
|
|
|
|
|
|
|
|
|
|
|
|
|
|
|
|
1,389,500 |
|
|
|
|
|
|
|
|
|
|
|
|
|
|
|
|
|
|
|
|
|
|
|
|
|
|
|
|
|
|
|
|
|
|
|
|
1,000,000 |
1,098,000 |
|
|
|
|
|
|
|
|
|
|
|
|
|
|
|
|
|
|
|
|
|
|
|
|
|
|
|
|
|
|
|
|||
|
|
|
|
|
|
|
|
|
|
|
|
|
|
|
|
|
|
|
|
|
|
|
|
|
|
|
|
|
|
686,000 |
|||||
|
|
|
|
|
|
|
|
|
|
|
|
|
|
|
|
|
|
|
|
|
|
|
|
|
|
|
|
|
|
|
|
|
|
||
|
508,000 |
|
|
|
|
|
|
|
|
|
|
|
|
|
|
|
|
|
|
|
|
|
|
|
|
|
|
|
|
|
|
|
|
||
500,000 |
|
|
|
|
|
|
|
|
|
|
|
|
|
|
|
|
|
|
|
|
|
|
|
|
|
|
|
|
|
|
|
|
|
|
484,500 |
|
|
|
|
|
|
|
|
|
|
|
|
|
|
|
|
|
|
|
|
|
|
|
|
|
|
|
|
|
|
|
|
|
|
|
|
|
|
|
|
|
|
|
|
|
|
|
|
|
|
|
|
|
|
|
|
|
|
|
|
|
|
|
|
|
|
|
|
|
|
219,000 |
|
0 |
1977 |
1978 |
1979 |
1980 |
1981 |
1982 |
1983 |
1984 |
1985 |
1986 |
1987 |
1988 |
1989 |
1990 |
1991 |
1992 |
1993 |
1994 |
1995 |
1996 |
1997 |
1998 |
1999 |
2000 |
2001 |
2002 |
2003 |
2004 |
2005 |
2006 |
2007 |
2008 |
2009 |
2010 |
2011 |
|
|||||||||||||||||||||||||||||||||||
Fire Loss in the U.S., 9/12 |
5 |
NFPA Fire Analysis and Research Quincy, MA |
Fires per Thousand Population
12.0
11.1 |
Figure 2. Fires per Thousand Population |
|
by Size of Community (2007 2011) |
||
|
10.0
8.0 |
|
|
|
|
|
|
|
6.9 |
|
|
|
|
|
6.0 |
5.3 |
|
|
|
|
|
|
|
|
|
|
||
|
4.2 |
National Rate 4.6 |
|
|
||
|
|
|
3.8 |
|
||
4.0 |
3.6 |
3.4 |
3.6 |
3.6 |
||
3.3 |
||||||
|
|
|
|
|||
|
|
|
|
|
||
2.0
0.0
Under |
2,500 to |
5,000 to |
10,000 to |
25,000 to |
50,000 to |
100,000 to 250,000 to 500,000 to 1,000,0000 |
|||
2,500 |
4,999 |
9,999 |
24,999 |
49,999 |
99,999 |
249,999 |
499,999 |
999,999 |
or more |
Size of Community
Fire Loss in the U.S., 9/12 |
6 |
NFPA Fire Analysis and Research, Quincy, MA |