

Civilian Fire Injuries
Results based on data reported to the NFPA indicate that in addition to 3,005 civilian fire deaths, there were an estimated 17,500 civilian fire injuries in 2011. This represents a slight decrease of 1.2%.
Estimates of civilian fire injuries are on the low side, because many civilian injuries are not reported to the fire service. For example, many injuries occur at small fires that fire departments do not respond to, and sometime when departments do respond they may be unaware of injured persons that they did not transport to medical facilities.
The NFPA estimates that there were 14,360 civilians injured in residential properties, an increase of 4.1%. Of these injuries 9,485 occurred in oneand two-family homes, and 4,425 occurred in apartments. There were also 1,275 civilians injured in nonresidential structures in 2011.
For the 1977-2011 period, the number of civilian injuries has ranged from a high of 31,275 in 1983 to a low of 16,400 in 2006 for an overall decrease of 48%. There was no consistent pattern going up or down until 1995, when injuries fell roughly 5,000 in 1994-95 to 25,775. From 1996 to 2002, injuries declined 28% to 18,425 by the end of 2002. Since 2002, civilian injuries have been in the range of 16,400 to 18,425.
Fire Loss in the U.S., 9/12 |
12 |
NFPA Fire Analysis and Research, Quincy, MA |
Property Loss
The NFPA estimates that the 1,389,500 fires responded to by the fire service caused $11,659,000,000 in property damage in 2011. This is a very slight increase of 0.6%.
Fires in structures resulted in $9,693,000,000 in property damage, a very slight decrease of 0.2%. Average loss per structure fire was $20,006, a slight decrease of 0.8%.
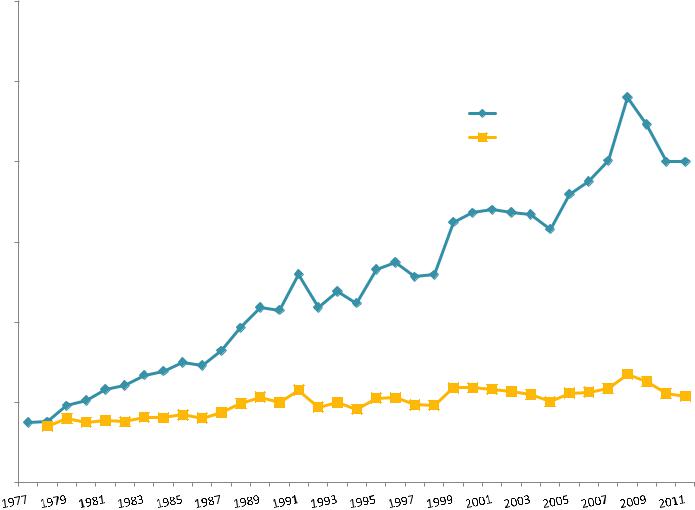
Over the 1977-2011 period, and excluding the events of 9/11/01, the average loss per structure fire was $3,757 in 1977 and $20,006 in 2011 for an overall increase of 432%. When property loss is adjusted for inflation, the increase in the average structure fire loss between 1977 and 2011 is 43%.
Of the property loss in structures, $7,054,000,000 occurred in residential properties, a very slight decrease of 0.4%. An estimated $5,746,000,000 occurred in oneand two-family homes, a decrease of 2.5%. An estimated $1,168,000,000 also occurred in apartments.
Other property damage figures worth noting for 2011 include: $131,000,000 in special structures, an increase of 28.4%; $620,000,000 in industrial properties, an increase of 20.4%; $52,000,000 in institutional properties, an increase of 40.5%; and $44,000,000 in educational properties, a decrease of 42.1%, $541,000,000 in fires outside of structure with value involved, a significant increase of 31.0% (this reflects the Bastrop County Texas Complex Wildfire with an estimated property loss of 400,000,000).
It should be kept in mind that property loss totals can change dramatically from year to year because of the impact of occasional large loss fires. The NFPA provides an analysis of these large loss fires in the November/December issue of NFPA Journal every year.
Fire Loss in the U.S., 9/12 |
13 |
NFPA Fire Analysis and Research, Quincy, MA |
30,000 |
Figure 5. Average Loss per Structure |
|
|
||
|
Fire in the United States (1977-2011) |
|
25,000 |
|
|
20,000 |
|
Unadjusted |
15,000 |
|
|
10,000 |
|
|
|
|
Adjusted for Inflation |
|
|
$20,006 |
5,000 |
|
|
|
|
$5,390 |
|
$3,757 |
|
0 |
|
|
Source: NFPA Survey of Fire Departments (1977-2011) |
Year |
|
Fire Loss in the U.S., 9/12 |
14 |
NFPA Fire Analysis and Research, Quincy, MA |
Intentionally Set Fires
Based on data reported by fire departments in the survey, the NFPA estimates there were 26,500 intentionally set structure fires in 2011, a decrease of 3.6% from a year ago (see Table 5). (Note the NFPA survey is based on the NFIRS 5.0 system. This system has an intentionally set category which is equivalent to the old incendiary category. There is no new equivalent to the old suspicious category, which has been eliminated.) Also, these estimates do not include any allocation of fires with cause unknown or unreported.5
These intentionally set structure fires resulted in an estimated 190 civilian deaths, a decrease of 5.0%. These set structure fires also resulted in $601,000,000 in property loss, an increase of 2.7%.
Also in 2011, there were an estimated 14,000 intentionally set vehicle fires, no change from a year ago. These set vehicle fires resulted in $88,000,000 in property loss, a slight decrease of 1.1% from a year ago.
Fire Loss in the U.S., 9/12 |
15 |
NFPA Fire Analysis and Research, Quincy, MA |
|
|
|
Table 5 |
|
|
Estimate of 2011 Losses in |
|
|
|
Intentionally Set Structure Fires |
|
|
|
|
|
Intentionally2 Set |
|
Estimate |
Percent change |
Structure Fires |
|
|
from 2010 |
|
|
|
|
Number of Structure Fires |
26,500 |
-3.6 |
|
|
|
|
|
Civilian Deaths |
190 |
-5.0 |
|
|
|
|
|
Property Loss1 |
$601,000,000 |
+2.7 |
|
The estimates are based on data reported to the NFPA by fire departments that responded to the 2011 National Fire Experience Survey.
1 This includes overall direct property loss to contents, structure, a vehicle, machinery, vegetation, or anything else involved in a fire. It does not include indirect losses, e.g., business interruption or temporary shelter costs. No adjustment was made for inflation in the year-to-year comparison.
2The NFPA Survey is based on the NFIRS 5.0 system. This system has an intentionally set category which is equivalent to the old incendiary category. There is no new equivalent to the old suspicious category, which has been eliminated.
Fire Loss in the U.S., 9/12 |
16 |
NFPA Fire Analysis and Research, Quincy, MA |