

ppl_04_e2
.pdfCustomer: Oleg Ostapenko E-mail: ostapenko2002@yahoo.com
CHAPTER 12
LOW LEVEL WINDS
157

|
Order: 6026 |
Customer: Oleg Ostapenko E-mail: ostapenko2002@yahoo.com |
|
Customer: Oleg Ostapenko E-mail: ostapenko2002@yahoo.com |
|
C H A P T ER 1 2 : L O W |
L EV EL W INDS |
158

ID: 3658
Customer: Oleg Ostapenko E-mail: ostapenko2002@yahoo.com
Customer: Oleg Ostapenko E-mail: ostapenko2002@yahoo.com
C H A P T ER 1 2 : L O W L
INTRODUCTION.
This chapter concentrates on those winds which blow within the first few thousand feet of the surface. It examines what creates wind, what the forces involved are, and, how these change as the wind interacts with its environment, particularly the surface over which it flows. Wind is defined as the sustained horizontal flow of air over the earth. To begin with, the measurement of wind velocity and its units will be examined.
WIND DIRECTION.
Wind is usually represented as a velocity indicating both wind direction and wind speed. The direction of movement of any object is usually given in degrees from north. This scale starts from zero, which is north, all the way through to three hundred and sixty degrees, which is another way of expressing north. Wind direction is given, not as the heading of the wind, but rather as an indication of where the wind is coming from.
For example, a wind blowing towards the east is called a westerly wind and would therefore be shown as having a direction of 270 degrees. This is all shown diagrammatically in Figure 12.1.
Figure 12.1 Wind Direction - reported from where the wind is coming from and measured in degrees from true north (sometimes magnetic north).
Normally in meteorology the wind direction is given relative to true north. When using such wind directions in flight planning be careful to adjust them using the relevant variation so that their direction is relative to magnetic north although typically navigation planning is usually done in degrees true and the variation is factored in at the end by adding it to, or subtracting it from, the true heading that is the result of the calculation of the triangle of velocities.
There are two occasions when the reported winds are given as magnetic directions and not true directions. These are whenever wind is reported by an air traffic controller from a tower, on take off and landing for instance, (or an AFISO or A/G radio operator) and in the recorded aerodrome terminal information service or ATIS.
The wind
velocity has both
direction and
magnitude. The direction of the wind is always quoted as that from which the wind is coming and reference to true north, except on ATIS
broadcasts and transmissions from airfields.
159

C H A P T ER
The wind direction
is given by reference to true north on all weather
reports and forecasts except when it is given by Air Traffic Control, AFISO or Air/Ground Operator over the R/T or when it is broadcast on ATIS.
Order: 6026
Customer: Oleg Ostapenko E-mail: ostapenko2002@yahoo.com
Customer: Oleg Ostapenko E-mail: ostapenko2002@yahoo.com |
|
1 2 : L O W |
L EV EL W INDS |
Changes in the direction of the wind are expressed using the terms backing and veering. A wind that is veering is changing direction in a clockwise manner. For example, a wind that was zero nine zero degrees and is now one eight zero degrees would be described as veering. A wind is said to be backing if the direction change of the wind is anticlockwise. For example, a wind that was two seven zero degrees, and is now one eight zero would be described as backing. See Figure 12.2.
Figure 12.2 (Left) Veering - a clockwise change in direction (Right) Backing - an anti-clockwise change in direction
WIND SPEED.
The wind is reported as a velocity that is, both its direction and speed are given. The standard unit of speed is the metre per second. More generally however, the unit adopted for operational purposes in aviation is the knot; one knot equals one nautical mile per hour.
INSTRUMENTS FOR MEASURING WIND VELOCITY.
Measuring wind velocity is quite simple. The most commonly used instrument is the cup anemometer and wind vane which is shown in Figure 12.3. The three cups capture the wind and, as a result, rotate about a spindle. The direction of the wind is measured by a remote transmitting wind vane. These instruments are used around airfields to calculate the approximate surface wind velocity for aircraft either taking off or landing.
The definition of the surface wind is one that blows at 10 metres above ground level. Consequently, these instruments are placed 10 metres above ground level and clear of any nearby obstacles that may unduly disturb the flow of air and give misrepresentative readings.
160

ID: 3658
Customer: Oleg Ostapenko E-mail: ostapenko2002@yahoo.com
Customer: Oleg Ostapenko E-mail: ostapenko2002@yahoo.com
C H A P T ER 1 2 : L O W L
Figure 12.3 Wind Instruments. Speed - Cup anemometer. Direction - wind vane. Airfield surface wind measurements are measured 10m above the ground.
WIND SYMBOLS ON CHARTS.
On some weather charts wind speed and direction are shown by symbols. Figure 12.4 shows an example of how they are presented. The circle denotes the point of observation or the location of the reading. The direction is shown by a straight line coming from the circle. This line points towards the direction from which the wind is blowing.
Figure 12.4 Wind representation and coding on some charts.
Shown here is a wind from 270 degrees, in other words a westerly wind. The wind speed coding is attached to the line emanating from the circle. A thin straight line or ‘feather’ represents 10 knots, a short line or feather represents 5 knots and the triangle a speed of 50 knots. So this example gives the speed as 65 knots.
161
|
Order: 6026 |
Customer: Oleg Ostapenko E-mail: ostapenko2002@yahoo.com |
|
Customer: Oleg Ostapenko E-mail: ostapenko2002@yahoo.com |
|
C H A P T ER 1 2 : L O W |
L EV EL W INDS |
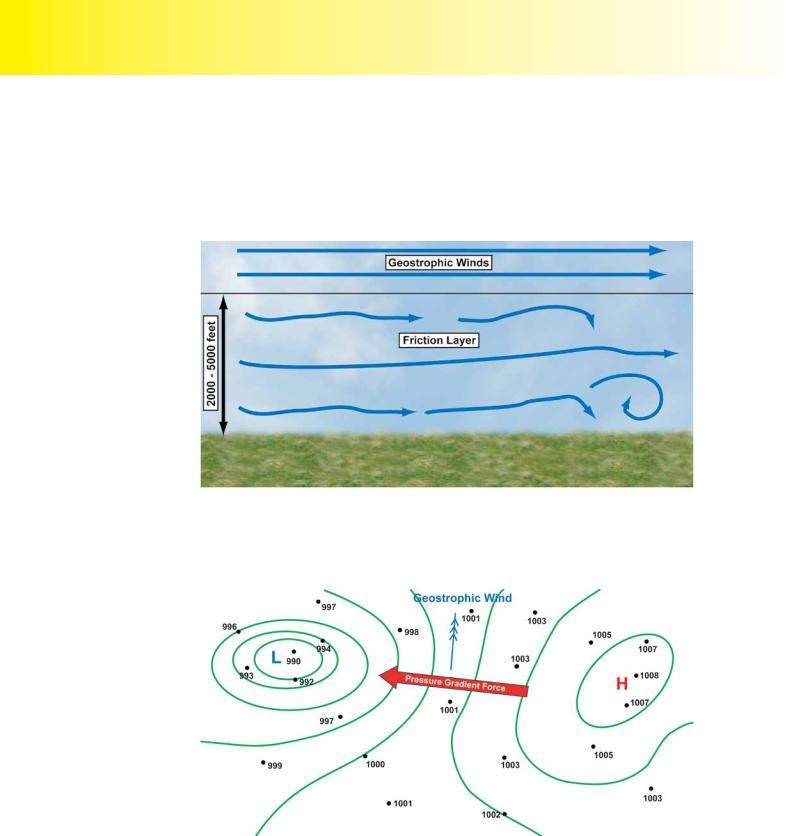
THE GEOSTROPHIC WIND.
The study of air flow is complex and in order to understand it certain conditions must be assumed and simplified models constructed. The first of these is the Geostrophic
Wind. This is the wind that blows above the friction layer and is unaffected by surface frictional forces, as shown in Figure 12.5.
Figure 12.5 The geostrophic wind blows above the friction layer..
The Geostrophic wind blows in a constant direction, parallel to straight isobars. The geostrophic wind is subject to two forces. These forces are in balance and work opposite to each other.
Figure 12.6 The Pressure Gradient Force. This force acts from high to low pressure and determines the wind strength. Isobar spacing tells us its strength.
The first force is the Pressure Gradient Force (PGF); this is the force that acts from high to low pressure. Closely spaced isobars tell us that the PGF is strong. This situation is common in low pressure systems. Widely spaced isobars tell us that the pressure gradient force is weak. This is common in most high pressure systems. It is the pressure gradient force that determines the strength of the wind.
162

ID: 3658
Customer: Oleg Ostapenko E-mail: ostapenko2002@yahoo.com
Customer: Oleg Ostapenko E-mail: ostapenko2002@yahoo.com
C H A P T ER 1 2 : L O W L
If the PGF is very large, then there will be a rapid movement of air and the resulting winds will be very strong. However, if the PGF is very weak, then the air will move slowly resulting in light winds. Figure 12.6 shows high and low pressure patterns with the PGF indicated by the red arrow.
The force which balances the PGF is the Coriolis force (CF). Coriolis force arises from the rotation of the earth on its axis in space; it is at a maximum at the poles and is at zero at the equator. (This statement is sufficient for this level of knowledge; a detailed explanation including the mathematical formula is available on the Oxford Aviation Academy CD ROM, Aviation Meteorology at ATPL level)
In the northern hemisphere the Coriolis force acts at 90 degrees to the wind direction, deflecting it to the right. This results in a wind diagram like the one shown in Figure 12.7 The two forces are acting opposite to each other and in balance. The PGF pulling air to the left and the Coriolis force pulling to the right.
Figure 12.7 The balance of forces in the Geostrophic Wind with Pressure Gradient Force and Coriolis force perfectly opposing each other.
The geostrophic wind blows parallel to straight isobars but how does it get that way? Looking at the Figure 12.8, overleaf, it can be seen that the pressure gradient will cause the air to flow towards the low, but, as the air moves, the Coriolis force in the northern hemisphere deflects the air to the right, causing the wind to blow parallel to the isobars.
The Coriolis force is directly proportional to the wind speed and so as the pressure gradient force accelerates the air from the area of high pressure towards the area of low pressure the Coriolis acting at right angles to the wind direction deflects it to the right in the northern hemisphere until the pressure gradient force and the Coriolis force are balancing each other as in Figure 12.7. and the wind is blowing along the isobars.
The development of this situation is shown in Figure 12.8, overleaf. To remember which way the wind is blowing around pressure systems use Buys-Ballot’s law, which states that if an observer’s back is to the wind in the northern hemisphere, the low pressure will be on the left.
Coriolis force
deflects the wind to the
right in the
northern hemisphere. It is directly proportional to the
wind speed and the latitude.
163

|
Order: 6026 |
Customer: Oleg Ostapenko E-mail: ostapenko2002@yahoo.com |
|
Customer: Oleg Ostapenko E-mail: ostapenko2002@yahoo.com |
|
C H A P T ER 1 2 : L O W |
L EV EL W INDS |
Buys-Ballot’s law states
that with observer’s
back to the wind in the northern hemisphere low pressure will be on the left.
Figure 12.8 CF always acts at 90º to the wind direction, and increases with increasing wind speeds.
To calculate the wind speed using a surface pressure chart, measure the spacing between two isobars and use that spacing on the geostrophic wind scale to read off the speed. When calculating the distance between the isobars ensure you note the approximate latitude so that you may use the part of the Geostrophic Wind Scale that corresponds to that latitude. Shown in Figure 12.9 is an isobar spacing taken from 65°N that when used on the Geostrophic Wind Scale at 65°N gives a Geostrophic wind speed of 50 knots
Figure 12.9 To calculate the speed of the geostrophic wind use the geostrophic wind scale, remembering to use the appropriate latitude.
The geostrophic wind blows above the friction layer, as shown in Figure 12.5. Friction is another force acting on the wind and because the geostrophic wind only has two forces, there can be no geostrophic wind within the friction layer.
The height of the friction level changes, depending on the time of day and the nature of the surface and so now the wind in the friction layer will be described; this is generally known as the surface wind.
164

ID: 3658
Customer: Oleg Ostapenko E-mail: ostapenko2002@yahoo.com
Customer: Oleg Ostapenko E-mail: ostapenko2002@yahoo.com
C H A P T ER 1 2 : L O W L
SURFACE WINDS.
The concept of the geostrophic wind is a useful benchmark in understanding other effects. In Figure 12.7 the geostrophic wind in the northern hemisphere is the result of the two forces opposing each other and in balance, with the Coriolis force acting at 90 degrees to the right of the wind direction. The geostrophic wind is the blue line pointing straight up.
The speed and direction of the geostrophic wind are modified by the reduction of the wind speed by friction with the surface and as speed reduces, so does the Coriolis force. The forces are now not balanced; the pressure gradient is now the stronger force, and will cause the wind to be deflected as shown. This deflection is purely as a result of the friction. Figure 12.10 shows how the forces and subsequent wind direction and speeds are changed as a result of surface interaction
Figure 12.10 Friction will reduce wind speeds. This reduces Coriolis force. The surface wind is deflected towards the Pressure Gradient Force.
The greater the surface friction the more the surface wind is deflected from the geostrophic. You see from Figure 12.11, that over land the deflection is approximately
30° and the speed at the surface about half that of the geostrophic wind.
Figure 12.11 There is greater friction from the land than there is from the sea, and so the difference between the geostrophic wind and the surface wind is greater over the land.
165

|
Order: 6026 |
Customer: Oleg Ostapenko E-mail: ostapenko2002@yahoo.com |
|
Customer: Oleg Ostapenko E-mail: ostapenko2002@yahoo.com |
|
C H A P T ER 1 2 : L O W |
L EV EL W INDS |
Coriolis force is proportional
the wind speed; the
surface wind speed is reduced by friction and so, therefore, is the Coriolis force with the result that the surface wind
is not deflected as much as the geostrophic wind. When an aircraft descends towards the surface the wind that
it experiences is backed and decreased from the geostrophic wind; in a climb
from the surface the wind will veer and increase.
Over the sea, which is smoother, the deflection is only approximately 10° and the surface wind speed about two thirds of the geostrophic wind.
COMPARISON OF GEOSTROPHIC AND SURFACE WINDS.
Look at Figure 12.11 and notice that the surface wind is backed and decreased with respect to the geostrophic wind. Therefore in a climb from the surface to the geostrophic wind level, the wind speed will increase and veer. This is a fundamental diagram to remember.
Figure 12.12 Surface wind in the northern hemisphere is reduced in speed and backed compared to geostrophic.
When using the diagram it is important to understand how the speed and direction of the wind varies from the surface to the friction level where the geostrophic wind is found.
Figure 12.12 is the surface pressure chart from Figure 12.6 but it now has the diagrammatic representation of the modification of the geostrophic wind into the surface wind on it. The geostrophic wind is blowing parallel to the isobars but the surface wind is blowing slight across the isobars into the area of low pressure.
DIURNAL VARIATION.
The diurnal variation of temperature affects the process described above and so there is a diurnal variation in the surface wind velocity. Again, the geostrophic wind and its forces act as a benchmark to understand what is happening.
At approximately 1500 hours the surface wind speed will be at its highest. This is due to thermal mixing with higher level, faster winds. Therefore the surface wind will only be a little slower than the geostrophic, and the Coriolis force will only be slightly less than for the geostrophic wind.
But at 0600 hours, the surface wind is at its slowest because of the lack of any thermal mixing. Since the surface wind is so slow, the Coriolis force is significantly less than that experienced by the geostrophic wind and the surface wind at 0600 will be deflected by a greater amount from the geostrophic wind.
166