

AT-3 R100 POH
.pdf„AERO” Sp. z o. o. |
SECTION 4 |
AT-3 R100 |
NORMAL PROCEDURES |
strong crosswind, also turn the aeroplane axis from the landing direction towards the crosswind.
Turn back to the landing direction immediately before touchdown.
Lowering the nose wheel earlier after touchdown helps to maintain direction. After touchdown keep the nose wheel down and control the direction with the rudder, and later with the brakes. At the end of the landing run keep the control stick against the crosswind.
4.6.5. Operational speed during takeoff and landing
Stated below in the table are the operational airspeeds for the approved wing flap positions.
|
|
|
|
|
|
TAKE-OFF IAS |
|
|
|
||||
Flaps |
|
|
|
|
|
|
|
|
|
|
|
||
Lifting the nose wheel |
|
Lifting off |
|
After the takeoff |
|||||||||
|
|
|
|
|
|
|
|
|
|
|
|
|
|
|
km/h |
|
mph |
|
kts |
km/h |
|
mph |
|
kts |
km/h |
mph |
kts |
|
|
|
|
|
|
|
|
|
|
|
|
|
|
0º |
65 |
|
40 |
|
35 |
85 |
|
53 |
|
46 |
120 |
75 |
65 |
|
|
|
|
|
|
|
|
|
|
|
|
|
|
15º |
65 |
|
40 |
|
35 |
77 |
|
48 |
|
42 |
112 |
70 |
60 |
|
|
|
|
|
|
|
|
|
|
|
|
|
|
40º |
- |
|
- |
|
- |
- |
|
- |
|
- |
- |
- |
|
|
|
|
|
|
|
|
|
|
|
|
|
|
|
|
|
|
|
|
|
LANDING IAS |
|
|
|
|
|||
|
|
|
|
|
|
|
|
|
|
|
|
||
Flaps |
|
Approach |
|
Touchdown |
Lowering the nose |
||||||||
|
|
wheel |
|
|
|||||||||
|
|
|
|
|
|
|
|
|
|
|
|
|
|
|
|
|
|
|
|
|
|
|
|
|
|
||
|
km/h |
|
mph |
|
kts |
km/h |
|
mph |
|
kts |
km/h |
mph |
kts |
|
|
|
|
|
|
|
|
|
|
|
|
|
|
0º |
120 |
|
75 |
|
65 |
98 |
|
61 |
|
53 |
80 |
50 |
43 |
|
|
|
|
|
|
|
|
|
|
|
|
|
|
15º |
112 |
|
70 |
|
60 |
90 |
|
56 |
|
49 |
78 |
48 |
42 |
|
|
|
|
|
|
|
|
|
|
|
|
|
|
40º |
100 |
|
62 |
|
54 |
80 |
|
50 |
|
43 |
<60 |
<37 |
<32 |
|
|
|
|
|
|
|
|
|
|
|
|
|
|
SEPTEMBER, 2004 |
Page 4-17 |
AEROPLANE FLIGHT MANUAL |
|
SECTION 4 |
„AERO” Sp. z o. o. |
NORMAL PROCEDURES |
AT-3 R100 |
THIS PAGE IS LEFT INTENTIONALLY BLANK
Page 4-18 |
SEPTEMBER, 2004 |
|
AEROPLANE FLIGHT MANUAL |

“AERO” Sp. z o.o. |
SECTION 5 |
AT-3 R100 |
PERFORMANCE |
Section 5
PERFORMANCE
|
|
Page |
|
|
5.1. Introduction ............................................................................... |
5-2 |
|
|
|
5.2. Approved data .......................................................................... |
5-3 |
|
|
|
5.2.1. Calibration of the airspeed indicator system ...................... |
5-3 |
|
|
|
5.2.2. Stalling speed..................................................................... |
5-4 |
|
|
|
5.2.3. Take-off performance......................................................... |
5-5 |
|
|
|
5.2.4. Landing distance ................................................................ |
5-6 |
|
|
|
5.2.5. Climb performance............................................................. |
5-8 |
|
|
|
5.3. Supplementary information..................................................... |
5-11 |
|
|
|
5.3.1. Cruise.............................................................................. |
5-11 |
|
|
|
5.3.2. Climb after balked landing |
5-13 |
|
|
|
|
|
|||
5.3.3. Take-off and landing on grass airstrips ........................... |
5-13 |
|
|
|
|
||||
5.3.4. Affect of rain or insect remains |
|
|
|
|
|
|
|
||
|
on aeroplane performance and handling ........................ |
5-13 |
|
|
|
|
|
||
5.3.5 |
Demonstrated range of operational temperatures........... |
5-13 |
|
|
5.3.6. |
Demonstrated crosswind on take-off and landing ........... |
5-14 |
|
|
5.3.7 |
Combined diagram of aeroplane characteristics ............. |
5-15 |
|
|
5.3.8. |
Noise ............................................................................... |
5-16 |
|
|
MARCH, 2011 |
Page 5-1 |
|
AEROPLANE FLIGHT MANUAL |
SECTION 5 |
“AERO” Sp. z o.o. |
PERFORMANCE |
AT-3 R100 |
5.1. Introduction |
|
This Section contains approved data concerning the following issues:
-Calibration of the airspeed indicator system.
-Stalling speeds
-Take-off performance.
-Supplementary information from the manufacturer.
The diagrams have been computed on the basis of actual flight test data, for correct engine and aircraft operation and applying average piloting techniques.
Page 5-2 |
SEPTEMBER, 2004 |
|
AEROPLANE FLIGHT MANUAL |
“AERO” Sp. z o.o. |
SECTION 5 |
AT-3 R100 |
PERFORMANCE |
5.2. Approved data
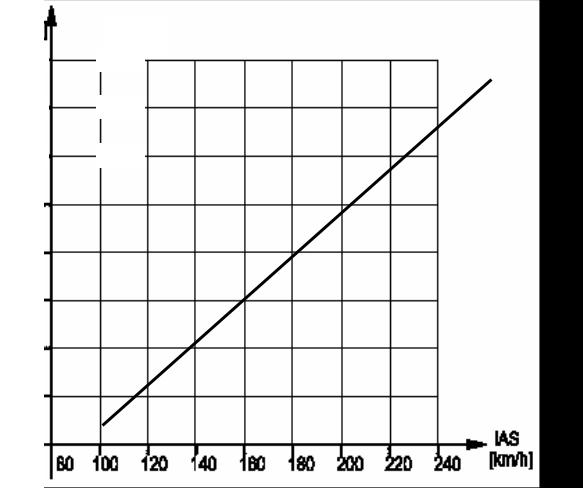
5.2.1. Calibration of the airspeed indicator system
The diagram is based on test flight data.
CAS = IAS + δV
δV – aerodynamic correction
CLIMB, LEVEL FLIGHT, DESCENT
WING FLAPS: retracted, for take-off and for landing
[kts] [mph]
130 149
118 137
108 124
97 |
|
112 |
|
|
|
|
|
|
|
|
|
|
|
|
|
|
|
|
|
|
|
|
|
|
|
|
|
|
|
|
|
|
|
|
|
|
|
|
|
|
|
|
|
|
|
86 |
|
99 |
|
|
|
|
|
|
|
|
|
|
|
|
|
|
|
|
|
|
|
|
|
|
|
|
|
|
|
|
|
|
|
|
|
|
|
|
|
|
|
|
|
|
|
76 |
|
87 |
|
|
|
|
|
|
|
|
|
|
|
|
|
|
|
|
|
|
|
|
|
|
|
|
|
|
|
|
|
|
|
|
|
|
|
|
|
|
|
|
|
|
|
65 |
|
75 |
|
|
|
|
|
|
|
|
|
|
|
|
|
|
|
|
|
|
|
|
54 |
|
62 |
|
|
|
|
|
|
|
|
|
|
|
|
|
|
|
|
|
|
|
[mph] |
|
|
|
|
|
|
|
|
|
|
|
|
|
|
|
|
|
|
|
|
|
|
|
43 |
|
50 |
|
62 |
|
|
75 |
|
87 |
|
99 |
|
112 |
|
124 |
|
137 |
|
149 |
|
||
|
|
|
|
|
|
|
|
|
|
|
|
|||||||||||
|
|
|
|
|
|
|
|
|
|
|
|
|
|
|
|
|
|
|
|
|
|
[kts] |
|
|
43 |
|
54 |
|
65 |
|
76 |
|
86 |
|
97 |
|
108 |
|
118 |
|
130 |
|
|||
|
|
|
|
|
|
|
|
|
|
|
|
|||||||||||
SEPTEMBER, 2004 |
Page 5-3 |
AEROPLANE FLIGHT MANUAL |
|

SECTION 5 |
“AERO” Sp. z o.o. |
PERFORMANCE |
AT-3 R100 |
5.2.2. Stalling speed
Aeroplane maximum weight |
|
|
582 [kg] |
|
|
|||||
Throttle |
|
|
|
|
|
idle |
|
|
||
|
|
|
|
|
|
|
|
|
|
|
wingofAngle displacementflap |
|
theofValue anglebanking |
|
km/h |
mph |
kts |
km/h |
mph |
kts |
|
|
|
|
|
|
|
Stalling speed |
|
|
||
|
|
|
|
|
|
|
|
|
|
|
|
|
|
|
|
IAS |
|
|
|
CAS |
|
|
|
|
|
|
|
|
|
|
|
|
|
|
|
|
|
|
|
|
|
|
|
0° |
|
|
VS1 |
86 |
53 |
46 |
93 |
|
58 |
50 |
|
|
0° |
|
|
|
|
|
|
|
|
15° |
|
VS1 |
81 |
50 |
44 |
90 |
|
56 |
49 |
|
|
|
|
|
|
|
|
|
|
|
|
40° |
|
|
VSO |
72 |
45 |
39 |
82 |
|
51 |
44 |
|
|
|
|
|
|
|
|
|
|
|
0° |
|
|
VS1 |
93 |
58 |
50 |
100 |
|
62 |
54 |
|
|
30° |
|
|
|
|
|
|
|
|
15° |
|
VS1 |
90 |
56 |
49 |
97 |
|
60 |
52 |
|
|
|
|
|
|
|
|
|
|
|
|
40° |
|
|
VSO |
79 |
49 |
43 |
88 |
|
55 |
47 |
|
|
|
|
|
|
|
|
|
|
|
0° |
|
|
VS1 |
129 |
80 |
70 |
131 |
|
81 |
71 |
|
|
60° |
|
|
|
|
|
|
|
|
15° |
|
VS1 |
124 |
77 |
67 |
127 |
|
79 |
69 |
|
|
|
|
|
|
|
|
|
|
|
|
40° |
|
|
VSO |
111 |
69 |
60 |
116 |
|
69 |
60 |
|
|
|
|
|
|
|
|
|
|
|
Page 5-4 |
SEPTEMBER, 2004 |
|
AEROPLANE FLIGHT MANUAL |
“AERO” Sp. z o.o. |
SECTION 5 |
AT-3 R100 |
PERFORMANCE |
5.2.3. Take-off performance |
|
Conditions: |
|
- Maximum weight |
582 kg |
- Airstrip surface |
concrete |
- Rating |
Takeoff power |
- Wing flap position (for takeoff) |
15 ° |
- Lift-off speed |
IAS = 77 km/h / 49 mph / 42 kts |
- Airspeed at H = 15 m |
IAS = 112 km/h / 70 mph / 60 kts |
NOTE
For each 10 km/h / 6 mph / 5 kts of head wind velocity the takeoff distance reduces by 8 % and increases by 25% for 10km/h / 6 mph / 5 kts tail wind velocity .
To receive intermediate values of the data given in the table,
interpolation is to be made between the increasing values.
TAKE-OFF RUN AND TAKE-OFF DISTANCES
Pressure altitude 0 [m] STD
Ambient |
temperature |
ºC |
-15 |
-5 |
+5 |
+15 |
+25 |
+35 |
|
OAT |
|
|
|
|
|
|
|
|
|
|
ºF |
5 |
23 |
41 |
59 |
77 |
99 |
||
|
|
|
|
|
|
|
|
|
|
Take-off run |
m |
188 |
195 |
203 |
210 |
225 |
240 |
||
|
|
|
|
|
|
|
|||
ft |
617 |
640 |
666 |
689 |
738 |
787 |
|||
|
|
||||||||
|
|
|
|
|
|
|
|
||
Take-off distance to |
m |
403 |
419 |
434 |
450 |
482 |
515 |
||
H=15m (50 ft) |
|
|
|
|
|
|
|
||
ft |
1322 |
1374 |
1424 |
1476 |
1581 |
1690 |
|||
|
|
|
|
|
|
|
|
|
|
|
Pressure altitude 500 [m] (1460 ft) |
STD |
|
|
|||||
|
|
|
|
|
|
|
|
|
|
Ambient |
temperature |
ºC |
-18 |
-8 |
+2 |
+12 |
+22 |
+32 |
|
OAT |
|
|
|
|
|
|
|
|
|
|
ºF |
-0.4 |
17.6 |
35.6 |
53.6 |
71.6 |
89.6 |
||
|
|
|
|
|
|
|
|
|
|
Take-off run |
m |
187 |
202 |
217 |
233 |
250 |
267 |
||
|
|
|
|
|
|
|
|||
ft |
614 |
663 |
712 |
764 |
820 |
876 |
|||
|
|
||||||||
|
|
|
|
|
|
|
|
||
Take-off distance to |
m |
400 |
432 |
466 |
500 |
536 |
573 |
||
H=15m (50 ft) |
|
|
|
|
|
|
|
||
ft |
1312 |
1417 |
1529 |
1640 |
1759 |
1880 |
|||
|
|
|
|
|
|
|
|
|
|
SEPTEMBER, 2004 |
Page 5-5 |
AEROPLANE FLIGHT MANUAL |
|

SECTION 5 |
|
|
|
|
|
|
|
|
“AERO” Sp. z o.o. |
|||
PERFORMANCE |
|
|
|
|
|
|
|
|
|
AT-3 R100 |
||
TAKE-OFF RUN AND TAKE-OFF DISTANCES (continuation) |
||||||||||||
|
|
|
|
|
|
|
|
|
|
|
|
|
|
|
Pressure altitude 1000 [m] (3281 ft) STD |
|
|
|
|||||||
|
|
|
|
|
|
|
|
|
|
|
|
|
|
Ambient |
temperature |
|
ºC |
|
-21 |
-11 |
-1 |
+9 |
+19 |
+29 |
|
|
OAT |
|
|
|
|
|
|
|
|
|
|
|
|
|
|
ºF |
|
-5.8 |
12.2 |
30.2 |
48.2 |
66.2 |
84.2 |
|
|
|
|
|
|
|
|
|
|
|
|
|
|
|
|
Take-off run |
|
m |
|
206 |
221 |
241 |
259 |
277 |
297 |
|
|
|
|
|
|
|
|
|
|
|
|
|
||
|
|
ft |
|
676 |
725 |
791 |
850 |
910 |
974 |
|
||
|
|
|
|
|
|
|||||||
|
|
|
|
|
|
|
|
|
|
|
|
|
|
Take-off distance to |
|
m |
|
442 |
474 |
526 |
554 |
594 |
636 |
|
|
|
H=15m (50 ft) |
|
|
|
|
|
|
|
|
|
|
|
|
|
ft |
|
1450 |
1555 |
1726 |
1818 |
1949 |
2087 |
|
||
|
|
|
|
|
|
|
|
|
|
|
|
|
|
|
Pressure altitude 1500 [m] (4921 ft) STD |
|
|
|
|||||||
|
|
|
|
|
|
|
|
|
|
|
|
|
|
Ambient |
temperature |
|
ºC |
|
-25 |
-15 |
-5 |
+5 |
+15 |
+25 |
|
|
OAT |
|
|
|
|
|
|
|
|
|
|
|
|
|
|
ºF |
|
-13 |
5 |
23 |
41 |
59 |
77 |
|
|
|
|
|
|
|
|
|
|
|
|
|
|
|
|
Take-off run |
|
m |
|
229 |
248 |
267 |
288 |
309 |
331 |
|
|
|
|
|
|
|
|
|
|
|
|
|
||
|
|
ft |
|
751 |
814 |
876 |
945 |
1014 |
1086 |
|
||
|
|
|
|
|
|
|||||||
|
|
|
|
|
|
|
|
|
|
|
|
|
|
Take-off distance to |
|
m |
|
491 |
537 |
573 |
617 |
662 |
708 |
|
|
|
H=15m (50 ft) |
|
|
|
|
|
|
|
|
|
|
|
|
|
ft |
|
1611 |
1762 |
1880 |
2024 |
2172 |
2323 |
|
||
|
|
|
|
|
|
|
|
|
|
|
|
|
|
|
Pressure altitude 2000 [m] (6562 ft) STD |
|
|
|
|||||||
|
|
|
|
|
|
|
|
|
|
|
|
|
|
Ambient |
temperature |
|
ºC |
|
-28 |
-18 |
-8 |
+2 |
+12 |
+22 |
|
|
OAT |
|
|
|
|
|
|
|
|
|
|
|
|
|
|
ºF |
|
-18.4 |
-0.4 |
17.6 |
35.6 |
53.6 |
71.6 |
|
|
|
|
|
|
|
|
|
|
|
|
|
|
|
|
Take-off run |
|
m |
|
254 |
276 |
298 |
321 |
344 |
412 |
|
|
|
|
|
|
|
|
|
|
|
|
|
||
|
|
ft |
|
833 |
906 |
978 |
1053 |
1129 |
1352 |
|
||
|
|
|
|
|
|
|||||||
|
|
|
|
|
|
|
|
|
|
|
|
|
|
Take-off distance to |
|
m |
|
545 |
591 |
638 |
687 |
738 |
884 |
|
|
|
H=15m (50 ft) |
|
|
|
|
|
|
|
|
|
|
|
|
|
ft |
|
1788 |
1939 |
2093 |
2254 |
2421 |
2900 |
|
||
|
|
|
|
|
|
|
|
|
|
|
|
|
5.2.4. Landing distance |
|
|
|
|
|
|
|
|
|
|
||
Conditions: |
|
|
|
|
|
|
|
|
|
|
|
|
- Maximum weight |
|
|
|
|
|
|
582 kg (1283 lb) |
|||||
- Airstrip surface |
|
|
|
|
|
|
concrete |
|
|
|||
- Rating |
|
|
|
|
|
|
idle |
|
|
|
||
- Wing flap position (for landing) |
|
|
40° |
|
|
|
||||||
- Braking |
|
|
|
|
|
|
maximum |
|
|
|||
- Approach speed at H=15 m/50’ |
IAS = 100 km/h / 62 mph / 54 kts |
|||||||||||
NOTE
For each 10 km/h / 6 mph / 5 kts of head wind velocity the landing distance reduces by 8 % and increases by 24 % for each 10 km/h / 6 mph / 5 kts of the tail wind velocity.
Page 5-6 |
SEPTEMBER, 2004 |
|
AEROPLANE FLIGHT MANUAL |
“AERO” Sp. z o.o. |
|
|
|
|
|
|
|
|
SECTION 5 |
|||
AT-3 R100 |
|
|
|
|
|
|
|
PERFORMANCE |
||||
|
LANDING DISTANCES |
|
|
|
|
|
||||||
|
|
|
|
|
|
|
|
|
|
|
|
|
|
|
Pressure altitude 0 [m] STD |
|
|
|
|
|
|||||
|
Ambient temperature. |
|
|
ºC |
-15 |
-5 |
+5 |
+15 |
+25 |
|
+35 |
|
|
|
|
|
|
|
|
|
|
|
|
|
|
|
OAT |
|
|
|
|
|
|
|
|
|
|
|
|
|
|
ºF |
5 |
23 |
41 |
59 |
77 |
|
99 |
|
|
|
|
|
|
|
|
|||||||
|
|
|
|
|
|
|
|
|
|
|
|
|
|
Landing distance from 15m |
|
|
m |
403 |
419 |
434 |
450 |
466 |
|
481 |
|
|
|
|
|
|
|
|
|
|
|
|
|
|
|
(50 ft) |
|
|
|
|
|
|
|
|
|
|
|
|
|
|
ft |
1322 |
1375 |
1424 |
1476 |
1529 |
|
1578 |
|
|
|
|
|
|
|
|
|||||||
|
|
|
|
|
|
|
|
|
|
|
|
|
|
Landing run |
|
|
m |
179 |
186 |
193 |
200 |
207 |
|
214 |
|
|
|
|
|
|
|
|
|
|
|
|
|
|
|
|
|
|
ft |
587 |
610 |
633 |
656 |
679 |
|
702 |
|
|
|
|
|
|
|
|
|
|
|
|
|
|
|
Pressure altitude 500 m (1460 ft) STD |
|
|
|
|
|||||||
|
Ambient temperature |
|
|
ºC |
-18 |
-8 |
+2 |
+12 |
+22 |
|
+32 |
|
|
|
|
|
|
|
|
|
|
|
|
|
|
|
OAT |
|
|
|
|
|
|
|
|
|
|
|
|
|
|
ºF |
-0.4 |
17.6 |
35.6 |
53.6 |
71.6 |
|
89.6 |
|
|
|
|
|
|
|
|
|||||||
|
|
|
|
|
|
|
|
|
|
|
|
|
|
Landing distance from 15m |
|
|
m |
423 |
439 |
456 |
472 |
489 |
|
505 |
|
|
|
|
|
|
|
|
|
|
|
|
|
|
|
(50 ft) |
|
|
|
|
|
|
|
|
|
|
|
|
|
|
ft |
1388 |
1440 |
1496 |
1549 |
1604 |
|
1657 |
|
|
|
|
|
|
|
|
|||||||
|
|
|
|
|
|
|
|
|
|
|
|
|
|
Landing run |
|
|
m |
188 |
195 |
203 |
210 |
217 |
|
224 |
|
|
|
|
|
|
|
|
|
|
|
|
|
|
|
|
|
|
ft |
617 |
640 |
666 |
689 |
712 |
|
735 |
|
|
|
|
|
|
|
|
|
|
|
|
||
|
Pressure altitude 1000 m (3281 ft) STD |
|
|
|
|
|||||||
|
|
|
|
|
|
|
|
|
|
|
|
|
|
Ambient temperature |
|
|
ºC |
-21 |
-11 |
-1 |
+9 |
+19 |
|
+29 |
|
|
|
|
|
|
|
|
|
|
|
|
|
|
|
OAT |
|
|
|
|
|
|
|
|
|
|
|
|
|
|
ºF |
-5.8 |
12.2 |
30.2 |
48.2 |
66.2 |
|
84.2 |
|
|
|
|
|
|
|
|
|||||||
|
|
|
|
|
|
|
|
|
|
|
|
|
|
Landing distance from 15m |
|
|
m |
444 |
461 |
479 |
496 |
513 |
|
530 |
|
|
|
|
|
|
|
|
|
|
|
|
|
|
|
(50 ft) |
|
|
|
|
|
|
|
|
|
|
|
|
|
|
ft |
1457 |
1512 |
1572 |
1627 |
1683 |
|
1739 |
|
|
|
|
|
|
|
|
|||||||
|
|
|
|
|
|
|
|
|
|
|
|
|
|
Landing run |
|
|
m |
197 |
205 |
213 |
220 |
228 |
|
236 |
|
|
|
|
|
|
|
|
|
|
|
|
|
|
|
|
|
|
ft |
646 |
673 |
699 |
722 |
748 |
|
774 |
|
|
|
|
|
|
|
|
|
|
|
|
||
|
Pressure altitude 1500 m (4921 ft) STD |
|
|
|
|
|||||||
|
Ambient temperature |
|
|
ºC |
-25 |
-15 |
-5 |
+5 |
+15 |
|
+25 |
|
|
|
|
|
|
|
|
|
|
|
|
|
|
|
OAT |
|
|
|
|
|
|
|
|
|
|
|
|
|
|
ºF |
-13 |
5 |
23 |
41 |
59 |
|
77 |
|
|
|
|
|
|
|
|
|||||||
|
|
|
|
|
|
|
|
|
|
|
|
|
|
Landing distance from 15m |
|
|
m |
467 |
485 |
503 |
521 |
539 |
|
557 |
|
|
|
|
|
|
|
|
|
|
|
|
|
|
|
(50 ft) |
|
|
|
|
|
|
|
|
|
|
|
|
|
|
ft |
1532 |
1591 |
1650 |
1709 |
1768 |
|
1827 |
|
|
|
|
|
|
|
|
|||||||
|
|
|
|
|
|
|
|
|
|
|
|
|
|
Landing run |
|
|
m |
207 |
215 |
224 |
232 |
240 |
|
248 |
|
|
|
|
|
|
|
|
|
|
|
|
|
|
|
|
|
|
ft |
679 |
705 |
735 |
761 |
787 |
|
814 |
|
|
|
|
|
|
|
|
|
|
|
|
||
|
Pressure altitude 2000 m (6562 ft) STD |
|
|
|
|
|||||||
|
Ambient temperature |
|
|
ºC |
-28 |
-18 |
-8 |
+2 |
+12 |
|
+22 |
|
|
|
|
|
|
|
|
|
|
|
|
|
|
|
OAT |
|
|
|
|
|
|
|
|
|
|
|
|
|
|
ºF |
-18.4 |
-0.4 |
17.6 |
35.6 |
53.6 |
|
71.6 |
|
|
|
|
|
|
|
|
|||||||
|
|
|
|
|
|
|
|
|
|
|
|
|
|
Landing distance from 15m |
|
|
m |
491 |
510 |
529 |
548 |
567 |
|
586 |
|
|
|
|
|
|
|
|
|
|
|
|
|
|
|
(50 ft) |
|
|
|
|
|
|
|
|
|
|
|
|
|
|
ft |
1611 |
1673 |
1736 |
1798 |
1860 |
|
1923 |
|
|
|
|
|
|
|
|
|||||||
|
|
|
|
|
|
|
|
|
|
|
|
|
|
Landing run |
|
|
m |
218 |
227 |
235 |
243 |
252 |
|
260 |
|
|
|
|
|
|
|
|
|
|
|
|
|
|
|
|
|
|
ft |
715 |
745 |
771 |
797 |
827 |
|
853 |
|
|
|
|
|
|
|
|
|
|
|
|
|
|
SEPTEMBER, 2004 |
Page 5-7 |
AEROPLANE FLIGHT MANUAL |
|
SECTION 5 |
“AERO” Sp. z o.o. |
PERFORMANCE |
AT-3 R100 |
5.2.5. Climb performance |
|
Wing flaps retracted (0º) |
|
Conditions: |
|
- Maximum weight |
582 kg (1283 lb) |
- Rating (Power setting) |
(full) nominal power |
- Airspeed VY |
=120 km/h / 75 mph / 65 kts IAS |
This airspeed is to be reduced by 3 km/h for each 1000 m of altitude (0.57 mph / 0.5 kts for each 1000 ft of altitude).
Wing flaps for takeoff (15º) |
|
Conditions: |
|
- Maximum weight |
582 kg (1283 lb) |
- Rating |
nominal power |
- Airspeed VY |
=110 km/h / 68 mph / 59 kts IAS |
This airspeed is to be reduced by 3 km/h for each 1000 m of the altitude (0.57 mph / 0.5 kts for each 1000 ft of the altitude).
Page 5-8 |
SEPTEMBER, 2004 |
|
AEROPLANE FLIGHT MANUAL |