Добавил:
Опубликованный материал нарушает ваши авторские права? Сообщите нам.
Вуз: Предмет: Файл:
лукойл инвестиции.pdf
Скачиваний:
7
Добавлен:
31.08.2019
Размер:
23.46 Mб
Скачать

vk.com/id446425943

Lukoil

Russia

Energy: Integrated Oil & Gas


Disclosures

Production and Distribution of VTB Capital Research Reports outside the United States

The information and opinions contained within VTB Capital research reports are prepared by research analysts associated with JSC VTB Capital, VTB Capital PLC and their non-U.S. affiliates (each such entity, a “VTB Group entity,” and all such entities collectively, the “VTB Group”), as indicated on the front page of this VTB Capital research report. Research reports produced by VTB Group entities are distributed under the VTB Capital logo (each such research report, a “VTB Capital research report”). This VTB Capital research report is distributed outside the United States by VTB Group entities.

Distribution of VTB Capital Research Reports to Investors within the United States

This VTB Capital research report is distributed to investors located within the United States by Xtellus Capital Partners Inc. (“Xtellus”), a broker-dealer registered with the U.S. Securities and Exchange Commission (the “SEC”) and a member of the Financial Industry Regulatory Authority (“FINRA”). Xtellus had no involvement in the preparation of this VTB Capital research report, and is distributing this VTB Capital research report to investors located within the United States as a “third-party research report” as defined in Rule 2241(a)(14). Xtellus has accepted responsibility for the content of this VTB Capital research report to the extent required by SEC guidance under Rule 15a-6.6 under the U.S. Securities Exchange Act of 1934 (the “Exchange Act”). Transactions in securities discussed in this VTB Capital research report must be effected by VTB Group entities with U.S. investors through Xtellus in accordance with Rule 15a-6. If you are an investor located within the United States, you should contact Xtellus if you wish to communicate with the VTB Capital research analysts who wrote this report, or you wish to conduct any transactions in securities described in this report.

Relationship between VTB and Xtellus

Xtellus is the successor entity of VTB Capital Inc, which was an SEC-registered broker dealer and affiliate of the VTB Group. The VTB Group sold its interest in VTB Capital Inc. with effect from August 31st 2018 to a newly formed holding company, Khepri Capital, LLC, an entity established and owned by certain VTB Capital Inc. personnel. In connection with the sale, VTB Capital Inc. was re-named Xtellus. While the VTB Group no longer has any ownership interest in Xtellus, Xtellus continues to provide certain services to VTB Group entities. Specifically, Xtellus (i) acts as agent for VTB Group entities pursuant to Rule 15a-6 under the Exchange Act in connection with securities transactions effected by VTB Group entities with U.S. investors, and (ii) is the exclusive distributor of VTB Capital research reports into the United States. Xtellus receives fees for research and Rule 15a-6 intermediation services it provides to VTB Capital Group entities, including fees for the right to distribute Xtellus research reports outside the United States. While the VTB Group no longer has any ownership interest in Xtellus, in light of the research and Rule 15a-6 service arrangements between the VTB Group and Xtellus, this VTB Capital research report includes disclosures pursuant to FINRA Rule 2241(h)(4) and FINRA Rule 2242(g)(3) applicable to VTB Group entities as if such VTB Group entities were affiliates of Xtellus. The inclusion of these affiliate disclosures should not be construed as implying that any VTB Group entity is affiliated with Xtellus for any other purpose.

Conflict of Interest Disclosures.

VTB Group entities do and seek to do business with companies covered in their research reports. Thus, investors should be aware that the VTB Group may have a conflict of interest that could affect the objectivity of this research report. Investors should consider this research report as only a single factor in making their investment decision. Where an issuer referred to in this report is not included in the disclosure table, the issuer is either considered not to be covered by VTB Capital Research, or the reference is considered to be incidental and therefore the issuer is not a subject company within this report.

Certain disclosures on the companies covered by this VTB Capital research report are set forth below. Additional disclosures on the companies covered by this report can be obtained by accessing the following webpages:

Research disclosures webpage - http://research.vtbcapital.com/ServicePages/Disclosures.aspx.

Investment Recommendations disclosures webpage https://www.vtbcapital.com/about/information-disclosure/investment- recommendations/

Additional disclosures on the companies covered by this report can be obtained by writing to the offices listed on the back page. In order to receive i) a summary of any basis of the valuation or methodology and the underlying assumptions used to either evaluate a financial instrument or an issuer, or to set a price target for a financial instrument, as well as an indication and a summary of any changes in the valuation, methodology or underlying assumptions; ii) detailed information about the valuation or methodology and the underlying assumptions in any non-proprietary models; or iii) material information about the proprietary models used; please consult the VTB Capital Research web-site at https://research.vtbcapital.com or contact the authors of this document.

15 March 2019

20

vk.com/id446425943

Lukoil


Russia


Energy: Integrated Oil & Gas


Issuer Specific Disclosures


Disclosure checklist


Company

Ticker

Recent price

Disclosure


Lukoil

LKOH RX

5,677 (RUB)

4a, 12a

4a. VTB Capital or an affiliated company is a provider of liquidity and/or a market maker in the securities of the relevant issuer at the time this research report was published. VTB Capital or an affiliated company will buy and sell securities of the relevant issuer on a principal basis.

12a. VTB Capital or an affiliated company has a long shareholding position exceeding 0.5% of the total issued share capital in the relevant issuer.

Analysts Certification

The research analyst(s) whose name(s) appear on this VTB Capital research report certify pursuant to SEC Regulation AC that: i) all of the views expressed in this research report accurately reflect their personal views about the subject security or issuer, and ii) no part of the research analysts’ compensation was, is, or will be directly or indirectly related to the specific recommendations or views expressed by the research analysts in this VTB Capital research report.

The research analysts whose names appear on VTB Capital research reports received compensation that is based upon various factors including VTB Capital Group’s total revenues, a portion of which are generated by VTB Capital Group’s investment banking activities.

Investment Ratings

VTB Capital uses a three-tiered Investment Rating system for stocks under coverage: Buy, Hold, or Sell.

The three main ratings correspond to the next 12-month Expected Total Return (ETR), defined as the difference between the Target Price and the Last Price as indicated by Bloomberg divided by that Last Price plus the expected Dividend Yield over the next 12 months. Under this Investment Ratings system, Buy, Hold, and Sell have the following meanings: (as of the publishing date):

BUY: ETR exceeds plus 20% or more HOLD: ETR is between zero and plus 20% SELL: ETR is less than zero

VTB Capital Research confirms that published Buy, Hold or Sell ratings conform to these definitions at the time a Target Price is established or an Investment Rating is revised. Between such revisions, day-to-day movements in the prices of financial instruments could result in a temporary discrepancy between the Investment Rating and the aforementioned definition. Analysts address such discrepancies based on their scale and duration.

UNDER REVIEW: In the event that significant information about an issuer is due to be announced or is expected to become public in the foreseeable future, or the analyst needs time to evaluate such information, which was announced recently, s/he might choose to place that issuer Under Review. This means that the analyst is suspending the previously published financial forecasts, Target Price and investment rating in order to review them while waiting for the impending information. As such, they are no longer valid and should not be relied upon.

RESTRICTED: In certain circumstances, VTB Capital is not able to communicate issuer ratings due to internal policy and/or law and regulations. In this case, any revision of the financial forecasts, Target Prices and Investment Ratings will be carried out only after the Restricted status is removed.

Notwithstanding the above, VTB Capital may from time to time issue investment recommendations predicated on a different time horizon (such as short-term trading recommendations) to that which is described above. Where VTB Capital issues such an investment recommendation, the use of an alternative time horizon for the purpose of formulating such investment recommendation might result in differences between such investment recommendation and any investment rating published in accordance with the Investment Rating system described above. In addition, short-term trading recommendations may result in short-term price movements contrary to the recommendations in this research report.

15 March 2019

21

vk.com/id446425943

Lukoil

Russia

Energy: Integrated Oil & Gas


The below table details the distribution of VTB Capital’s Investment Ratings on the basis of the three-tier recommendation system described above.

VTB Capital Ratings Distribution

Investment Ratings Distribution

Buy

58

49%

Hold

37

31%

Sell

16

13%

Restricted

0

0%

Not Rated

0

0%

Under Review

8

7%


119


Source: VTB Capital Research as at 28 February 2019

Ratings Distribution for Investment Banking Relationships

Buy

8

47%

Hold

3

18%

Sell

2

12%

Restricted

0

0%

Not Rated

0

0%

Under Review

4

23%


17


The VTB Capital Ratings Distribution tables above account for the recommendations on all instruments covered, rather than the number of companies covered. In instances where we provide a recommendation for more than one instrument issued by a company, these are counted separately. A list of those companies for which we cover more than one instrument can be found at DoubleRecPLC20190228.pdf.

12-month Target Prices

VTB Capital research analysts employ a variety of methods for estimating the fair value of financial instruments covered by them. These may include, but are not limited to, a Discount Cash Flow (DCF) model, a Dividend Discount Model (DDM), Net Asset Value (NAV) valuation, financial or asset-based multiples of analogous companies and a sum-of-the-parts (SOTP) valuation. The research analyst’s choice of methods used in each particular instance is based on the specifics of the investment case in question. The Target Price reflects the research analyst’s informed opinion on the price which is likely to be attained by the financial instrument in 12 months, subsequent to the date of the Target Price determination. The Target Price is underpinned by the aforementioned fair value estimates, and will belong to the range established by them.

Conflicts Management Arrangements

VTB Capital Research has been published in accordance with our conflict management arrangements, which are available at http://research.vtbcapital.com/ServicePages/Files/CoI+Arrangements+Research.pdf.

15 March 2019

22

vk.com/id446425943

VTB Capital Research


Moscow Research

London Research


Phone: +7 495 660 4253

Phone: +44 (0) 20 3334 8557


research@vtbcapital.com

research@vtbcapital.com

VTB Capital Offices


JSC VTB Capital

VTB Capital plc

VTB Capital plc


Federation Tower West

14 Cornhill

9 Battery Road #27-01


12, Presnenskaya emb.

London EC3V 3ND

Straits Trading Building


Moscow, 123100, Russia

Phone: +44 (0) 20 3334 8000

Singapore 049910


Phone: +7 495 960 9999

Fax: +44 (0) 20 3334 8900

Phone: +65 6220 9422


www.vtbcapital.com

www.vtbcapital.com

Fax: +65 6225 0140


www.vtbcapital.com


VTB Capital Hong Kong Limited


Unit 2301, 23/F


Cheung Kong Center


2 Queen’s Road Central


Hong Kong


Phone: +852 3195 3688


Fax: +852 3195 3699


www.vtbcapital.com


Xtellus Capital Partners Inc. (Sales and Research queries for US clients)

Xtellus Capital Partners Inc. Sales

452 Fifth Avenue, 23rd Floor

New York, NY 10018

Phone: +1646 527 6400

Sales@XtellusCapital.com

VTB Group entities do and seek to do business with companies covered in their research reports. Thus, investors should be aware that the VTB Group may have a conflict of interest that could affect the objectivity of this research report. Investors should consider this research report as only a single factor in making their investment decision.

This research report is for information purposes only and does not constitute nor is it intended as an offer or solicitation for the purchase or sale of securities or other financial instruments. Neither the information contained in this research report nor any future information made available with the subject matter contained herein will form the basis of any contract. Information and opinions contained herein have been compiled or arrived at by VTB Group from publicly available information and sources that VTB Group believes to be reliable. Whilst every care has been taken in preparing this research report, no research analyst, director, officer, employee, agent or adviser of any member of the VTB Group gives or makes any representation, warranty or undertaking, whether express or implied, and accepts no responsibility or liability as to the reliability, accuracy or completeness of the information set out in this research report. Any responsibility or liability for any information contained herein is expressly disclaimed. All information contained herein is subject to change at any time without notice. No member of the VTB Group has an obligation to update, modify or amend this research report or to otherwise notify a reader thereof in the event that any matter stated herein, or any opinion, projection, forecast or estimate set forth herein, changes or subsequently becomes inaccurate, or if research on the subject company is withdrawn. Furthermore, past performance is not indicative of future results.

The investments and strategies discussed herein may not be suitable for all investors or any particular class of investor. Investors should make their own investment decisions using their own independent advisors as they believe necessary and based upon their specific financial situations and investment objectives when investing. Investors should consult their independent advisors if they have any doubts as to the applicability to their business or investment objectives of the information and the strategies discussed herein. This research report is being furnished to certain persons as permitted by applicable law, and accordingly may not be reproduced or circulated to any other person without the prior written consent of a member of the VTB Group. This research report may not be relied upon by any retail customers or persons to whom this research report may not be provided by law. Unauthorised use or disclosure of this research report is strictly prohibited. Members of the VTB Group and/or their respective principals, directors, officers and employees (including, but not limited to, persons involved with the preparation or issuance of this research report) may own, have positions or effect transactions in the securities or financial instruments referred to herein or in the investments of any issuers discussed herein, may engage in securities transactions in a manner inconsistent with the research contained in this research report and with respect to securities or financial instruments covered by this research report, may sell to or buy from customers on a principal basis and may serve or act as director, placement agent, advisor or lender, or make a market in, or may have been a manager or a co-manager of the most recent public offering in respect of any investments or issuers of such securities or financial instruments referenced in this research report or may perform any other investment banking or other services for, or solicit investment banking or other business from, any company mentioned in this research report. Disclosures of conflicts of interest, if any, are found at the end of the text of this research report. Members of the VTB Group may have acted upon or used the information or conclusions contained in this research report, or the research or analysis on which they are based, before publication of this research report. Investing in the Russian Federation, its markets and in Russian securities and financial instruments involves a high degree of risk, and many persons, physical and legal, may be restricted from dealing in the securities markets of the Russian Federation. Investors should perform their own due diligence before investing. It is particularly important to note that securities and financial instruments denominated in foreign currencies and ADRs and other investments discussed herein are subject to exchange rate fluctuations that may adversely affect the value of the investment. The value of investments may fall as well as rise and investors may not get back the amount invested. Prices and availability of securities, financial instruments or investments are also subject to change without notice. The views and opinions expressed in this research report accurately reflect the personal views of the authors of this research report about the subject investments, securities and financial instruments and issuers and do not necessarily reflect the views of any member of the VTB Group. No part of the compensation of the authors of this research report was, is or will be directly or indirectly related to the specific recommendations or views contained in the research report. By accepting this research report, you agree to be bound by the foregoing limitations. This material is not intended for the use of private investors.

In Russia, this report is approved and/or communicated by JSC VTB Capital, a professional securities market participant regulated by the Central Bank of Russia.

In the United Kingdom this report is approved and/or communicated by VTB Capital plc London, a member of the London Stock Exchange and authorized by the Prudential Regulation Authority and regulated by the Financial Conduct Authority and the Prudential Regulation Authority. This report is intended for those persons that would be classified as Eligible Counterparties or Professional Clients under the Financial Conduct Authority’s Conduct of Business rules.”

This research report is distributed in Singapore by VTB Capital plc to accredited investors, expert investors or institutional investors only (as defined in the applicable Singapore laws and regulations and is not intended to be distributed directly or indirectly to any other class of person). Recipients of this report in Singapore are to contact VTB Capital plc, Singapore branch in respect of any matters arising from, or in connection with, this report. VTB Capital plc, Singapore branch is regulated by the Monetary Authority of Singapore.

This research report is distributed in Hong Kong by VTB Capital Hong Kong Limited, a licensed corporation (CE Ref: AXF967) licensed by the Hong Kong Securities and Futures Commission to “professional investors” (as defined in the Hong Kong Securities and Futures Ordinance and its subsidiary legislation) only.

For important disclosures and equity rating histories regarding companies that are the subject of this report, please see the VTB Capital Research Website: http://research.vtbcapital.com/ServicePages/Disclosures.aspx, or contact your research representative.

Copyright © 2019 by VTB Capital. All rights reserved. Please cite source when quoting.

vk.com/id446425943Capital Market Outlook

Chief Investment Office

The opinions are those of the author(s) and subject to change.

MARCH 11, 2019

IN THIS ISSUE

MACRO STRATEGY

Early signs that the global slowdown currently ending are propelling equity markets higher. Expectations for a slowdown in capital spending (capex) seem misplaced given the new U.S. tax structure and the developing shortage of available workers. Higher U.S. productivity was the big surprise in 2018. Fundamentals suggest it should continue to move higher this year, helping to contain inflation and prolong the expansion.

GLOBAL MARKET VIEW

Student loan debt in the U.S. has more than doubled in the past ten years to reach $1.5 trillion, driven by rapidly growing tuition costs, higher enrollment and the 2008 financial crisis. In a six-question Q&A, we outline some of the critical concepts on student loan debt and its economic impact.

THOUGHT OF THE WEEK

Beijing recently announced its 2019 defense budget with spending set to grow by 7.5% to 1.19 trillion yuan ($178 billion). The data on defense spending comes as China’s National Party Congress reduced its economic growth target for 2019 to a range of 6% to 6.5%. The government is in “whatever-it-takes” mode, supporting the global reflationary trade in global equities this year.

PORTFOLIO CONSIDERATIONS

Given our expectation of elevated volatility, we suggest higher-quality exposure, largeover small-caps, companies with pricing power, cash on their balance sheets, the ability to grow dividends, and less leverage.

MACRO STRATEGY

A MIRROR IMAGE

Chief Investment Office Macro Strategy Team

2019 is shaping up to be a mirror image of 2018, which began with widespread euphoria about a continuing synchronized global expansion. By the spring, however, aggressive Federal Reserve (Fed) rate-hike plans and trade-war concerns had sparked a global slowdown. In sharp contrast, this year has begun with widespread expectations of continued global slowing. Instead, with the Fed and trade concerns now becoming tailwinds, in our view, the global economy is on the cusp of a new upcycle, which should become apparent, likely by the second half.

Early signs of the turnaround are apparent in long-lead-time leading indicators, like stock prices, credit spreads, interest rates and general financial conditions. The U.S. was least impacted by the trade and rate-hike headwinds in 2018, although by the end of the year it also began to show signs of fatigue. China, on the other hand, got hit hardest, as was evident in its much more severe bear market in equities. Once the U.S. began to slow, the Fed stepped back to give growth

Data as of 03/11/2019 and subject to change.

a chance. Signs of the impending return to synchronized global growth in 2019 have been flashing from the relative outperformance and earlier bottoming process in emergingmarket (EM) currencies and equities, especially the Chinese yuan and equities since late last year.

As we wrote last spring, the early victims of the Fed rate hikes were those EMs, like Turkey and Argentina, that had leveraged up during the zero-rate era of plentiful dollar liquidity. Developed economies outside the U.S were also more impacted, not least because they were more vulnerable to China’s disproportionate weakening, especially Germany, which has the biggest structural trade surplus in the world and is overly reliant therefore on global trade.

The lack of a coordinated pro-growth policy response and political limbo add to European woes. As George Soros—Hungarian- American investor and philanthropist—put it recently, “Europe

is sleepwalking into oblivion…” While lagging behind the Fed’s normalization path, the European Central Bank (ECB) still managed to hurt domestic growth by prematurely beginning its ill-timed quantitative tightening program even as inflation falls far short of

Merrill Lynch Wealth Management makes available products and services offered by Merrill Lynch, Pierce, Fenner & Smith Incorporated (MLPF&S), a registered broker-dealer and Member SIPC, and other subsidiaries of Bank of America Corporation (BofA Corp.). Investment products:

Are Not FDIC Insured

Are Not Bank Guaranteed

May Lose Value


vk.com/id446425943

MACRO STRATEGY (Continued)

its target. A stubborn refusal to acknowledge this has widened the gap between a now chastened, pro-growth Fed and a still dawdling ECB. Nevertheless, a turnaround in China and other EMs, together with a still strong U.S. economy, will help Europe muddle along as global trade reaccelerates in the wake of an expected U.S. China trade deal, low inflation, lower interest rates and widespread stimulus efforts as other countries follow the lead of the U.S. tax reform and deregulation policies to remain competitive.

WEAK U.S. GROWTH BLIP PASSING

Economic indicators in the U.S. have held up well despite the global slowdown. While sectors tied to global trade and

manufacturing have cooled a bit, they remain more robust than those elsewhere. For example, the February Institute for Supply Management (ISM) manufacturing index has fallen sharply to the lowest level in about two years. Still, according to the ISM, its 54.2 reading has been consistent with 3% gross domestic product (GDP) growth, and the nonmanufacturing sector, which constitutes about 80% of the U.S. economy, remains even stronger, with a big surprise jump in February. All told, the composite measure, which includes both the manufacturing and nonmanufacturing indices, remains at a level only seen near the peak of the past 25 years. Expectations for a return to “secular stagnation” would seem to be misplaced.

The key is the takeoff in capital spending that has surprised economic forecasters despite the clear historical record of tax reforms’ positive impact on corporate investment. The last two comparable reforms to corporate investment incentives were the 1964 and 1986 tax reforms. Both were followed by long periods of near double-digit growth in capex. Likewise, the biggest surprise in the stronger-than-expected U.S. fourth-quarter GDP growth rate that propelled the U.S. to its strongest year-over-year growth since 2005 was strength in capex. In particular, spending on research and development is currently growing at twice its pre-tax reform rate. In the modern information age and servicedominated economy, R&D is a critical component for advancing productivity, especially in a fully employed U.S. economy where finding workers is the biggest problem facing businesses.

According to research by Cornerstone Macro that looked at the S&P1500 companies, the percentage of firms showing positive year-over-year growth comparison in capex is in a strong uptrend since tax reform was passed following a steady downtrend from 2012, when the initial recovery out of the financial crisis ended. The research also notes a broadening out of capital spending to more sectors of the economy. While growth has moderated from its initial burst, it’s still double digit. A follow-up report shows effective tax-rate cuts averaged about nine percentage points.

Of particular interest, the new rules narrowed the gap between domestic and multinational firms with over a ten-point cut on average for the former and only about three points for the latter. As a result, domestic firms’ capex growth has accelerated sharply relative to multinational companies. This helps explain the strong relative growth outperformance in the U.S. over the past year.

Bottom line: A U.S. slowdown in 2019 is largely predicated on a fizzling out of capex. The 1964 and 1986 tax reforms and recent data suggest this is highly unlikely. Furthermore, housing, which got hit hard by higher interest rates last year, should do better this year since rates have reversed and household formation remains very strong. The current turnaround in homebuilder surveys and stocks supports this view, not a slowdown view. Finally, and perhaps most importantly, a robust labor market with strengthening real wages and incomes in a low-inflation environment is the key to another year of surprisingly strong U.S. growth, in our opinion. The new capex boom is fueling higher productivity and rising real incomes, as of December 2018, while containing inflation. It took the Fed a while to catch on to this positive dynamic and stop attacking wage increases.

REST OF THE WORLD FOLLOWS THE STRONG U.S. HIGHER

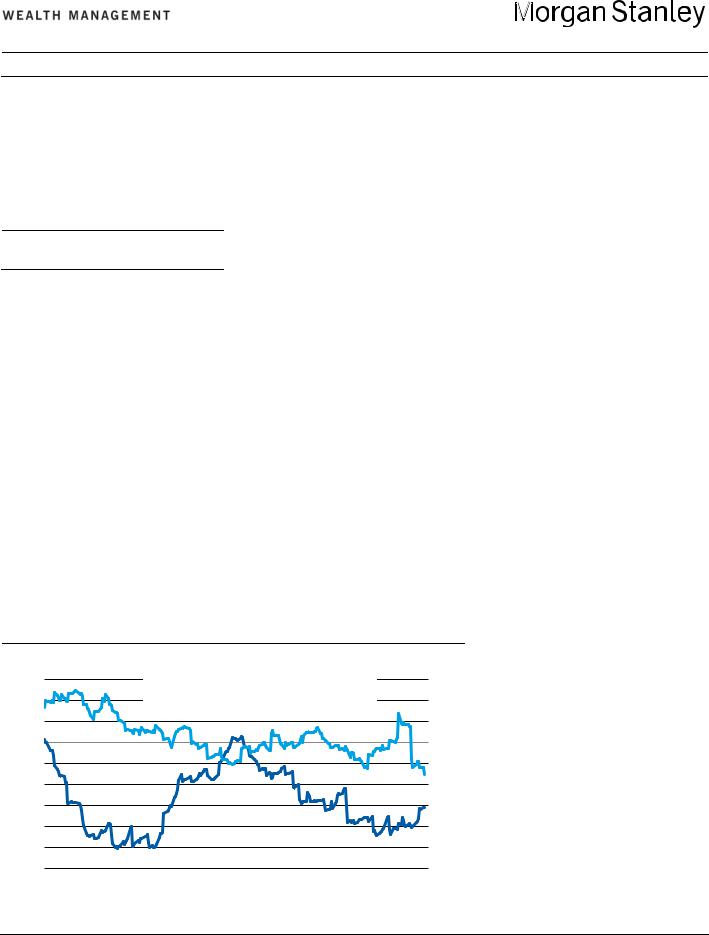
The turn in EM currencies and equity markets suggests global trade will resume a more normal growth pace after the sharp slowing of 2018. Exhibit 1 shows the historical pattern of leading indicators for a composite of economies that account for the bulk of global GDP.

Exhibit 1: Muted Mini Cycles Since the Financial Crisis.

OECD + Major 6 Non-Mem: Total Leading Indicator (2-month %change, annualized, Leading 6 months) OECD + Major 6 Non-Mem: Total Leading Indicator (SA, Amplitude Adjusted)

2-month % change, annualized


Index

8%


104

6%


103

4%


102

2%


101

0%


100

-2%


99

-4%


98

-6%


97

-8%


96


n


n


n


n


n


n


n


n


Jan


n


Ja


Ja


Ja


Ja


Ja


Ja


Ja

Ja


Ja


-


-


-


-


-


-


-


-


-


-


0


3


6


9


2


05


8


11


4

7


9


9


99


9


0


00


1


201


9


19


9


0


0


20


0


1


1


1


2


2


2


2


Sources: Organisation for Economic Co-operation and Development (OECD)/ Haver Analytics, Chief Investment Office. Data as of March 5, 2019.

What’s striking about the chart since 2009 is the muted yet clear pattern of three distinct minicycles, which have tracked globalgrowth momentum since the financial crisis. Unlike the global economy in the 1990s or 2000s, the amplitude of each minicycle is less than half of those of the previous global expansions.

As a result, while world growth has been trend-like, it has not

CIO Capital Market Outlook

2

vk.com/id446425943

MACRO STRATEGY (Continued)

overheated or weakened to the point of recession. The lack of overheating helps explain the relatively well-contained behavior of inflation. Long-leading indicators now suggest a fourth minicycle could likely begin this year. These cycles have each previously lasted about three years, with two years of rising momentum for growth and equity prices followed by about a year of weakening momentum and equity-market corrections.

GLOBAL MARKET VIEW

HOW MUCH OF A BURDEN: Q&A ON STUDENT LOAN DEBT

Kathryn A. Cassavell, CFA®, Vice President and Market Strategy Analyst

The U.S. student debt burden has been described to the American public in countless ways: a bubble about to burst, a systemic risk to the financial system, a threat to U.S. competitiveness, a source of income inequality, a looming burden for the U.S. government, the reason millennials are living in their parents’ basements. The list goes on.

Given the various viewpoints and investor inquiries on the topic, below is a brief Q&A addressing common client questions related to student loan debt.

WHAT IS THE CURRENT STATE OF U.S. STUDENT LOAN DEBT?

According to the latest figures from the Fed, U.S. student debt outstanding totaled $1.5 trillion in the fourth quarter of 2018. That’s more than the amount Americans owe on credit cards and auto loans, but a fraction of America’s total mortgage debt ($9.1 trillion).

Unlike the other consumer credit sectors mentioned above, student debt was largely unaffected by the household deleveraging trend that occurred after the financial crisis. Since 2008, total student loans outstanding grew 128% compared to 61% growth for auto loans, a decline of -1% for mortgages, and just 0.5% growth for credit card debt.

Student loan delinquency rates have also been a concern in recent years. The total amount of student loan balances that are 90+ days delinquent reached $166 billion last year, or 11.4% of the total balance. (The Fed estimates that the true figure could actually be double this stated amount). At

the start of the last financial crisis, the comparable figure for mortgage debt was $267 billion (Q4 2017), peaking at $785 billion in delinquent balances as of Q1 2010.

HOW DID WE GET HERE?

The rise of student loan debt can be traced back to the latter half of the 20th century, as various government initiatives

Chartered Financial Analyst® and CFA® are registered trademarks owned by CFA Institute.

These relatively restrained, self-correcting cycles help account for and support the longevity of this expansion, which is expected to set an all-time U.S. record in July. With the Fed moving to a more robust commitment to a 2% inflation rate, the odds of another two-year upcycle starting in 2019 look pretty good, in our opinion.

encouraged students to pursue higher education. With more Americans attending college, aggregate student debt levels rose. Brookings Institution estimates, “about one-quarter of the aggregate increase in student loans since 1989 is due to more students enrolling in college.”1

Meanwhile, the average cost of a college degree has risen exponentially. Over the past 40 years, the inflation-adjusted cost of tuition and fees per student climbed by almost 300%, while the average median income (adjusted for inflation) increased by just 18% (Exhibit 2).

Exhibit 2: U.S. College Tuition Outpaces Median Income Gains.

Inflation-adjusted average tuition and median income

Indexed to 100 (1978 = 100)

400

Average tuition and fees (public 4-year universities)

350

Median household income

300

250

200

150

100

50

0

1978

1982

1986

1990

1994

1998

2002

2006

2010

2014

2018

Tuition per student and income levels, adjusted for inflation, and indexed to 1978 price levels. Sources: The College Board, Census Bureau, Center on Budget and Policy Priorities. Data through 2017.

The 2008 recession also played an important role in the recent build-up of student loan debt. As the economy turned, states slashed their budgets, and more of the burden fell on students to fund their education. At the same time, university enrollment picked up, especially among older Americans looking to retrain for the job market after being laid off. This also fueled higher enrollments at for-profit universities, where average student debt levels and defaults tend to be higher.

ARE WE REACHING A TIPPING POINT FOR STUDENT DEBT?

Although leverage has been creeping higher, with delinquency rates for student loans much higher than those for other areas

1 Brookings Institution, “The Looming Student Loan Default Crisis is Worse than We Thought.” January 11, 2018.

CIO Capital Market Outlook

3

vk.com/id446425943

GLOBAL MARKET VIEW (Continued)

of consumer credit, we do not believe the student loan market is a bubble that is about to burst. Various signs point to an improving situation.

First, overall U.S. consumer balance sheets are currently strong. Total consumer debt as a percentage of GDP has come down from a peak of 87% in 2008 to just 65% today. Meanwhile, consumer debt service payments as a percentage of disposable personal income are at record lows. And although interest rates over the past year have shifted higher, we do not believe this is an immediate concern for borrowers since most student debt carries a fixed rate.

Second, delinquencies have been growing at a slower pace since 2014 (Exhibit 3). An overall healthier consumer backdrop combined with an increase in income-driven repayment plans should help keep delinquency and default rates in check.2

Exhibit 3: Student Loans Transitioning into Delinquency at a Slower Pace.

Transition into delinquency

Share of previously up-to-date loan balances becoming 30+ days delinquent

12%

11%

10%

9%

8%

7%

Q2-04 Q4-04 Q2-05 Q4-05 Q2-06 Q4-06 Q2-07 Q4-07 Q2-08 Q4-08 Q2-09 Q4-09 Q2-10 Q4-10 Q2-11 Q4-11 Q2-12 Q4-12 Q2-13 Q4-13 Q2-14 Q4-14 Q2-15 Q4-15 Q2-16 Q4-16 Q2-17 Q4-17 Q2-18 Q4-18

Sources: New York Fed Consumer Credit Panel/Equifax. Data as of Q4 2018.

Meanwhile college tuition increases appear to have slowed. Tuition and fees at four-year public colleges rose just 2.5% last year, roughly in line with core inflation and wage gains.3

ARE STUDENT LOANS A LOOMING SYSTEMIC RISK TO THE FINANCIAL SYSTEM?

Fears of an eventual system-wide financial shock caused by student loan debt are overblown, in our opinion.

Most student loans (roughly 90%) are held on the U.S. government balance sheet. So while a wave of student loan defaults would be a burden on the federal budget, we think student debt is less likely to cause a widespread shock to the financial markets.

The student loan system also has mechanisms in place that gradually shift the financial burden to borrowers, which should cause

2The New York Times, “How to Clean Up the Student Loan Mess.” April 6, 2018.

3Tuition measured by The College Board, “Trends in College Pricing 2018.” Comparatively, CPI core inflation was up 2.2% in December 2018 (year-over-year) and average hourly earnings were up 3.3% in December 2018 (year-over-year) according to the Bureau of Labor Statistics.

financial effects to filter through the economy over the course of multiple years. Thus, deteriorating conditions in the student loan market are expected to have a more gradual economic impact.

Another mitigating risk: robust U.S. employment growth and solid income gains, boosting the financial wherewithal, at least in the medium term, of those shouldering the burden of debt.

WHAT ARE THE ECONOMIC CONSEQUENCES OF RISING STUDENT DEBT?

There are mixed views on the overall economic impact of student loan debt. On the one hand, taking on student debt has important benefits for borrowers. Higher levels of educational attainment are generally correlated with lower rates of unemployment, higher wages and greater spending levels.

On the other hand, some research has shown that rising student loan debt has had a negative impact on specific sectors of the economy. For example, a recent study by the Fed finds that 20% of the decline in the homeownership rate for younger Americans since 2005 can be attributed to the rise in student loan debt—translating to roughly 400,000 fewer homeowners.4

Older adults are also starting to feel the burden, as they carry their student loans later in life and take on more debt to support their children and grandchildren. This is a trend we are following closely, since an increasing debt burden can have important implications for the spending patterns of the baby boomers as they enter retirement.

WHAT ARE THE INVESTMENT IMPLICATIONS?

While the aggregate economic effect from student loan debt may be relatively mild and spread out over several years, certain sectors can be negatively impacted in the near term.

As discussed, one such area is the housing market, where rising student debt has contributed to a delay in home purchases by young consumers. We acknowledge that there remains considerable pent-up demand in the housing market as millennials reach their prime home buying years; however, the growing burden of student loans could mean slower progress and/or less runway than previously anticipated.

Buying sentiment among young consumers has also weakened in the auto sector. The latest data from the University of Michigan show that buying conditions for motor vehicles have been deteriorating much more rapidly for younger consumers (Exhibit 4). This contrasts with prior business cycles when younger consumers used to have a more favorable outlook

on auto purchases than older consumers. According to the

4The Federal Reserve, “Can Student Loan Debt Explain Low Homeownership Rates for Young Adults?” January 2019.

CIO Capital Market Outlook

4

vk.com/id446425943

GLOBAL MARKET VIEW (Continued)

survey, “the less favorable views of the young were mirrored in their more frequent concerns about the incurrence of additional debt.”5

These are just two areas of the U.S. economy where a more cautious view is warranted. By contrast, discount retailers could be beneficiaries of more budget-conscious millennials and baby boomers. In terms of credit markets, we do not think that rising student loan balances and delinquencies will pose a challenge to the U.S. government budget just yet. However, we are watching the policy response to this growing concern and will reassess investment implications as the theme evolves.

Exhibit 4: Vehicle Buying Conditions Deteriorating Faster

Among Younger Adults.

Current conditions for buying vehicles


Index score


Ages 18-34


Ages 35-54


Ages 55+

170


160


150


140


130


120


110


100


90


80


70


1979

1981

1983

1985

1987

1989

1991

1993

1995

1997

1999

2001

2003

2005

2007

2009

2011

2013

2015

2017

2019

5 “Age Reversal in Buying Attitudes,” University of Michigan Surveys of Consumers.

12 month moving average. Sources: University of Michigan Surveys of Consumers; Haver

February 22, 2019.

Analytics. Data as of February 2019.

THOUGHT OF THE WEEK

EVIDENCE OF “WHATEVER-IT-TAKES” IN CHINA

Lauren J. Sanfilippo, Vice President and Market Strategy Analyst

China has long maintained a strong penchant for building things—whether high-speed railroads, world-class suspension bridges, mile-long tunnels, massive airports and, of course, high-rise buildings. To wit, China completed 88 buildings of at least 200 meters in height last year, which is a record number of completions for the nation, and a staggering 61.5% of the global total. In the U.S., comparatively, 13 completions were recorded. In terms of new supertall skyscrapers (300 meters or more), China completed 11 out of a global total of 18 for the year.6 While skyscrapers are a lagging economic indicator (given it takes years to plan, design and construct a building), we suspect the pace of building will remain relatively robust in the next few years as the government implements more reflationary measures to sustain growth in the 6% to 7% range. Infrastructure investment, a key element of the Chinese government’s economic stimulus plan, will not only include skyscrapers and high-speed railways but a 5G rollout and modernization of its military.

Beijing recently announced its 2019 defense budget that (1) fuels global concerns over China’s growing military prowess and

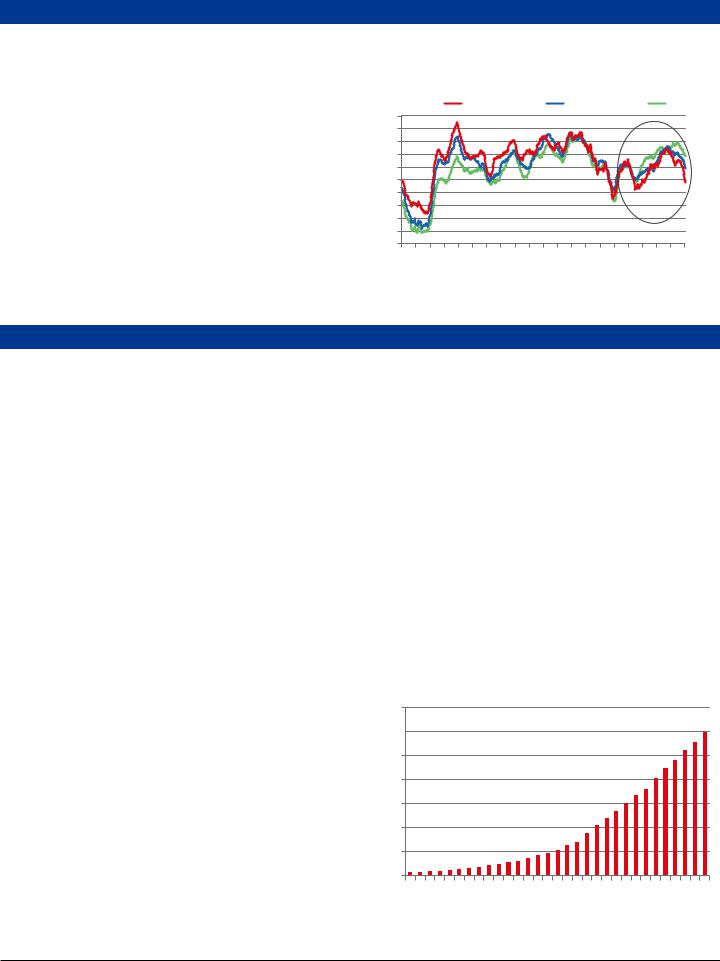
(2) continues the 25-year run of annual increases in defense spending. Overall spending is set to grow by 7.5% to 1.19 trillion yuan ($178 billion) (Exhibit 5), with the aim of modernizing the nation’s weapons capabilities, including more spending on aircraft carriers, stealth fighters, cruise missiles and submarines.

The data on defense spending comes as China’s National Party Congress reduced its economic growth target for 2019

6The Council on Tall Buildings and Urban Habitat, Year in Review: Tall Trends of 2018, March 2019.

to a range of 6% to 6.5%. In our view, that level of growth is achievable but the inconvenient truth is that China is diving deeper in debt and each stimulus package is taking longer to take effect. In 2008, it took China’s economy only three months to bounce back, while more recently in 2012, it was six months. Especially given other challenging factors such as its reliance on special purpose bonds to finance many infrastructure projects, China’s spending comes at a great cost as companies and consumers are choking on debt, driven by eased credit,

lax regulatory hurdles, and state subsidies over the previous decade. Despite currently rising vacancy rates, expanding levels of debt, excess inventory—all key metrics to monitor over the near term—China’s building and spending mania rolls on. The government is in “whatever-it-takes” mode, supporting the reflationary trade in global equities this year.

Exhibit 5: China’s Defense Budget.

(In Billions of Yuan)

1,400

1,200

1,190


1,000

800

600

400

200

0

1989199019911992199319941995199619971998199920002001200220032004200520062007200820092010201120122013201420152016201720182019

Figures for 2018 and 2019 do not include funds from provincial governments. Source: China National Statistics Yearbook. Data as of March 2019.

CIO Capital Market Outlook

5

vk.com/id446425943

MARKETS IN REVIEW

Equities


Total Return in USD (%)


Current

WTD

MTD

YTD

DJIA

25,450.24

-2.2

-1.7

9.7

NASDAQ

7,408.14

-2.4

-1.6

11.9

S&P 500

2,743.07

-2.1

-1.4

9.9

S&P 400 Mid Cap

1,860.28

-3.3

-2.6

12.2

Russell 2000

1,521.88

-4.2

-3.4

13.1

MSCI World

2,051.12

-2.1

-1.6

9.3

MSCI EAFE

1,839.23

-1.9

-1.7

7.4

MSCI Emerging Markets

1,030.13

-2.0

-1.9

6.9

S&P 500 Sector Returns

Fixed Income1


Total Return in USD (%)


Current

WTD

MTD

YTD

Corporate & Government

3.08

0.7

0.5

1.6

Agencies

2.72

0.5

0.4

0.8

Municipals

2.51

0.4

0.3

1.6

U.S. Investment Grade Credit

3.14

0.7

0.5

1.5

International

3.86

0.7

0.5

3.1

High Yield

6.74

-0.5

-0.4

5.8


Prior

Prior

2018


Current

Week End

Month End

Year End

90 Day Yield

2.38

2.38

2.38

2.36

2 Year Yield

2.46

2.56

2.52

2.49

10 Year Yield

2.63

2.76

2.72

2.69

Utilities


0.8%


30 Year Yield

3.01

3.12

3.08

3.02

Real Estate


0.5%


Commodities & Currencies


Communication Services


-0.1%


Materials


-0.5%


Total Return in USD (%)

Consumer Staples


-0.6%


Commodities

Current

WTD

MTD

YTD

Information Technology


-2.1%


Bloomberg Commodity

168.28

-0.6

-1.1

5.4

Consumer Discretionary


-2.5%


WTI Crude $/Barrel2

56.07

0.5

-2.0

23.5

Financials


-2.6%


Gold Spot $/Ounce2

1,298.40

0.4

-1.1

1.2

Industrials


-2.8%


Prior

Prior

2018

Energy

-3.8%


Currencies

Current

Week End

Month End

Year End

Healthcare

-3.8%


EUR/USD

1.12

1.14

1.14

1.15


USD/JPY

111.17

111.89

111.39

109.69

-5%

-4%

-3%

-2%

-1%

0%

1%

2%

USD/CNH

6.73

6.71

6.70

6.87


Sources: Bloomberg, Factset. Total Returns from the period of 3/4/2019 to 3/8/2019. Bloomberg Barclays Indices.1 Spot price returns.2 All data as of the 3/8/2019 close.

Past performance is no guarantee of future results.

Asset Class Weightings (as of 3/6/19)

Under- Neutral Over-

weight weight

Global Equities

U.S. Large Cap Growth

U.S. Large Cap Value

U.S. Small Cap Growth

U.S. Small Cap Value

International Developed

Emerging Markets

Global Fixed Income

U.S. Governments

U.S. Mortgages

U.S. Corporates

High Yield

U.S. Investment Grade

Tax Exempt

U.S. High Yield Tax Exempt

International Fixed Income

Cash

Economic and Market Forecasts (as of 3/8/19)


Q2 2018A Q3 2018A Q4 2018A

Q12019E

2018A

2019E


Real global GDP (% y/y annualized)

3.8*

3.4


Real U.S. GDP (% q/q annualized)

4.2

3.4

2.6

1.0

2.9

2.2


CPI inflation (% y/y)

2.7

2.6

2.2

1.5

2.4

1.7


Core CPI inflation (% y/y)

2.2

2.2

2.2

2.2

2.1

2.3


Unemployment rate(%)

3.9

3.8

3.8

3.9

3.9

3.7


Fed funds rate, end period (%)

1.91

2.18

2.40

2.38

2.40

2.88


10-year Treasury, end period (%)

2.86

3.06

2.68

3.00

2.68

3.00


S&P 500 end period

2718

2914

2507

2507

2900


S&P earnings ($/share)

41

43

40*

162.5*

170


Euro/U.S. dollar, end period

1.17

1.16

1.15

1.16

1.15

1.25


U.S. dollar/Japanese yen, end period

111

114

110

106

110

101


Oil ($/barrel, avg. of period, WTI**)

68

70

60

58

65

59

The forecasts in the table above are the base line view from BofAML Global Research team. The Global Wealth & Investment Management (GWIM) Investment Strategy Committee (ISC) may make adjustments to this view over the course of the year and can express upside/downside to these forecasts.

Past performance is no guarantee of future results. There can be no assurance that the forecasts will be achieved. Economic or financial forecasts are inherently limited and should not be relied on as indicators of future investment performance.

A = Actual. E/* = Estimate. S&P 500 represents a fair value estimate for 2019. **West Texas Intermediate. Sources: BofA Merrill Lynch Global Research; GWIM ISC as of March 8, 2019.

CIO Capital Market Outlook

6

vk.com/id446425943

INDEX DEFINITIONS

Securities indexes assume reinvestment of all distributions and interest payments. Indexes are unmanaged and do not take into account fees or expenses. It is not possible to invest directly in an index.

Indexes are all based in dollars.

Dow Jones Industrial Average is a price-weighted measure of 30 U.S. blue-chip U.S. companies. The index covers all industries except transportation and utilities.

NASDAQ Composite Index is a broad-based capitalization-weighted index of stocks in all three NASDAQ tiers: Global Select, Global Market and Capital Market. The index was developed with a base level of 100 as of February 5, 1971.

S&P 500 Index includes a representative sample of 500 leading companies in leading industries of the U.S. economy. Although the index focuses on the large-cap segment of the market, with approximately 75% coverage of U.S. equities, it is also an ideal proxy for the total market.

Purchasing Manager’s Index (PMI) is based on a survey of purchasing managers at more than 300 manufacturing firms by the Institute for Supply Management (ISM), the index monitors changes in production levels from month to month.

IMPORTANT DISCLOSURES

This material was prepared by the Chief Investment Office (CIO) and is not a publication of BofA Merrill Lynch Global Research. The views expressed are those of the CIO only and are subject to change. This information should not be construed as investment advice. It is presented for information purposes only and is not intended to be either a specific offer by any Merrill Lynch or U.S. Trust entity to sell or provide, or a specific invitation for a consumer to apply for, any particular retail financial product or service that may be available.

Global Wealth & Investment Management (GWIM) is a division of Bank of America Corporation. Merrill Lynch Wealth Management, Merrill Edge®, U.S. Trust, and Bank of America Merrill Lynch are affiliated sub-divisions within GWIM. The Chief Investment Office, which provides investment strategies, due diligence, portfolio construction guidance and wealth management solutions for GWIM clients, is part of the Investment Solutions Group (ISG) of GWIM.

Investing involves risk, including the possible loss of principal. No investment program is risk-free, and a systematic investing plan does not ensure a profit or protect against a loss in declining markets. Any investment plan should be subject to periodic review for changes in your individual circumstances, including changes in market conditions and your financial ability to continue purchases.

Economic or financial forecasts are inherently limited and should not be relied on as indicators of future investment performance. It is not possible to invest directly in an index.

Asset allocation, diversification, dollar cost averaging and rebalancing do not ensure a profit or protect against loss in declining markets. Dollar cost averaging involves continual investment in securities regardless of fluctuating price levels; you should consider your willingness to continue purchasing during periods of high or low price levels.

Past performance is no guarantee of future results.

Stocks of small-cap companies pose special risks, including possible illiquidity and greater price volatility than stocks of larger, more established companies. Companies may reduce or eliminate dividend payment to shareholders. Historically, dividends make up a large percentage of stocks’ total return.

Investing in fixed-income securities may involve certain risks, including the credit quality of individual issuers, possible prepayments, market or economic developments and yields and share price fluctuations due to changes in interest rates. When interest rates go up, bond prices typically drop, and vice versa. Income from investing in municipal bonds is generally exempt from Federal and state taxes for residents of the issuing state. While the interest income is tax-exempt, any capital gains distributed are taxable to the investor. Income for some investors may be subject to the Federal Alternative Minimum Tax (AMT).

Investments focused in a certain industry may pose additional risks due to lack of diversification, industry volatility, economic turmoil, susceptibility to economic, political or regulatory risks and other sector concentration risks.

Investments in real estate securities can be subject to fluctuations in the value of the underlying properties, the effect of economic conditions on real estate values, changes in interest rates, and risks related to renting properties, such as rental defaults.

Nonfinancial assets, such as closely-held businesses, real estate, oil, gas and mineral properties, and timber, farm and ranch land, are complex in nature and involve risks including total loss of value. Special risk considerations include natural events (for example, earthquakes or fires), complex tax considerations, and lack of liquidity. Nonfinancial assets are not suitable for all investors. Always consult with your independent attorney, tax advisor, investment manager, and insurance agent for final recommendations and before changing or implementing any financial, tax, or estate planning strategy.

Investments in tangible assets are highly volatile and are speculative. There are special risks associated with an investment in commodities, including market price fluctuations, regulatory changes, interest rate changes, credit risk, economic changes, and the impact of adverse political or financial factors.

Alternative Investments such as private equity funds, can result in higher return potential but also higher loss potential. Changes in economic conditions or other circumstances may adversely affect your investments. Before you invest in alternative investments, you should consider your overall financial situation, how much money you have to invest, your need for liquidity, and your tolerance for risk.

Neither Merrill Lynch, U.S. Trust nor any of their affiliates or advisors provide legal, tax or accounting advice. You should consult your legal and/or tax advisors before making any financial decisions.

The investments discussed have varying degrees of risk. Some of the risks involved with equities include the possibility that the value of the stocks may fluctuate in response to events specific to the companies or markets, as well as economic, political or social events in the U.S. or abroad. Bonds are subject to interest rate, inflation and credit risks. Investments in high-yield bonds may be subject to greater market fluctuations and risk of loss of income and principal than securities in higher rated categories. Investments in foreign securities involve special risks, including foreign currency risk and the possibility of substantial volatility due to adverse political, economic or other developments. These risks are magnified for investments made in emerging markets. Investments in a certain industry or sector may pose additional risk due to lack of diversification and sector concentration. Investments in real estate securities can be subject to fluctuations in the value of the underlying properties, the effect of economic conditions on real estate values, changes in interest rates, and risk related to renting properties, such as rental defaults. There are special risks associated with an investment in commodities, including market price fluctuations, regulatory changes, interest rate changes, credit risk, economic changes and the impact of adverse political or financial factors. Income from investing in municipal bonds is generally exempt from federal and state taxes for residents of the issuing state. While the interest income is tax exempt, any capital gains distributed are taxable to the investor. Income for some investors may be subject to the federal alternative minimum tax (AMT).

Investing directly in Master Limited Partnerships (MLP’s), foreign equities, commodities or other investment strategies discussed here, may not be available to, or appropriate for, Merrill Edge clients. However, these investments may exist as part of an underlying investment strategy within exchange-traded funds (ETF’s) and mutual funds, which are available to Merrill Edge clients.

© 2019 Bank of America Corporation. All rights reserved.

AR7L6RNH

vk.com/id446425943

GLOBAL INVESTMENT COMMITTEE / COMMENTARY

MARCH 2019


On the Markets

MICHAEL WILSON

Chief Investment Officer

Chief US Equity Strategist

Morgan Stanley & Co.

TABLE OF CONTENTS

Goldilocks Whiplash

2The narrative about lack of inflation is making the rounds again. Watch out.

Waiting for Europe

4Europe has long tried investors’ patience. Perhaps a pay-off is near.

Playing a Recovery in China

5Investors can invest directly or through US companies that sell to China.

Price Makers, Price Takers

It’s better to own companies that can set

6prices, rather than those who accept them.

Short Takes

We look at stock buybacks’ role in equity

8returns, what retail sales may be saying about the economy and why Libor has parted company from short-term rates.

Managing a Critical Asset

9Cash runs the household, and plays a role in investing. Both roles need attention.

Q&A: Don’t Fight the PBOC

China’s central bank wants to stimulate

11the economy, so investors should act accordingly, says investment manager Jan van Eck.

The Power of Momentum

For those of us who took physics in high school, we know from Newtonian dynamics that an object’s momentum can be measured by its mass and velocity. Newton’s first law of motion states, “A body at rest will remain at rest and a body in motion will remain in motion unless it is acted upon by an external force.” In the absence of an external force or friction, that object could remain in motion indefinitely without additional force or energy. Think of a rocket that has achieved escape velocity.

So what does this simple law of physics have to do with investing? Well, investors are well versed in the power of momentum. In fact, over the past few decades, price momentum has become one of the more popular strategies followed by both active and passive investors. Since the financial crisis, I would argue these strategies have become even more popular. The proliferation of quantitative managers who practice trendfollowing, combined with the suppression of volatility by aggressive monetary policies around the world, produced strong returns.

Of course, price momentum can cut both ways, and the fourth quarter of last year, December in particular, was a harsh reminder of that fact. There is little doubt about which way price momentum is moving now, as global equity markets are off to their strongest start since 1991. There is also growing consensus around the view that there may be little in the way to stop it. Going back to physics, in the absence of external forces or friction, the object is likely to continue on its upward path—hence, the growing bullishness by both investors and market commentators.

As a market strategist, it’s my job to incorporate such factors into our price targets and advice to our clients. However, it’s also my responsibility to make sure our clients understand the risk/reward proposition for the price movements we expect. Price momentum is a powerful and sometimes seemingly unstoppable force, like now or in December. However, one thing is clear—the risk/reward assessment for buying stocks is worse today than it was in late December, even though price momentum is currently bullish. It’s often said that stocks are luxury goods, and nobody really feels comfortable buying a luxury item on sale for fear there must be something wrong with it. While we are unlikely to see the kind of negative price momentum we experienced late last year, sometimes price momentum doesn’t need an external force—e.g., a reason—to roll over. It just takes a little gravitational pull.

vk.com/id446425943

ON THE MARKETS / STRATEGY

Goldilocks

Whiplash

ANDREW SHEETS

Chief Cross-Asset Strategist

Morgan Stanley & Co.

Markets frequently change their minds, but even adjusting for that,

the shift in “conventional wisdom” in recent months has been nothing short of whiplash. In December, there was widespread agreement among investors that recession risk had risen sharply, that rising inflation pressures would keep central banks tightening policy and that US-based risks around trade and government funding had gone up significantly. Skip forward two months and these fears have been replaced by a different, if familiar, term: “Goldilocks.”

The Goldilocks narrative made repeated appearances between 2010 and 2016, and the current version sounds something like this: “Inflationary pressures have receded, giving central banks wide latitude to pause almost indefinitely on policy tightening. Global growth is slowing, but not enough

to be truly concerning, and US political risks are close to resolution, with growing investor optimism that lasting solutions to funding the US government and US-China trade are now within reach.” We are skeptical that this story holds together.

LACK OF INFLATION. The Goldilocks narrative depends on a lack of inflation, which gives central banks the opportunity—though not the obligation— to continue accommodative monetary policies. Core inflation in developed markets has moved sideways in recent months, forward-looking inflation expectations have dropped sharply and emerging market inflation sits near a 15year low. Taken together, investors sound more emboldened that a lack of inflation pressure means that central banks have nothing but time.

We’re not so sure. Even with recent energy-led declines, headline inflation is near the 25-year average in the US. The same could be said for the UK, France,

Unemployment Rates in the US, Japan and the Euro Zone Are Near 20-Year Lows

14% Unemployment Rate


20-Year Minimum-Maximum Range

12

Current


10


Germany and Japan. The unemployment rate sin the US, Japan and the Euro Zone are near their 20-year lows (see chart). Not surprisingly, measures of wage growth in the US and Europe continue to push higher. All these suggest that developed market economies are working with significantly less spare capacity than they were under prior periods when Goldilocks reigned.

SETTING BENCHMARKS. It’s also important to be careful with level-setting in the inflation discussion. Yes, current inflation as measured by the US core Personal Consumption Expenditure (PCE) Index, at an annualized 2.2% rate, is low by the standards of the past 60 years. Still, it is far less extreme relative to past decades. Lest one thinks that inflation provides a true late-cycle warning signal, this is a good time to remember that the core PCE is currently at the same level as it was in May 2007 and higher than May- to-December 1999 (see chart, page 3).

Goldilocks is about more than a lack of inflation; it also requires enough growth to allay downside fears, and that’s our other problem with this argument. Global growth data remain poor. The weakness in the data is notably broad. Trade data, global purchasing managers’ indexes and earnings revisions have all turned sharply lower in the past three months—a powerful reminder that weakness in the fourth quarter of 2018 wasn’t simply about the Federal Reserve—and, while US data have held up better, it’s hardly been immune. In January, we saw the worst month-on-month decline in US retail sales since the early 2000s.

8

6

4

2

0

US

Japan

Euro Zone

WEAKNESS TROUGHING? There is a good debate about whether this weakness is currently troughing. Morgan Stanley & Co. economists think we are close to more aggressive economic stimulus from China, viewing the sharp rise in total social financing in the most recent monthly data as a sign that policymakers are taking bold actions. However, if these measures provide a strong boost to the Chinese—

Source: Bloomberg, Morgan Stanley & Co. Research as of Feb. 11, 2019

Please refer to important information, disclosures and qualifications at the end of this material.

March 2019

2

vk.com/id446425943

and the global—economy, that wouldn’t fit the Goldilocks script. If these measures fail to materialize, or are unsuccessful, it wouldn’t be Goldilocks, either.

Meanwhile, it’s important to remember that the weakness in US earnings is just beginning. Our US equity strategists now expect just 1% earnings-per-share growth for the entire year, a reminder that the challenges to the US fundamental story aren’t going away any time soon.

POLITICAL FACTORS. Finally, there’s politics. The third part of the Goldilocks story is that risks around US trade and government funding will now provide positive catalysts. MS & Co.’s US public policy team, led by Michael Zezas, disagrees. This is partly because investor optimism on both issues has already risen materially, while key issues remain unresolved. On trade, the Trump administration put the increased tariffs for China on hold, but major issues remain unresolved. On government funding, President Trump’s declaration of a state of emergency to secure funding for a border wall set up a new confrontation with Congress and the likelihood of a long court battle.

Core PCE Inflation Remains Above the 20-Year Average


US Core Personal Consumption Expenditure Index

2.5%

20-Year Average


2.0

1.5

1.0

0.5

1999 2001 2003 2005 2007 2009 2011 2013 2015 2017

Source: Bloomberg, Morgan Stanley & Co. Research as of Feb. 11, 2019

In short, we think that investors should be skeptical of the Goldilocks narrative and look for strategies that benefit from inconsistencies within it. Big picture, we are not looking to add exposure here, and we have been looking to reduce some emerging market beta into strength. Our forecast for stimulus that will help China growth stabilize while US growth continues to moderate supports the strategic case to be short the broad US

dollar and overweight international over US equities as well as a bullish view on both A-shares and the renminbi. On a smaller scale, our rates strategists continue to think that the level of US real rates is too high relative to expectations that the Fed is now done hiking for the cycle. Either those expectations of further hikes should come up, or 10-year real rates should come down.

Please refer to important information, disclosures and qualifications at the end of this material.

March 2019

3

vk.com/id446425943

ON THE MARKETS / EQUITIES

Waiting for

Europe

LISA SHALETT

Chief Investment Officer

Morgan Stanley Wealth Management

One of the most persistent stories of the past decade has been US stocks

outperforming the rest of the world, and one of the most dramatic examples is the US versus Europe. From March 2009 through Feb. 27, the S&P 500 Index gained nearly 300%, while the Euro STOXX 600 Index logged just 105%.

Why has Europe been such a laggard? Plagued by slow economic growth and lack of progress on fiscal and political integration, Europe has become vulnerable to volatile, populist and nationalistic politics and structural threats like Brexit and France’s “yellow vest” protests. The European Central Bank (ECB) has tried to follow the Fed’s Quantitative Easing (QE) playbook to pump up the economy, but the sheer complexity of navigating policy while sovereign debt markets are still priced for national budget dynamics has made policy less effective. Still, we have continued to see opportunity.

AN EXPORT PLAY. At the start of 2018, the Global Investment Committee (GIC) increased its allocation to European equities believing its dependence on global exports—48% of GDP, twice the level of China and three times that of the US— would allow it to benefit from the global recovery we forecast. Instead, the US dollar strengthened, which wreaked havoc with emerging markets growth; escalating trade tensions emanating from Washington made matters worse. By midyear, China’s economy started to slow and Germany’s auto industry was contracting, in part due to threats of new US tariffs. GDP growth, at a healthy 2.8% annualized pace in 2018’s first quarter, fell to 1.2% by the fourth quarter.

This year, growth has continued to deteriorate. January purchasing managers’ indexes indicate recession in Italy, and there has been no improvement in Germany, France or Spain. The IFO Business Climate Index is at recession levels. Earnings revisions are pointing

Economic Disappointments in Europe May Be Ending

60

Citi Economic Surprise Index


40

Euro Zone

US


20


0


-20


-40


-60


-80


-100


-120


Feb '18

May '18

Aug '18

Nov '18

Feb '19

Source: Bloomberg as of Feb. 26, 2019

toward a corporate profits recession, with year-over-year earnings shrinking by about 1%. Equity valuations are extremely low in such early-cycle sectors as financials, materials, autos and transports, where dividend yields range between 4% and 6%. Sentiment is awful, with hedge funds’ net long exposure to Europe in the 20th percentile. Still, the Euro STOXX 600 is up 9.6% for the year to date.

UPWARD SURPRISE. Why? Economic growth may be within a quarter of troughing and surprises may be poised to turn upward now that expectations have washed out (see chart). In Germany, a trough may be forming for auto-related manufacturing, with factory orders up 4% in January—the best reading in eight months. Should China’s recovery take hold and reignite trade, the weak euro should be a tailwind for exports. Consumption should also get a boost as real wage growth rebounds.

Then there’s the policy arena. The ECB remains loose with QE as bond proceeds are being reinvested and the central bank continues to buy sovereign debt. On the fiscal side, politicians are trying to address populist concerns. In both France and Italy, budget deficit guidelines look likely to be breached; Italy is moving toward a universal basic income; Spain is boosting the minimum wage by 22%; and Germany is making tax reforms that favor pension savings and childcare.

THE POLITICAL CARD. Politics remains the biggest wild card. Still, investors are already skeptical and any positive news of “muddle through” could be rewarded. The upcoming resumption of auto tariff talks with the US could take a negative turn if Washington feels emboldened about progress with China, but more likely the resolution will be to stretch out negotiations. The end of March could bring a “no deal” or “hard” Brexit. However, in our view, Brexit is more likely to be resolved in some way that stabilizes the UK economy. In that case, it would be plus for Europe, too.

Please refer to important information, disclosures and qualifications at the end of this material.

March 2019

4

vk.com/id446425943

ON THE MARKETS / EQUITIES

Playing a Prospective

Recovery in China

DANIEL SKELLY

Senior Equity Strategist

Morgan Stanley Wealth Management

KEVIN DEMERS, CFA

Equity Strategist

Morgan Stanley Wealth Management

Last year, China’s GDP growth slowed to 6.6%—the lowest level since 1990.

The stock market was hit hard, too, as the Shanghai Shenzen Composite CSI 300 Index lost more than a third of its value. Now, the government is taking steps to spur growth and, so far this year, the index has recovered about half of last year’s losses. This sets up an opportunity for investment in China.

Of course, the equity play depends on an economic rebound. In our view, a combination of monetary and fiscal stimulus measures will likely stabilize growth in the current quarter and pick up as the year progresses (see chart). These include continued cuts in reserve requirements, perpetual bond issuance for banks and tax incentives that could, say Morgan Stanley & Co. economists, boost GDP by up to 0.6%.

Next, we believe thawing trade tensions

with the US could drive growth. Michael Zezas, MS & Co.’s policy strategist, believes that a further escalation of tariffs is unlikely, as both China and the US have seen economic growth slow and US companies are calling out the negative impact of tariffs. Indeed, the announcement late last month that the US will put the planned March 1 tariff increases on hold supports this view. Finally, since the Federal Reserve has paused interest rate hikes, Chinese policymakers have room to cut rates. Even so, MS & Co. currency strategists expect the renminbi to strengthen as China becomes more dependent on foreign capital, which would improve total returns for US investors.

The most direct way to play a China recovery is through A-shares, which trade at a compelling 12 times the 2019 consensus earnings per share. In addition, MS & Co. strategists recently raised their forecast for the Shanghai Shenzen to 4,300, a 17% gain. Many US companies appear well positioned to benefit, too. We see opportunity in these sectors:

Petrochemicals. MS & Co. analysts

MS & Co. Anticipates an Upturn in China GDP Growth

7.2% China Real GDP Growth, Annualized Historic Morgan Stanley & Co. Forecast

7.0

6.8

6.6

6.4

6.2

6.0

2015

2016

2017

2018

2019

Source: Morgan Stanley & Co. Research as of Feb. 25, 2019

expect Chinese petrochemical demand growth of 5%. Trade resolution and a growth rebound offer a potential upside. Recent capacity additions have been digested faster than previous cycles, which should drive margin expansion.

Construction and agricultural machinery. Government stimulus and improving credit growth should bolster Chinese infrastructure, benefitting companies that sell machinery into these markets. If tariffs are lifted, constructionequipment companies should broadly benefit from better underlying demand and price/cost dynamics. Furthermore, recent new-order data for agricultural equipment have slowed as US farmers take a wait- and-see approach on tariffs. Improving clarity on trade may drive new investment to augment existing replacement cycles.

Commercial aerospace. China is an important market for aerospace companies, responsible for some 18% of total deliveries over the next 20 years. Notably, while China has maintained a neutral response to the industry to date and placed no retaliatory tariffs on aircraft imports, new orders have slowed. With normalized new orders two-to-three times higher than the recent pace, we see nearterm opportunity for accelerated activity. This is because China needs to expand its aircraft fleet to support continued growth in air traffic. Longer term, Chinese demand for air travel and tourism should remain robust, given rising wealth levels.

Auto supply chain. Last year, Chinese passenger car sales fell to 23.7 million units, a 4.4% decline, due to restrictive financing standards, falling consumer confidence and tariff-related disruptions. However, as stimulus takes hold, we believe there are attractive recovery plays other than the automakers. We favor the higher-growth contributors to the auto supply chain—particularly makers of connectivity technology and glass-related products—as they should benefit not only from volume recovery but also from content gains longer term.

Please refer to important information, disclosures and qualifications at the end of this material.

March 2019

5

vk.com/id446425943

ON THE MARKETS / THEMATIC INVESTING

Price Makers, Price Takers

And Technological

Deflation

SCOTT HELFSTEIN, PhD.

Senior Investment Strategist

Morgan Stanley Wealth Management

IAN P. MANLEY

Investment Strategist

Morgan Stanley Wealth Management

As consumers, we all recognize pricing power. Companies with pricing

power make goods—from mobile phones to athletic shoes and autos—that cost significantly more than their competitors and for which demand is so strong that they rarely go on sale. Companies that can set a price are “price makers,” while those with little ability to move prices are “price takers.” Investing in firms with pricing power while avoiding those with limited ability to influence prices could prove a lucrative strategy.

Firms with pricing power can often increase prices of final goods without losing significant market share or volume. Importantly, even firms with pricing power can’t raise prices indefinitely. At

some price, customers will either forego the product, or prices will reach levels generating sufficiently attractive returns to draw new competitors into the market.

Across a range of economic conditions, makers should be better positioned to provide the stable and growing profits likely to foster stronger investment returns. While there is nothing revolutionary about that statement in itself, structural economic changes make pricing power more important going forward, especially given the deflationary pressures of technology.

TECHNOLOGICAL DEFLATION. The technology-driven efficiency boom that helped drive a doubling in S&P 500 profit margins since 1990 does come with a cost frequently referred to as “technological deflation.” As companies innovate quicker and identify new cost savings, goods get cheaper. From 1950 to 1989, US inflation averaged 4.3%. Since 1990, it has dropped to 2.5%. Since the 1980s, inflation has

Secular Deflation in Decline for Nearly 50 Years

14% CPI, Year Over Year

CPI, Decade Average, Year Over Year

12

10

8

6

4

2

0

Source: Bloomberg, Morgan Stanley Wealth Management as of Dec. 31, 2018

fallen in subsequent decades (see chart). Since 2010, it has averaged only 1.9%.

In this environment, firms with pricing power have an extra lever to maintain or grow profits that price takers do not. This gives price makers more consistent profitability and growth as long as they maintain pricing power. The gradual increase in the value of intangible or nonphysical assets, like patents or brand value, reflects the importance of differentiation as a means to achieve pricing power. Makers can ride out a range of economic conditions better than other firms. Takers may look to overall price inflation to sustain and grow profits, but that is an unreliable strategy when under price deflation.

POWER SOURCES. Pricing power can be derived by external industry structure or the internal characteristics of a specific firm. Factors outside the firm that can impact pricing power include the competitiveness of the industry, barriers to entry and the concentration of suppliers and buyers. The unique nature of goods and services offerings such as quality or brand value is internal to the firm.

The structure of industries makes them more or less competitive. If there is only one player, the company has monopolistic pricing power and can charge whatever they want within broad limits. While monopoly market structures offer the most powerful pricing power, they are so easily abused that regulation often prevents their emergence or continuation. An industry may also have a small number of large players that dominate the market, known as an oligopoly. When there are only a few players, firms could formally or informally cooperate in setting prices. When there are a large number of firms offering similar goods, firms engage in price competition. Without anything to distinguish one product from another, these products become commoditized and the low-cost producer wins.

BARRIERS TO ENTRY. Industries with large barriers to entry will have fewer competitors than those that are easier to

Please refer to important information, disclosures and qualifications at the end of this material.

March 2019

6

vk.com/id446425943

An Investment Framework for Identifying Pricing Power

External


Power Over


Buyers/Suppliers


(percent of revenue to each)


Gross Margins

(average postcrisis)

Internal


Value of Marketing and


Distribution


(SG&A as a percent of sales)


Note: Postcrisis margins are yearly averages from 2009 through 2018

Source: Bloomberg, Morgan Stanley Wealth Management

enter. Barriers can be funding, resources or technological expertise. Others may include regulatory guidelines, operating permits and intellectual property rights. As data-oriented firms become a larger part of the economy, an important barrier is the network effect: The more people that use a service, the more valuable it is.

Just as industry concentration affects pricing power, the availability of suppliers and customers matters, too. If a company’s suppliers are concentrated or if there is a high switching cost, suppliers can force a company to pay higher prices. The same rule applies to customers. The more concentrated a company’s set of buyers, the more power those buyers have.

PRODUCT DIFFERENTIATION. Many sources of pricing power lie beyond a firm’s control, but companies can focus on differentiating their product within an industry to capture pricing power. By creating a unique value proposition, firms reduce the risk associated with substitute goods. Firms can limit the impact of substitutes in several ways. The first is

high switching costs for goods or services. An alternative means of differentiating products is moving up the quality scale.

Finally, branding is critical for pricing power. Producing a higher-quality product will not provide companies pricing power if customers do not know there is a quality differential. Branding plays a critical part in signaling quality for products and services. Brand name products can usually charge a premium in the marketplace and are an important source of value for many firms. Companies can tie brands to a range of valuable attributes such as prestige in luxury or environmental sustainability.

MULTIPLE METRICS. Our investment thesis is relatively straightforward: Own firms with pricing power and avoid those without. That said, rigorously identifying firms with pricing power relative to those without is difficult and has received substantial attention in academic work. There is no easy answer. Instead of relying on a single approach, we attempt to identify pricing power using a series of metrics. There are several quantifiable

variables that help triangulate a firm’s pricing power based on industry concentration; intangible assets; power over buyers and suppliers; selling, general and administrative expense (SG&A) as a percent of sales; and gross margins (see chart).

Some industries that seem more likely to make prices are internet and direct marketing retail, pharmaceuticals, media, beverages, and interactive media and services. Takers are largely commodity based, such as metals and mining, construction and engineering, road and rail, auto components and paper and forest products. Investors should recognize that there are also firm-level idiosyncratic factors that can contribute to pricing power, and the industry classifications serve as one step in identifying pockets of potential price makers.

The above is an excerpt from the Jan. 16, 2019, issue of AlphaCurrents. For the full report, please contact your Financial Advisor.

Please refer to important information, disclosures and qualifications at the end of this material.

March 2019

7

vk.com/id446425943

ON THE MARKETS / SHORT TAKES

Buybacks Important, but Not a Principal Driver of Equity Returns

Political headlines about a potential change in the tax treatment of stock buybacks has raised questions about just how much they contribute to equity returns. While they have been a meaningful tailwind for returns since the financial crisis, they have not been a principal driver. In fact, we estimate, from January 2011 through the end of last year, buybacks have accounted for some 12 percentage points of the market’s 124% total return—less than half the contribution from dividends. Of course, the impact varies by sector. In buyback yield, or net buybacks as a percentage of market capitalization, communications services, at 6.2%, was the leader (see chart). That’s nearly three times the market’s buyback yield. For real estate investment trusts and utilities, the yield was negative, indicating companies in those sectors collectively issued more shares than they repurchased.—Michael Wilson

7%

6.2%

Average Trailing 12-Mo. Buyback Yield, 2011-2018

6


5


4


3.3%

2.7%

2.7%


3


2.2%

2.1%

2.0%

1.8%


2


1.2%


1


0


-1


-0.5%

-1.0%

-2


Comm. Svs.

Financials

Industrials

Cons. Disc.

Health Care

Top 500

Staples

Materials

Energy

REITs

Utilities


Source: ClariFi, Morgan Stanley Research as of Feb 19, 2019

Surprise Slump in Retail Sales Could Signal Fall-Off in GDP Growth

3 % US Retail Sales (month over month)

2

1

0

-1

-2

-3

'09

'10

'11

'12

'13

'14

'15

'16

'17

'18

Source: Bloomberg as of Feb. 15, 2019

The December US retail sales report, released Feb. 14, was a shocker. It showed the largest monthly decline in more than nine years (see chart). Compared with November’s results, headline sales fell 1.2%, and tumbled 1.8% when excluding autos, gas and building materials. Morgan Stanley & Co. economists’ retail control group, which also exclude autos, gas and building materials, fell 1.6%, in contrast with the firm’s forecast for a 0.3% gain. Retail sales are closely watched because the consumer accounts for about two-thirds of US GDP. This downside surprise lowers the tracking estimate for fourth-quarter 2018 GDP growth to 3.1% from 3.7%. In addition, MS & Co.’s retail sales tracker points toward a 0.3% decline in retail sales in January, suggesting that first-quarter GDP is now tracking as low as 1%. Late last year, the firm’s first-quarter 2019 forecast was for 2.2% growth. Also of concern is the Citi US Economic Surprise Index, which on Feb. 15 suffered the biggest one-day drop since 2006. That suggests slower growth, too.—Vibhor Dave and Chris Baxter

Investor Surge Into Money Market Funds May Be Pressuring Libor

The first rate hike of this tightening cycle was in December 2015. In the preceding three years, the three-month Libor rate averaged less than 30 basis points. Then, as the pace of rate hikes accelerated, Libor rose, too, reaching 2.82% by the end of last year (see chart). Since then, it has fallen to 2.65%, which is the sharpest reversal in years. Why? One reason may be that money market funds need to invest a surge in cash they have received from retail investors, perhaps in reaction to risk assets’ poor performance in the fourth quarter. Money market funds invest in high-quality, ultrashort investments that correlate with Libor. It is uncertain how long Libor will be under pressure but, should it remain around its current level, holders of Libor-linked floating-rate securities may not see as large an upward adjustment to their coupons as they would otherwise expect. —

Daryl Helsing

Source: Bloomberg as of Dec. 31, 2018

Please refer to important information, disclosures and qualifications at the end of this material.

March 2019

8

vk.com/id446425943

ON THE MARKETS / CASH

Cash Matters: Managing

A Critical Asset

Cash is the most common source of liquid wealth on a household’s

balance sheet. Due to the different financial roles it plays and forms it takes, it is also one of the most misunderstood. Households use cash to pay bills, diversify portfolios and act as a source of security against the unknown. These different roles lead to confusion when making decisions about cash. Complicating matters further, the needs for cash in different contexts are interrelated. For example, the cash reserves a household should hold for emergencies are related to the cash on hand needed for payments, or the risk tolerance that helps to determine how aggressive a household’s portfolio strategy should be—and thus the cash portion of that strategy—is related to the cash balance it should hold over and above what it has budgeted for expenses, and so on. These dynamics increase the complexity in determining the appropriate amount and type of cash a household should hold.

Common Mistakes

Households often make material errors when it comes to cash. One is to hold too much cash out of concern about risks in the market or a source of income. While these are valid concerns, hedging such risks has costs, and holding excessive quantities of cash drags down a household’s overall return on savings, negatively impacting its ability to meet its long-term financial goals. The converse can also be a costly mistake: when households maintain too little cash due to the desire to boost returns. Such positioning may expose them to the risk of having to liquidate investments at inopportune times due to a personal emergency, a lack of rigorous budgeting or for unexpected expenses. It may also mean that the household is taking more risk than is appropriate or is insufficiently diversified in its investments.

Households often err in what form of cash they use. The most recognizable forms are physical currency and checking

account balances. In fact, cash comes in many flavors with varying attributes of yield and liquidity that make it more or less effective for specific functions.

Household decision-makers are often not aware of the breadth of cash options, nor do they always seek or receive advice in making the right choices.

A working definition for cash is any security that can be readily liquidated into physical currency or to banking balances at the moment of the holder’s choosing without loss of value. This definition means that savings accounts and money market accounts or funds, as well as the types of securities that underlie such investment products (e.g., commercial paper, US Treasury bills and other shortterm government bonds with a maturity generally less than a year) can be considered cash (see chart).

These different forms vary most notably in their yield, the degree to which their ready liquidation without loss can be relied upon and, therefore, the degree to which they deliver the features generally associated with the value of holding cash. In exchange for the assumption of risk, short-term certificates of deposit (CDs), US Treasury bills and commercial paper typically generate higher yields than deposit accounts. CDs can earn a higher yield than cash in a deposit account and

How Liquidity, Risk and Return Line Up on the Cash Spectrum

Risk / Illiquidity

Yield / Return

Source: Morgan Stanley Wealth Management GIC

Ultrashort Duration Fund

Long-Term CD

Stable Value Fund

Short-Term CD

Money Market Account

Savings Account

Checking Account

Please refer to important information, disclosures and qualifications at the end of this material.

March 2019

9

vk.com/id446425943

also have no principal risk, as they are insured by the FDIC up to a maximum of $250,000. If cash is required prior to maturity, however, the proceeds may be subject to withdrawal penalties, which may eat into principal.

Similarly, US Treasury bills have higher yields than cash, but have minimal interest rate risk that can lower their market value. Commercial paper, shortterm corporate bonds and other nongovernment debt, in addition to interest rate risk, carry credit risk, which could result in loss if the issuer defaults. They also incur transaction costs in the form of bid/ask spreads if liquidated prior to maturity. Money market mutual funds, which invest in securities such as Treasuries, commercial paper, and shortterm corporate bonds, also typically earn a higher yield, reflecting the underlying investments. Depending on whether they are government or retail funds, they carry the risks of those individual securities and charge management fees.

In other words, while cash is generally liquid, low risk and generates low total returns primarily via interest income as opposed to capital gains, there is actually a continuum in which liquidity, risk and return vary considerably. That variation can be acutely consequential, as risks can manifest themselves at inopportune moments. Small differences in returns add up over extended periods of time to large differences that can materially impact the achievability of financial goals.

Start With Need

To understand how to size and manage cash, start by considering why you need it. There are three distinct sources of need for cash, which will vary in magnitude from one household to another. The first is spending money, and sizing the need can be done through budgeting. Much spending is regular and thus predictable— mortgage payments, utilities and insurance. Dining out, vacations and entertainment are variable and discretionary. Then, there are things that come up that might have been anticipated

Prioritized Features Vary by Cash Need

Spending

Emergency

Portfolio

Money

Savings

Cash


Liquidity


Capital


Preservation


Yield

Source: Morgan Stanley Wealth Management

but not accounted for as expenses. As such, households should maintain sufficient balances to support projected spending with some buffer to minimize the potential for costs arising from late payment or overdraft penalties or the risks associated with an impromptu need to liquidate investments.

The second need for cash is as emergency savings to protect against adverse events that could affect the ability to meet financial obligations. If that can be done out of emergency cash, a household will not have to liquidate investments, which can have significantly adverse effects if sold at depressed prices or if the sale triggers steep transaction costs and/or taxes. The third need for cash is as part of an investment strategy. The relative amount of cash that an investment portfolio maintains should be determined according to a household’s financial goals, preferences and available resources. In some cases, cash can enhance a diversified investment strategy, especially for more conservative strategies.

Feature Importance Varies

Identifying need helps to illuminate which characteristics of cash are most valuable depending on how the cash will be used, and how that differs across needs (see chart). For spending money, the optimal solution is an account that supports transactions—typically a checking account. Physical currency, while a plausible way to make payments,

is an increasingly unrealistic method in a rapidly digitizing economy. Given that the average balances households need to cover expenses are an important portion of their wealth, the yield from these balances is an important consideration as well.

When it comes to emergency savings, the desirable features are less constrained by any single factor, and thus the tradeoffs are more complex. Because emergency savings are typically larger than for spending money, yield is even more important. However, capital preservation and reliability of liquidation without losses remain high priorities.

As part of a portfolio’s investment strategy, yield is on par with liquidity, which is somewhat more negotiable than for emergency savings. Yield is still important, especially to facilitate the deployment of capital for investment opportunities that may arise. However, the need for liquidity to facilitate portfolio tactics and yield to support income must be balanced against the more long-term need to provide diversification and total return, including returns sourced from capital appreciation.

The above is an excerpt from the February 2019 Special Report. “Cash Matters: A Framework for Managing a Critical Asset.” The authors are Lisa Shalett, Daniel C. Hunt, CFA, Suzanne Lindquist, Zi Ye, CFA, and Darren Bielawski, CFA. For the complete report, see your Financial Advisor.

Please refer to important information, disclosures and qualifications at the end of this material.

March 2019

10

vk.com/id446425943

ON THE MARKETS / Q&A

Don’t Fight

The PBOC

The old adage, “Don’t fight the Fed,” advises investors to buy U.S. stocks

when the Federal Reserve is easing and sell during periods when the central bank is tightening monetary policy. Jan van Eck, CEO of VanEck, has a new twist on that mantra, advising: “Don’t fight the PBOC.” The People’s Bank of China (PBOC) cut short-term rates last year amid dismal performance for Chinese and other emerging markets (EM) equities. Now, van Eck believes that these stimulative actions could have positive aftereffects for investors this year. He recently shared his outlook with Morgan Stanley Wealth Management’s Tara Kalwarski. The following is an edited version of their conversation.

TARA KALWARSKI (TK): What’s your take on what has happened, and what will happen, in China?

JAN VAN ECK (JV): Taking a step back, what I think hurt China’s equity markets last year was a deleveraging campaign by the Chinese government to pull back and slow the explosion of credit that happened several years before. Primarily, they have what they call “social financing”—which I call “unsecured credit”—that goes, in many ways, just to the free enterprise or private sector, as opposed to state-owned enterprises (SOEs).

The effect of the deleveraging was a very tight monetary supply situation, and that’s what I think caused China’s equity markets to contract. It also caused a spike in interest rates for private enterprises. One nuance to understanding China is the fragmentation in credit availability between the SOEs and the private sector.

Interest rates for SOEs did not go up much.

I think there are three cases for China, but the base case is much more positive. I think the government is going to undertake a variety of what we call “drip stimulus” measures to try to make sure that economic growth continues and that credit filters through to the private sector, where it had been effectively almost cut off by the end of last year.

If you believe in this base case of slower-but-continued growth for China and positive, accommodative efforts by the PBOC, it should be good for EM equities as well.

TK: What do you see as the bull vs. bear case for China?

JV: In the bear case, the drip stimulus doesn’t work. They are either not stimulating enough, not using the right toolkit or, because the state-owned sector has easy access to credit, it’s not easy to get credit going back to private enterprises. A lot of private companies are choking from lack of credit. Just because you tell the state-owned banks to lend more, that doesn’t mean the money will go to the private sector. On the fiscal side, the 2018 deficit was the largest on record, so there are limits to how much more the Chinese government can do in terms of fiscal stimulus.

The overly bullish case is that a robust trade deal is struck and there’s continued integration of the supply chain and trade between China and the US

What I see happening is that the economy will continue to do okay, but a process of decoupling is going to start between the US and China. The Trump administration is obviously signaling to

companies to be careful about overinvesting in China, and the tariffs are giving them an economic disincentive to put their supply chain there.

On the Chinese side, I don’t think they are signaling an appetite for a very reformoriented trade deal. It doesn’t appear that they’ve been offering a lot of concessions to the US We also know that the Chinese have agreed to things before—in front of the World Trade Organization and others—and there have been major problems with implementation.

That level of frustration also suggests there won’t be one big kumbaya moment. More likely, we grind through the base case and maybe reach a trade deal, and there is no big political shock.

TK: How did the 2018 trade disputes affect investment opportunities?

JV: I don’t think that was the story, even though it got a lot of headlines. I know “trade talk” is shorthand for USChina tensions—and there are certainly tensions—but I think it was the deleveraging that hurt the Chinese equity and bond markets more than the trade talks.

Having said that, I believe those trade tensions are translating into a longer-term decoupling. There is real frustration on the Chinese side, especially with the Huawei case. The two countries look at the situation extremely differently. The US looks at it as a security issue; China sees it as the US ganging up on a successful Chinese company unfairly.

Whatever view is correct, enthusiasm for US products is at risk in China. We’ve seen that before in China with regard to Korea and Japan. The government is not encouraging it, but it’s just a reality on the ground until that situation is settled.

TK: Given China’s share of the global economy, what is its impact on investors?

JV: China has been a major contributor to global growth. It contributes over 1% to the world’s total growth every year, and

Please refer to important information, disclosures and qualifications at the end of this material.

March 2019

11

vk.com/id446425943

our base case is that this continues. That’s why this question is so important.

The effects of China’s growth ripple through every asset class around the world. Directly, it affects emerging markets and commodity prices. Commodity prices and commodity-related equities took a hit in the third quarter of 2018, before it was clear that China was going to start stimulating again.

Other asset classes get hit indirectly. There are US companies doing business in China, so there is an impact on US equities and their supply chains. High yield bonds are affected because energy issues are a large part of that market. If a slowdown in China causes oil prices to go down, as we saw at the end of 2015, it affects the high yield market, too.

China is really part of the global risk on/risk off mechanism. That’s why there are two big questions for investors: China growth, and developed market central bank activity—the Fed and the European Central Bank.

The major risk factor in terms of the outlook for Chinese growth is whether the rate cuts will have the desired impact on credit creation in China. We haven’t seen much of an impact so far. Still, there are some green shoots in the economy. We’ve seen some improvements in construction and in manufacturing fixed investment.

TK: Last year, China experienced its slowest annual growth rate since 1990. Does that concern you?

JV: People have very different ideas in their minds when they think about Chinese growth. I think China’s growth in the medium term is going to slow to something like 4% a year—partially because its GDP per capita is so large that it would lead to huge imbalances if they keep trying to grow at 6% a year. If that’s the case, you could literally have the headline “China’s Growth the Slowest in 30 Years” for 36 straight months.

We generally favor active management for emerging markets, and there are companies that are growing nicely. A business can have 20% annualized profit

growth in China because the economy is so large. There’s so much happening that you don’t need high headline growth for health care companies, technology companies, and all kinds of services companies to potentially grow at very high rates.

In fact, investment in services is coming in at 60% to 70% profit growth, which is extremely high and on a par with a lot of developed economies. So the services sector is becoming important for the Chinese economy as a driver of, and contributor to, growth.

In general, the narrative around emerging markets should not be that 10% GDP growth translates into high stock prices. There isn’t that great a correlation between stock prices and GDP growth. Even in the US last year, we had good growth and bad equity returns.

TK: What’s the most common question you get from investors?

JV: Definitely trade war concerns. That’s why I try to refocus in terms of monetary policy. Politics in general makes investors nervous, but trade tensions make a lot of them question whether they even need emerging markets exposure in their portfolios.

I try to keep it simple. Look at what the Fed is doing. Look at what the PBOC is doing. If the Fed is stimulative now, that’s great—and if China’s central bank is stimulative, then you want to go with that flow, too.

TK: What are your thoughts on various ways to access China?

JV: Philosophically, we have an all-cap emerging markets approach. In the past, we had to look to smaller companies for higher growth rates but, as in the US, large-cap technology companies have been able to show potential for high profit growth. We look at structural growth. We stay away from SOEs, whether in China or elsewhere.

Short-term, though, February is a tough time to figure out what’s going on with China. Earlier in the month, the entire stock market closed because of the New

Year holiday. However, I think the fundamental trends will assert themselves. It also takes a while for central bank stimulus to filter through the Chinese economy. It may take until the second quarter before we see much movement.

TK: Any thoughts regarding China’s long-term growth versus the US?

JV: I would be hesitant today to predict if/when China becomes the world’s dominant economy. Their government very much favors SOEs right now, and that will continue to be a structural impediment. Free enterprise just works better at allocating capital, creating jobs and fostering new technology than do government-run institutions. That has been true in every country in every time period.

If China continues to follow that path, I think it will hurt growth by one to two percentage points a year. If they keep the disincentives for foreign businesses to do business there, I think that will slow their growth potential in the medium and long term and just make them a less important global player. They’ll be important for global growth—just not the dominant player.

Here’s a factoid: China opened its markets in the late 1980s, but they had decimated their economy before then. If their GDP per capita had started at even the level of Nicaragua, their growth since then would only be 4% a year. So this idea of a China miracle, I think, is not true. They’re subject to the same kind of constraints that every other economy is. If you put it in that context, I don’t think they’ll be dominating the world.

Jan van Eck and Van Eck Associates Corporation are not affiliated with Morgan Stanley Wealth Management. Opinions expressed by him are solely his own and may not necessarily reflect those of Morgan Stanley Wealth Management or its affiliates.

Please refer to important information, disclosures and qualifications at the end of this material.

March 2019

12