


vk.com/id446425943 |
|
109 |
March 2018 |
Citi GPS: Global Perspectives & Solutions |
Epilogue: Emerging Market BRATs beyond China and India
While China and India have seen phenomenal growth in FinTech led by a large unbanked user base and favorable technological/demographic factors; FinTech startups are also eyeing growth opportunities in other emerging/frontier markets.
We find BRATs (Brazil, Russia, Africa, and Turkey) as the next logical step beyond China and India where FinTech innovations have the potential to lead the way. New FinTech technology and innovations are helping banks reach the underserved populations in these markets. Additionally, the payments industry is also seen evolving with branch banking gradually turning into e-banking and increased use of payments wallets.
Introducing the BRATs
While geographically disparate, the BRAT countries share common features such as a relatively high level of social media and Internet usage, high return on equity (OE) private sector banks but lesser international attention versus the likes of China and India in the VC FinTech space. We find that the BRAT markets are developing FinTech ecosystems via co-working spaces, incubators.
Brazil – Has a large online user base, deep financial markets, an oligopolistic banking sector with generous spreads, innovative FinTech companies, and a scalable market with a population of over 200 million. Brazil has arguably the most number of startups across LatAm for payments, lending, and investment. Notable names include Nubank (digital cards) and Neon (the first digital bank).
Vostok Emerging Finance, a leading early stage investor in FinTechs in emerging/frontier markets, made one of the largest FinTech investments in the country with an investment of $30 million in GuiaBolso (a personal finance platform) in Oct. 2017. According to EY’s FinTech adoption index 2017, Brazil is the fourth largest adopter among the 20 markets studied, after China, India, and the U.K.
Russia – Overall FinTech adoption rates in Russia appear low with only close to half of the population having access to Internet/smartphones and high cash dependence, especially when compared to matured markets like Hong Kong, London, and the U.S. – but there has been a rapid acceleration in recent years.
The largest segment in the Russian FinTech industry is arguably non-bank money transfers and mobile payments, followed by online banking services (i.e., savings and investments). Prominent Russian FinTech companies include Yandex.Money, QIWI Wallet and Webmoney (offering e-payments), Unistream (money transfers) and Touch Bank (an online bank, launched by OTP Group).
In order to support FinTech growth in Russia, the Bank of Russia launched a regulatory sandbox with the Russian FinTech consortium in February 2017, to facilitate new financial services technologies and boost innovation. Other initiatives aimed at supporting development of the FinTech ecosystem include:
(1) a phased transition to open API (three participants of the AFT – PJSC Bank Otkritie Financial Corporation, JSC Qiwi Bank and JSC Gazprombank announced the opening of their own interfaces for third-party); (2) implementation of pilot projects on blockchain technology; and (3) enablement of a unified digital identification environment.
© 2018 Citigroup
vk.com/id446425943 |
|
|
110 |
Citi GPS: Global Perspectives & Solutions |
March 2018 |
Africa – The South African population is becoming increasingly digitally-enabled. 54% of South African adults (out of ~69% banked adults) have access to the Internet, while 34% of adults have a smartphone. Even more staggering is the fact that Internet users in South Africa are online for about 8 hours a day (5 hours via a computer and 3 hours via smartphone) (see Figure 105). Since 2008 Internet penetration in South Africa has increased dramatically from 9% to its current 54%. We believe that this is an indication of how important mobile banking will become within South Africa, especially when one considers that 69% of adults are banked. This means that almost 80% of banked adults have Internet access. It’s hardly surprising that app/mobile banking is the fastest growing transaction origination platform in South Africa, averaging 55% growth over the past year. App transactional volumes have increased by 55% on average, while both ATM and branch transaction growth is negative.
Turkey – Turkey’s FinTech ecosystem has seen strong growth led by striving startups and a growing young population with a push towards promoting the use of alternative payment systems (over cash). Turkey also enjoys reasonably good levels of technology use and infrastructure with ~60% Internet users. FinTech growth has been a priority for the government and major banks have partnered with FinTech companies to develop online/mobile banking services and branchless banking services. In 2017, a partnership of 13 public and private Turkish banks established TROY, the first and only Turkish domestic card scheme, with an aim to reduce cash usage with increased financial inclusion. Prominent FinTech startups in Turkey include Iyzico (an online payments company) and Cardtek (an end-to-end payment solution provider for financial institutions/telcos).
A.] Share Unique Banking Sector Characteristics
Banking systems across BRATs are highly concentrated by top five banks, with the exception of Russia – this means a lower degree of prevailing competition and possibly higher fees/interest rate charges to customers. We believe a concentrated market provides huge opportunity for FinTechs as it allows them to offer more competitive products.
Figure 101. Top 5 Banks Market Share by Country
100% |
80% |
60% |
40% |
20% |
0% |
South |
|
Netherlands |
Australia |
|
|
Thailand Colombia |
|
Denmark Malaysia |
|
|
Saudi |
|
|
|
Argentina |
|
Indonesia |
|
|
Ireland |
China |
|
Taiwan |
Germany |
|||||||||
Africa |
Peru |
Canada |
|
Chile |
|
Mexico |
|
|
Spain |
Arabia |
Sweden |
|
|
|
Japan |
|
France |
|
|
|
UK |
Austria |
|||||||||||
Greece Kuwait |
|
Qatar |
Finland Brazil |
|
Portugal |
Belgium Korea |
Philippines |
Singapore |
UAE |
|
Russia |
|
Poland |
HK |
Italy India |
|
|||||||||||||||||
|
|
|
|
|
|
|
|
|
|
|
|
|
|
|
|
|
|
|
US |
|
|
|
|
|
|
|
|
|
|
|
|
|
|
# market share measured as percent of assets
Source: ECB, Company Reports, Central Bank Websites, SNL, Citi Research
In fact we find several incumbent banks have lead FinTech innovations across BRATs, including – (1) Banco do Brasil’s launch of a structured open banking operation for incubating digital innovations; (2) Itau co-founding Cubo (a co-creation
© 2018 Citigroup
vk.com/id446425943 |
|
111 |
March 2018 |
Citi GPS: Global Perspectives & Solutions |
space for FinTech); (3) Bradesco’s launch of an online-only bank; (4) Bank VTB / Alfa Bank’s interest in technology/blockchain adoption; (5) Yapi Kredi + Monitise partnering to offer branchless banking.
We believe another factor possibly pushing FinTech innovations are the high bank net interest margins (NIMs) that offer new nimble players an opportunity to disrupt traditional banking. Notably, bank NIMs in Brazil are the second highest globally (~6%), whilst those for Turkey and South Africa are also relatively high (~4%). Not surprisingly, disruptive tech startups are seen targeting generous margins enjoyed by incumbent banks. For instance, Nubank, Brazil's biggest FinTech, offers digital cards solutions at a fraction of the cost charged by traditional banks. However, we think it’s worth pointing out that higher NIMs for Brazil banks can also be attributed to structurally high non-performing loans (NPLs) vs. the rest of LatAm (average cost of risk of ~5%).
Figure 102. Banks' Net Interest Margin by Country
7.5% |
|
|
|
|
|
|
|
|
|
|
|
|
|
|
|
|
|
|
|
|
|
|
|
|
|
|
Emerging Markets |
|
|
6.0% |
|
|
|
|
|
|
|
|
|
|
|
|
|
|
|
|
|
|
|
|
|
|
|
|
|
|
|
||
|
|
|
|
|
|
|
|
|
|
|
|
|
||
|
|
|
|
|
|
|
|
|
|
|
|
Developed Markets |
|
|
4.5% |
|
|
|
|
|
|
|
|
|
|
|
|
|
|
|
|
|
|
|
|
|
|
|
|
|
|
|
||
|
|
|
|
|
|
|
|
|
|
|
|
|
|
|
3.0% |
|
|
|
|
|
|
|
|
|
|
|
|
|
|
|
|
|
|
|
|
|
|
|
|
|
|
|
|
|
1.5% |
|
|
|
|
|
|
|
|
|
|
|
|
|
|
0.0% |
|
|
|
|
|
|
|
|
|
|
|
|
|
|
|
|
|
|
|
|
|
|
|
|
|
|
|
|
|
|
|
|
Egypt |
|
Africa |
Chile |
|
|
CEE |
|
Philippines |
USA |
Iberia |
|
Israel |
(intl.) |
|
|
|
Kong |
|
|
Taiwan |
France |
|||||||||||
Indonesia |
Colombia |
|
Arabia |
|
|
Qatar |
Thailand |
Kuwait |
Australia |
Korea |
Malaysia |
|
Benelux |
Switzerland |
Nordics |
|
||||||||||||||||||||
Mexico |
|
Saudi |
|
|
|
|
|
|
|
(dom)UK |
|
|
|
Singapore |
|
|
|
|
||||||||||||||||||
Peru |
Brazil |
|
Turkey |
South |
|
|
Russia |
|
|
Morocco |
Greece |
|
|
China |
|
|
UK |
Canada |
|
Hong |
Germany |
|
Italy |
|||||||||||||
|
|
|
|
|
|
|
|
UAE India |
|
|
|
|
|
|
|
|
|
|
|
|
|
|
|
|
|
|
|
|
|
|
|
|
|
|||
# Computed bottom-up based on stocks under Citi Research coverage for 2016 data. Source: Company Reports, Citi Research
B.] Favorable Demographics
Brazil and Russia, with populations of 150-200 million each, offer new FinTechs a large scalable market for growth. By contrast, Turkey with a young population of 80 million has a strategic advantage to become a FinTech hub, given its proximity to Europe and Asia; whereas South Africa (albeit with a total population of 55 million) has a large share of unbanked consumer demand.
Across BRATs, 60-70% of the populations have some form of banking relationship versus large unbanked consumer markets in emerging markets such as the Philippines and Indonesia. This provides FinTechs a fertile ground, as customers often just need to be converted to a more competitive product as opposed to being taught the broad array of financial products (which is often the case in emerging markets with high unbanked users).
© 2018 Citigroup

vk.com/id446425943 |
|
|
112 |
Citi GPS: Global Perspectives & Solutions |
March 2018 |
Figure 103. World Population by Countries, 2016 |
Figure 104. Banked Adult Population (% of Adults with an Account at a |
|
|
Financial Institution) |
|
1.4bn1.3bn |
|
|
|
|
|
|
|
(in millions) |
|
|
|
|
|
|
|
|
|
|
|
|
|
|
|
|
|
|
10099 99 99 99 |
|
|
|
|
|
|
|
|
|||||||||
400 |
|
|
|
|
|
|
|
|
|
|
|
|
|
|
|
|
|
|
|
|
|
|
|
|
|
|
|
|
|
|
|
|
|
|
|
98 98 98 97 97 96 94 91 |
|
|
|
|
|
|
|
|
|
|
|
|
|
|
|
|
|
|
|
|
|
|
|
|
|
|
|
|
|
|
|
|
|
|
|
|
|
|
|
|
|
|
|
|
88 87 87 |
|
|
|
|
|
|
||
350 |
|
|
|
|
|
|
|
|
|
|
|
|
|
|
|
|
|
|
|
|
|
|
|
|
|
|
|
|
|
|
|
|
|
|
|
|
|
81 79 78 78 |
|
|
|
|
|
|
300 |
|
|
|
|
|
|
|
|
|
|
|
|
|
|
|
|
|
|
|
|
|
|
|
|
|
|
|
|
|
|
|
|
|
|
|
|
|
|
69 |
69 68 67 63 |
|
|
|
|
|
|
|
|
|
|
|
|
|
|
|
|
|
|
|
|
|
|
|
|
|
|
|
|
|
|
|
|
|
|
|
|
|
|
|
|
|
|
|
|
|
|
|||
250 |
|
|
208 |
|
|
|
|
|
|
|
|
|
|
|
|
|
|
|
|
|
|
|
|
|
|
|
|
|
|
|
|
|
|
|
|
|
|
|
|
|
|
|
||
|
|
|
|
|
|
|
|
|
|
|
|
|
|
|
|
|
|
|
|
|
|
|
|
|
|
|
|
|
|
|
|
|
|
|
|
|
|
|
57 55 53 |
|
|
|||
200 |
|
|
|
|
144 |
|
|
|
|
|
|
|
|
|
|
|
|
|
|
|
|
|
|
|
|
|
|
|
|
|
|
|
|
|
|
|
|
|
|
|
|
|
|
|
|
|
|
|
|
|
|
|
|
|
|
|
|
|
|
|
|
|
|
|
|
|
|
|
|
|
|
|
|
|
|
|
|
|
|
|
|
|
|
|
|
39 36 |
|
||
150 |
|
|
|
|
|
|
|
|
|
|
|
|
|
|
|
|
|
|
|
|
|
|
|
|
|
|
|
|
|
|
|
|
|
|
|
|
|
|
|
|
|
|
||
|
|
|
|
|
|
|
80 |
|
|
|
|
|
|
|
|
|
|
|
|
|
|
|
|
|
|
|
|
|
|
|
|
|
|
|
|
|
|
|
|
|
28 |
|||
100 |
|
|
|
|
|
|
|
|
|
|
56 |
|
|
|
|
|
|
|
|
|
|
|
|
|
|
|
|
|
|
|
|
|
|
|
|
|
|
|
|
|
||||
|
|
|
|
|
|
|
|
|
|
|
|
|
|
|
|
|
|
|
|
|
|
|
|
|
|
|
|
|
|
|
|
|
|
|
|
|
|
|
|
|
|
|||
50 |
|
|
|
|
|
|
|
|
|
|
|
|
|
|
|
|
|
|
|
|
|
|
|
|
|
|
|
|
|
|
|
|
|
|
|
|
|
|
|
|
|
|
|
|
0 |
|
|
Brazil Nigeria |
Russia |
Japan |
|
|
|
France |
|
S.Africa |
Kenya |
Argentina |
|
S.Arabia |
|
Belgium |
|
Sweden |
|
|
|
|
|
|
|
|
|
|
|
|
|
|
|
|
|
||||||||
India |
|
Germany |
|
|
|
Australia |
|
|
Israel |
Hong |
|
Finland |
Sweden Canada UK Australia Germany |
Belgium Switzerland Spain Japan France Singapore US Taiwan |
Greece Portugal Italy |
Malaysia China Thailand Poland |
ArabiaSaudi |
AfricaSouth Brazil Russia Chile |
Turkey Kenya India |
Mexico Indonesia |
Philippines |
|||||||||||||||||||||||
China |
|
Indonesia Pakistan |
Bangladesh Mexico Philippines |
|
Thailand |
|
Italy |
S.Korea |
|
Canada |
Malaysia Netherlands |
|
Portugal |
|
Austria |
Switzerland |
|
Singapore |
Norway |
|||||||||||||||||||||||||
|
US |
|
|
|
|
|
Turkey |
|
|
|
|
Spain |
|
|
|
|
Greece |
|
UAE |
|
|
|
Denmark |
|
|
|
|
|
|
|
|
|
|
|
||||||||||
|
|
|
|
|
|
|
|
|
|
|
UK |
|
|
|
|
|
Poland |
|
|
|
|
|
|
|
|
|
|
|
Kong |
|
|
|
|
|
|
|
|
|
|
|
|
|||
Source: World Bank, Citi Research |
#Dark blue shading shows DMs, light blue EMs. |
|
Source: World Bank Global Findex 2014, Citi Research |
|
|
C.] Technology Enablers
Very Online Population - Adults in Brazil and South Africa are amongst the highest time spenders on the Internet, clocking an average of 5 hours per day. Russia and Turkey are lower with average time spend of 4 hours per day.
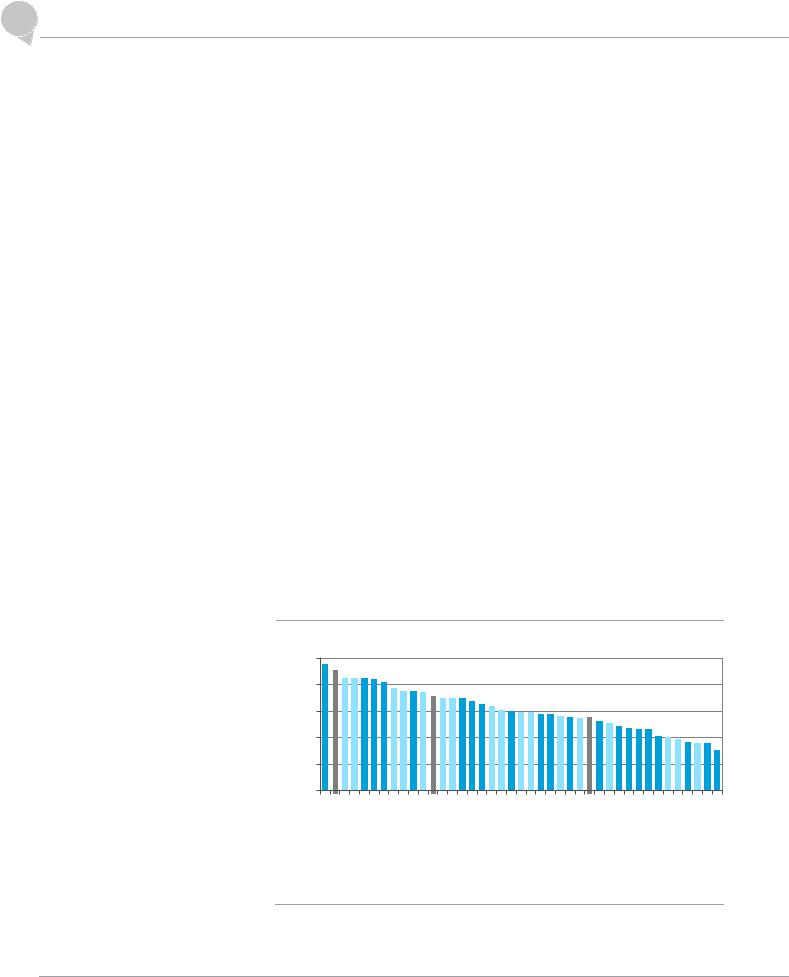
Rising Internet Penetration - Nearly 76% of individuals use the Internet in Russia – one of the highest rates in Central Europe and Asia. Brazil, Turkey, and South Africa fare moderately with 55-60% of their populations using the Internet. This presents a unique opportunity to maximize the benefits of the digital age. Over the last 5 years, Internet penetration rates across Russia and South Africa have risen as much as 60%, whilst those for Turkey and Brazil saw a 30%
increase.
Figure 105. Time Spent on the Internet (Hours Per Day, Jan 2017)
Hours per day |
|
Access through Laptop / Desktop |
|
||
6.0 |
|
Access through Mobile Device |
5.0 |
|
|
|
|
|
4.0 |
|
|
3.0 |
|
|
2.0 |
|
|
1.0 |
|
|
0.0
S.Korea
Japan
China
S.Arabia
Germany
Hong Kong
Spain
France
Australia
Turkey
UK
Italy
UAE
Canada
Poland
Russia
US
Singapore
Egypt
Argentina
Thailand
India
Mexico
Malaysia
Indonesia
S.Africa
Brazil
Philippines
Figure 106. Individuals Using the Internet (% of Population, 2016)
9795939292909089888786817976767473707069
61606058585654534845
302625 NorwayUKS.KoreaJapanSwedenCanadaGermanySwitze…AustraliaHong…FranceSingap…MalaysiaRussiaUSS.ArabiaPolandPortugalArgenti…GreeceItalyBrazilMexicoTurkeyColom…Philipp…S.AfricaChinaThailandPeruIndiaKenyaIndone…
* Based on a survey of Internet users aged 16-64, across 33 markets |
|
Source: Global Web Index |
Source: World Bank, Citi Research |
Modest Smartphone Penetration - While smartphone ownership rates continue to rise in developing nations, the digital divide remains. Amongst BRATs, Turkey has the highest smartphone adoption rate of 60%, followed by Russia, Brazil and South Africa.
Low Cash Dependence Relative to GDP per Capita - Comparing GDP per capita with cash penetration rates, we find that cash penetration in Brazil and South Africa is relatively lower (vs. size of GDP per capita) – a positive factor for FinTech adoption.
© 2018 Citigroup