

vk.com/id446425943
Evraz - BUY
Figure 63: Evraz, $mn (unless otherwise noted) |
|
|
|
|
|
Evraz |
EVRE.L / EVR LN |
|
|
||
Market capitalisation, GBPmn: |
|
6,717 |
|
|
|
Enterprise value, GBPmn: |
|
10,055 |
|
|
|
Dec-YE |
|
|
2018E |
2019E |
2020E |
2016 |
2017 |
||||
Income statement |
|
|
|
|
|
Revenue |
7,713 |
10,827 |
12,392 |
11,263 |
10,169 |
Underlying EBITDA |
1,542 |
2,624 |
4,045 |
3,581 |
2,616 |
Underlying EBIT |
1,021 |
2,063 |
3,451 |
2,919 |
1,910 |
Other items |
-629 |
-496 |
96 |
0 |
0 |
Equity accounted income |
-23 |
11 |
14 |
15 |
10 |
Net interest expense |
-461 |
-423 |
-367 |
-373 |
-372 |
Taxation |
-96 |
-396 |
-728 |
-512 |
-310 |
Profit after tax |
-188 |
759 |
2,466 |
2,049 |
1,238 |
Attributable profit |
-215 |
699 |
2,387 |
1,977 |
1,195 |
Basic EPS, USc |
-15 |
53 |
165 |
137 |
83 |
Thomson Reuters consensus EPS, USc |
|
|
143 |
111 |
92 |
DPS declared, USc |
0 |
60 |
116 |
118 |
52 |
Thomson Reuters consensus DPS, USc |
|
|
90 |
62 |
52 |
Underlying EBIT, $mn |
|
|
|
|
|
Coal - EBIT |
503 |
1,059 |
1,272 |
1,423 |
894 |
EBIT margin - Coal |
38% |
48% |
51% |
52% |
36% |
Russian & CIS steel - EBIT |
785 |
1,228 |
2,459 |
1,948 |
1,537 |
EBIT margin - Russian & CIS |
14% |
16% |
28% |
24% |
20% |
North American steel - EBIT |
-127 |
-74 |
-80 |
-164 |
-262 |
EBIT margin - North American steel |
-9% |
-4% |
-3% |
-8% |
-15% |
Other - EBIT |
-140 |
-150 |
-200 |
-288 |
-260 |
Total - EBIT |
1,021 |
2,063 |
3,451 |
2,919 |
1,910 |
EBIT margin |
13% |
19% |
28% |
26% |
19% |
Income statement ratios |
|
|
|
|
|
EBITDA margin |
20% |
24% |
33% |
32% |
26% |
EBIT margin |
13% |
19% |
28% |
26% |
19% |
EPS growth |
66% |
453% |
212% |
-17% |
-40% |
Dividend payout ratio |
0% |
113% |
70% |
87% |
62% |
Input assumptions (steel) |
|
|
|
|
|
Iron ore fines (62% Fe, CIF China), $/t |
58 |
71 |
66 |
65 |
64 |
Semi soft coking coal, $/t |
80 |
147 |
135 |
126 |
112 |
Hard coking coal, $/t |
144 |
188 |
200 |
190 |
167 |
Hot rolled coil - CIS, $/t |
382 |
502 |
569 |
514 |
492 |
RUB/$ |
67 |
58 |
61 |
65 |
64 |
Steel sales realisations, $/t |
517 |
698 |
834 |
744 |
673 |
EBITDA per tonne, $/t |
115 |
191 |
302 |
261 |
191 |
Capex/tonne, $ |
28 |
43 |
47 |
60 |
72 |
FCF/tonne, $ |
71 |
119 |
147 |
156 |
91 |
Sales volumes, kt |
|
|
|
|
|
Coal products |
9,867 |
10,499 |
10,982 |
12,447 |
14,900 |
Iron ore products |
4,222 |
2,937 |
2,026 |
2,024 |
2,024 |
Vanadium products |
20,428 |
22,319 |
18,609 |
19,650 |
19,788 |
Steel products |
|
|
|
|
|
Semi-finished products |
5,601 |
5,742 |
5,381 |
5,730 |
5,730 |
Construction products |
4,416 |
3,991 |
3,780 |
3,722 |
3,722 |
Railway products |
1,455 |
1,657 |
1,765 |
1,853 |
1,853 |
Flat-rolled products |
887 |
1,023 |
1,045 |
910 |
894 |
Tubular products |
534 |
749 |
838 |
968 |
968 |
Other |
571 |
602 |
594 |
557 |
557 |
Total |
13,464 |
13,764 |
13,404 |
13,739 |
13,723 |
Growth |
-7% |
2% |
-3% |
3% |
0% |
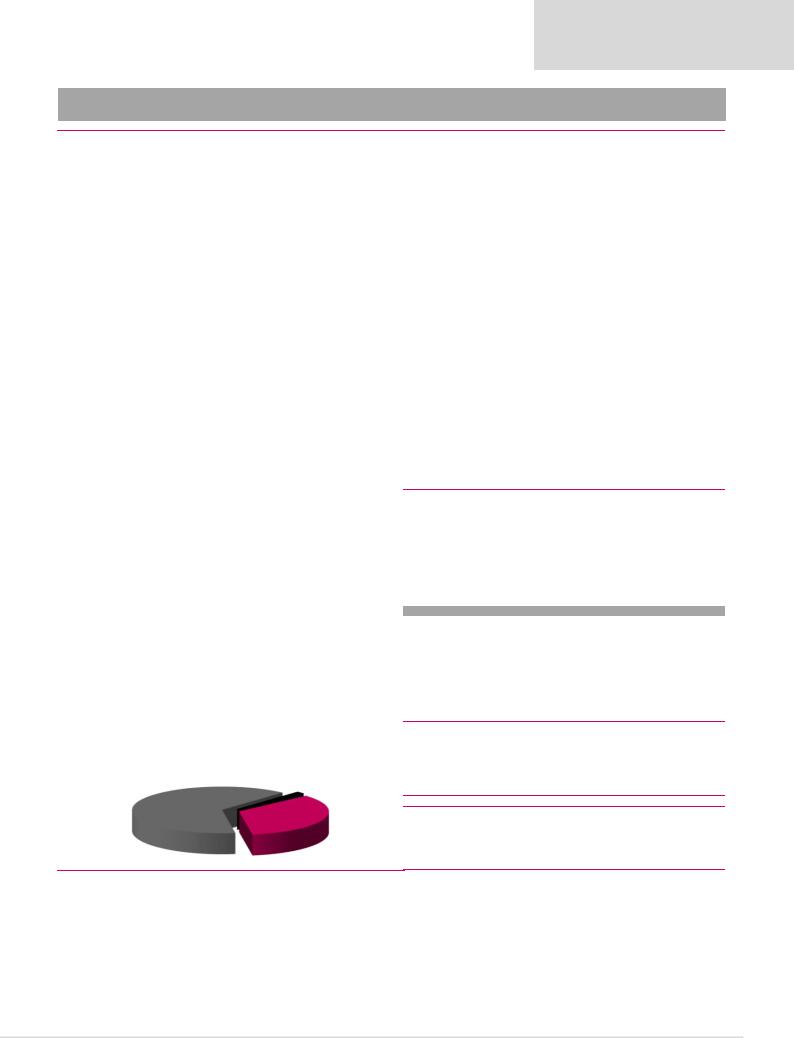
Contribution to FY18E underlying EBITDA
|
North American steel |
Russian & CIS |
2% |
steel… |
|
|
Coal |
|
34% |
*Gearing defined as net debt/(net debt +equity)
**Working capital days is defined as (working capital/revenue)*365
Renaissance Capital
3 December 2018
Steel
|
Target price, GBp: |
|
|
680 |
||
|
Last price, GBp: Potential |
|
464 |
|||
|
12-month return: |
|
|
70% |
||
Dec-YE |
|
|
|
2018E |
2019E |
2020E |
2016 |
2017 |
|
||||
Balance sheet |
|
|
|
|
|
|
Net operating assets |
5,521 |
6,054 |
|
6,459 |
6,672 |
6,969 |
Investments less provisions |
-107 |
-103 |
|
-130 |
-134 |
-140 |
Equity |
491 |
1,784 |
|
2,271 |
2,537 |
2,986 |
Minority interest BS |
186 |
242 |
|
284 |
320 |
342 |
Net debt (cash) |
4,737 |
3,925 |
|
3,774 |
3,681 |
3,502 |
Balance sheet ratios |
|
|
|
|
|
|
Gearing* |
91% |
69% |
|
62% |
59% |
54% |
Net debt to EBITDA |
3.07x |
1.50x |
|
0.93x |
1.03x |
1.34x |
RoCE |
18% |
35% |
|
54% |
43% |
27% |
RoIC (after tax) |
13% |
23% |
|
37% |
29% |
18% |
RoE |
-69% |
61% |
|
118% |
82% |
43% |
Cash flow statement |
|
|
|
|
|
|
Operating cash flow |
1,222 |
2,024 |
|
2,780 |
2,972 |
2,238 |
Capex |
-382 |
-595 |
|
-629 |
-829 |
-985 |
Other - CF |
111 |
214 |
|
-175 |
-5 |
-9 |
FCF |
951 |
1,643 |
|
1,976 |
2,138 |
1,244 |
Equity shareholders' cash |
582 |
1,305 |
|
1,659 |
1,803 |
925 |
Dividends and share buy backs |
-35 |
-469 |
|
-1,524 |
-1,710 |
-747 |
Advances (repayments) of debt |
-765 |
-527 |
|
-646 |
0 |
0 |
Increase (decrease) in cash |
-218 |
309 |
|
-510 |
93 |
179 |
Cash flow ratios |
|
|
|
|
|
|
Capex/EBITDA |
25% |
23% |
|
16% |
23% |
38% |
FCF yield |
12.5% |
18.7% |
|
16.7% |
17.0% |
10.0% |
Cash conversion ratio |
-2.7x |
1.9x |
|
0.7x |
0.9x |
0.8x |
Equity shareholders' yield |
21.8% |
28.2% |
|
21.4% |
21.0% |
10.8% |
Working capital days** |
7 |
11 |
|
27 |
27 |
26 |
Valuation |
|
|
|
|
|
|
Calculation of target price (TP) |
|
|
|
|
$mn |
GBp/share |
Coal |
|
|
|
|
7,370 |
384 |
Russian & CIS steel |
|
|
|
|
12,885 |
671 |
North American steel |
|
|
|
|
-602 |
-31 |
Other |
|
|
|
|
-2,326 |
-121 |
Enterprise value |
|
|
|
|
17,327 |
902 |
Investments less provisions |
|
|
|
|
-103 |
-5 |
Net debt as at 31 December 2017 |
|
|
|
|
-3,925 |
-204 |
Minority interest as at 31 December 2017 |
|
|
|
|
-242 |
-13 |
Equity value |
|
|
|
|
13,057 |
680 |
Plus: one-year forward equity shareholders' cash |
|
|
|
|
1 |
|
Less: dividends paid |
|
|
|
|
|
-1 |
Rounded to |
|
|
|
|
|
680 |
Share price on 29/11/2018 |
|
|
|
|
|
464 |
Expected share price return |
|
|
|
|
|
46% |
Plus: expected dividend yield |
|
|
|
|
|
23% |
Total implied one-year return |
|
|
|
|
|
70% |
Share price range, GBp: |
|
|
|
|
|
|
12-month high on 4-10-2018 |
590 |
12-month low on 4-12-2017 |
280 |
|||
Price move since high |
-21.3% |
Price move since low |
|
65.6% |
||
Calculation of discount rate |
|
Cost of debt |
|
|
5.0% |
|
WACC |
11.3% |
|
|
|||
Risk-free rate |
4.0% |
Tax rate |
|
|
20% |
|
Equity risk premium |
7.0% |
After-tax cost of debt |
|
0.8% |
||
Beta |
1.30 |
Debt weighting |
|
20% |
||
Cost of equity |
13.1% |
Terminal growth rate |
|
3.0% |
||
Valuation ratios |
|
|
|
|
|
|
Dec-YE |
|
|
|
2018E |
2019E |
2020E |
2016 |
2017 |
|
||||
P/E multiple |
-12.6x |
6.1x |
|
3.3x |
4.3x |
7.2x |
Dividend yield |
0.0% |
18.5% |
|
21.5% |
20.0% |
8.7% |
EV/EBITDA |
4.9x |
3.4x |
|
2.9x |
3.5x |
4.7x |
P/B |
5.4x |
2.6x |
|
3.4x |
3.4x |
2.9x |
NAV per share, $ |
0.35 |
1.25 |
|
1.58 |
1.76 |
2.07 |
Source: Bloomberg, Thomson Reuters, Company data, Renaissance Capital estimates
37

vk.com/id446425943
MMK - BUY
Renaissance Capital
3 December 2018
Steel
Figure 64: MMK, $mn (unless otherwise noted) |
|
|
|
|
||
Magnitogorsk Iron & Steel Works (MMK) |
MAGNq.L / MAGN.MM |
|
|
|||
Market capitalisation, $mn: |
|
7,666 |
|
|
|
|
Enterprise value, $mn: |
|
7,670 |
|
|
|
|
Dec-YE |
|
|
|
2018E |
2019E |
2020E |
|
2016 |
2017 |
||||
Income statement |
|
|
|
|
|
|
Revenue |
|
5,630 |
7,546 |
8,249 |
7,621 |
7,508 |
Underlying EBITDA |
1,956 |
2,032 |
2,456 |
1,888 |
1,767 |
|
Underlying EBIT |
1,477 |
1,488 |
1,904 |
1,336 |
1,202 |
|
Other items |
|
-32 |
36 |
-73 |
0 |
0 |
Equity accounted income |
1 |
5 |
2 |
7 |
6 |
|
Net interest |
|
-104 |
-34 |
-15 |
-14 |
-26 |
Taxation |
|
-231 |
-306 |
-404 |
-296 |
-263 |
Profit after tax |
1,111 |
1,189 |
1,414 |
1,032 |
919 |
|
Basic EPS, $/GDR |
1.29 |
1.38 |
1.65 |
1.21 |
1.07 |
|
Thomson Reuters consensus EPS, $ |
|
|
1.61 |
1.28 |
1.21 |
|
DPS declared, $/GDR |
0.21 |
0.72 |
1.32 |
1.03 |
0.79 |
|
Thomson Reuters consensus DPS, $ |
|
|
1.25 |
1.10 |
1.00 |
|
Underlying EBIT, $mn |
|
|
|
|
|
|
Coal segment |
EBIT |
49 |
77 |
120 |
140 |
101 |
EBIT margin |
Coal segment |
25% |
24% |
34% |
40% |
32% |
Russian steel |
EBIT |
1,451 |
1,431 |
1,832 |
1,263 |
1,180 |
EBIT margin |
Russian steel |
27% |
20% |
23% |
17% |
16% |
Turkey steel |
EBIT |
-21 |
-11 |
-50 |
-63 |
-74 |
EBIT margin |
Turkey steel |
-4% |
-2% |
-9% |
-14% |
-17% |
Other - EBIT |
|
-2 |
-9 |
3 |
-5 |
-5 |
EBIT margin - Other |
0% |
1% |
0% |
1% |
1% |
|
Total - EBIT |
|
1,477 |
1,488 |
1,904 |
1,336 |
1,202 |
EBIT margin |
|
26% |
20% |
23% |
18% |
16% |
Income statement ratios |
|
|
|
|
|
|
EBITDA margin |
35% |
27% |
30% |
25% |
24% |
|
EBIT margin |
|
26% |
20% |
23% |
18% |
16% |
EPS growth |
|
161% |
7% |
20% |
-27% |
-11% |
Dividend payout ratio |
16% |
53% |
80% |
85% |
73% |
|
Input assumptions (steel) |
|
|
|
|
|
|
Iron ore fines (62% Fe, CIF China), $/t |
58 |
71 |
66 |
65 |
64 |
|
Hard coking coal, $/t |
144 |
188 |
200 |
190 |
167 |
|
Hot rolled coil - CIS, $/t |
382 |
502 |
569 |
514 |
492 |
|
RUB/$ |
|
67 |
58 |
62 |
65 |
64 |
$/EUR |
|
1.11 |
1.13 |
1.18 |
1.18 |
1.22 |
Steel sales realisations, $/t |
462 |
615 |
676 |
611 |
602 |
|
EBITDA per tonne, $/t |
161 |
166 |
201 |
151 |
142 |
|
Capex/tonne, $ |
-38 |
-54 |
-68 |
-68 |
-68 |
|
FCF/tonne, $ |
|
127 |
57 |
97 |
75 |
57 |
Sales volumes, kt |
|
|
|
|
|
|
Slabs and billets |
104 |
4 |
0 |
0 |
0 |
|
Long products |
|
1,730 |
1,787 |
1,828 |
1,893 |
1,893 |
Flat & plate products |
7,730 |
7,699 |
7,548 |
7,856 |
7,856 |
|
Downstream products |
2,616 |
2,770 |
2,819 |
2,718 |
2,718 |
|
Total sales |
|
12,180 |
12,260 |
12,195 |
12,467 |
12,467 |
Volume growth |
3% |
1% |
-1% |
2% |
0% |
|
Contribution to FY18E underlying EBITDA
Russian steel 94%
Coal segment 6%
*Gearing defined as net debt/(net debt +equity)
**Working capital days is defined as (working capital/revenue)*365
|
Target price, $: |
|
|
10.2 |
||
|
Last price, $: |
|
|
8.9 |
||
|
Potential 12-month return: |
|
27% |
|||
Dec-YE |
|
|
|
2018E |
2019E |
2020E |
2016 |
2017 |
|
||||
Balance sheet |
|
|
|
|
|
|
Net operating assets |
5,356 |
6,188 |
|
5,755 |
5,916 |
6,195 |
Investments less provisions |
53 |
11 |
|
9 |
10 |
10 |
Equity |
4,694 |
5,691 |
|
5,707 |
5,467 |
5,715 |
Minority interest - BS |
18 |
27 |
|
24 |
29 |
33 |
Net debt (cash) |
234 |
-12 |
|
-406 |
-43 |
-49 |
Balance sheet ratios |
|
|
|
|
|
|
Gearing* |
5% |
0% |
|
-8% |
-1% |
-1% |
Net debt to EBITDA |
0.12x |
-0.01x |
|
-0.17x |
-0.02x |
-0.03x |
RoCE |
30% |
26% |
|
32% |
23% |
20% |
RoIC (after tax) |
27% |
20% |
|
26% |
19% |
16% |
RoE |
28% |
23% |
|
25% |
19% |
17% |
Cash flow statement |
|
|
|
|
|
|
Operating cash flow |
1,644 |
1,439 |
|
2,171 |
1,765 |
1,549 |
Capex |
-463 |
-664 |
|
-830 |
-850 |
-850 |
Other - CF |
365 |
-82 |
|
-152 |
16 |
15 |
FCF |
1,546 |
693 |
|
1,189 |
931 |
713 |
Equity shareholders' cash |
1,424 |
652 |
|
1,170 |
914 |
682 |
Dividends and share buy backs |
-180 |
-406 |
|
-776 |
-1,277 |
-676 |
Advances (repayments) of debt |
-1,347 |
44 |
|
-202 |
355 |
-0 |
Increase (decrease) in cash |
-103 |
290 |
|
191 |
-9 |
6 |
Cash flow ratios |
|
|
|
|
|
|
Capex/EBITDA |
24% |
33% |
|
34% |
45% |
48% |
FCF yield |
33% |
9% |
|
16% |
12% |
9% |
Cash conversion ratio |
1.3x |
0.6x |
|
0.8x |
0.9x |
0.7x |
Equity shareholders' yield |
32% |
9% |
|
15% |
12% |
9% |
Working capital days** |
59 |
57 |
|
49 |
46 |
47 |
Valuation |
|
|
|
|
|
|
Calculation of target price (TP) |
|
|
|
|
$mn |
$/GDR |
Coal segment |
|
|
|
|
657 |
0.8 |
Russian steel |
|
|
|
|
8,751 |
10.2 |
Turkey steel |
|
|
|
|
-159 |
-0.2 |
Other |
|
|
|
|
-481 |
-0.6 |
Enterprise value |
|
|
|
|
8,769 |
10.2 |
Investments |
|
|
|
|
11 |
0.0 |
Net cash (debt) as at 31 December 2017 |
|
|
|
|
12 |
0.0 |
Minority interest as at 31 December 2017 |
|
|
|
|
-27 |
0.0 |
Equity value |
|
|
|
|
8,765 |
10.2 |
Plus: one-year forward equity shareholders' cash |
|
|
|
|
1.1 |
|
Less: dividends paid |
|
|
|
|
|
-1.1 |
Rounded to |
|
|
|
|
|
10.2 |
Share price on 29-11-2018 |
|
|
|
|
|
8.9 |
Expected share price return |
|
|
|
|
|
15.0% |
Plus: expected dividend yield |
|
|
|
|
|
11.8% |
Total implied one-year return |
|
|
|
|
|
26.8% |
Share price range, $: |
|
|
|
|
|
|
12-month high on 27-2-2018 |
11.12 12-month low on 14-8-2018 |
8.53 |
||||
Price move since high |
-20.0% |
Price move since low |
|
4.3% |
||
Calculation of discount rate |
|
Cost of debt |
|
|
4.0% |
|
WACC |
11.4% |
|
|
|||
Risk-free rate |
4.0% |
Tax rate |
|
|
20% |
|
Equity risk premium |
7.1% |
After-tax cost of debt |
|
11.4% |
||
Beta |
1.30 |
Debt weighting |
|
20% |
||
Cost of equity |
13.2% |
Terminal growth rate |
|
2.0% |
||
Valuation ratios |
|
|
|
|
|
|
Dec-YE, $mn |
2016 |
2017 |
|
2018E |
2019E |
2020E |
PE multiple |
4.0x |
6.2x |
|
5.4x |
7.4x |
8.3x |
Dividend yield |
4% |
9% |
|
15% |
12% |
9% |
EV/EBITDA |
2.4x |
3.6x |
|
3.0x |
4.0x |
4.3x |
P/B |
0.9x |
1.3x |
|
1.3x |
1.4x |
1.3x |
NAV per share, $ |
5.5 |
6.6 |
|
6.6 |
6.4 |
6.6 |
Source: Bloomberg, Thomson Reuters, Company data, Renaissance Capital estimates
38

vk.com/id446425943
NLMK - BUY
Renaissance Capital
3 December 2018
Steel
Figure 65: NLMK, $mn (unless otherwise noted) |
|
|
|
|
||
Novolipetsk Steel (NLMK) |
NLMKq.L / NLMK.MM |
|
|
|||
Market capitalisation, $mn: |
|
14,387 |
|
|
|
|
Enterprise value, $mn: |
|
15,062 |
|
|
|
|
Dec-YE |
|
|
|
2018E |
2019E |
2020E |
|
2016 |
2017 |
||||
Income statement |
|
|
|
|
|
|
Revenue |
|
7,636 |
10,065 |
12,134 |
11,302 |
10,676 |
Underlying EBITDA |
1,941 |
2,655 |
3,705 |
3,114 |
2,690 |
|
Underlying EBIT |
1,485 |
2,031 |
3,116 |
2,524 |
2,050 |
|
Other items |
|
-185 |
-60 |
-57 |
0 |
0 |
Equity accounted income |
-61 |
-90 |
-79 |
-57 |
-57 |
|
Net interest |
|
-66 |
-58 |
-53 |
-63 |
-68 |
Taxation |
|
-233 |
-371 |
-567 |
-492 |
-396 |
Minority interest |
4 |
2 |
-4 |
2 |
1 |
|
Attributable profit |
943 |
1,454 |
2,355 |
1,914 |
1,530 |
|
Underlying earnings |
1,089 |
1,455 |
2,334 |
1,914 |
1,530 |
|
Underlying EPS, $/GDR |
1.82 |
2.43 |
3.90 |
3.19 |
2.55 |
|
Thomson Reuters consensus EPS, $ |
|
|
3.67 |
2.82 |
2.59 |
|
DPS declared, $/GDR |
1.53 |
2.38 |
3.60 |
3.27 |
2.67 |
|
Thomson Reuters consensus DPS, $ |
|
|
3.31 |
2.71 |
2.39 |
|
Underlying EBIT, $mn |
|
|
|
|
|
|
Mining - EBIT |
|
275 |
524 |
828 |
749 |
710 |
EBIT margin |
Mining |
46% |
56% |
65% |
63% |
61% |
Flat - EBIT |
|
1,051 |
1,357 |
1,985 |
1,552 |
1,293 |
EBIT margin |
Flat |
19% |
18% |
23% |
20% |
17% |
Long |
|
91 |
77 |
219 |
163 |
99 |
EBIT margin |
Long |
7% |
4% |
10% |
7% |
5% |
NLMK USA |
|
117 |
139 |
242 |
160 |
42 |
EBIT margin |
USA |
10% |
8% |
11% |
8% |
3% |
Dansteel |
|
-7 |
-6 |
-24 |
-30 |
-29 |
EBIT margin |
Dansteel |
-2% |
-1% |
-5% |
-6% |
-6% |
Other EBIT |
|
-42 |
-60 |
-134 |
-69 |
-66 |
EBIT margin |
Other |
2% |
2% |
3% |
2% |
2% |
Total EBIT |
|
1,485 |
2,031 |
3,116 |
2,524 |
2,050 |
EBIT margin |
|
19% |
20% |
26% |
22% |
19% |
Income statement ratios |
|
|
|
|
|
|
EBITDA margin |
25% |
26% |
31% |
28% |
25% |
|
EBIT margin |
|
19% |
20% |
26% |
22% |
19% |
EPS growth |
|
-3% |
54% |
62% |
-19% |
-20% |
Dividend payout ratio |
97% |
98% |
92% |
102% |
105% |
|
Input assumptions (steel) |
|
|
|
|
|
|
Iron ore fines (62% Fe, CIF China), $/t |
58 |
71 |
66 |
65 |
64 |
|
Hard coking coal, $/t |
144 |
188 |
200 |
190 |
167 |
|
Hot rolled coil - CIS, $/t |
382 |
502 |
569 |
514 |
492 |
|
Cold rolled coil - CIS, $/t |
434 |
559 |
636 |
619 |
600 |
|
RUB/$ |
|
67 |
58 |
62 |
65 |
64 |
$/EUR |
|
1.11 |
1.13 |
1.18 |
1.18 |
1.22 |
Steel sales realisations, $/t |
479 |
610 |
706 |
646 |
611 |
|
EBITDA per tonne, $/t |
122 |
161 |
215 |
178 |
154 |
|
Capex/tonne, $ |
35 |
37 |
38 |
40 |
40 |
|
FCF/tonne, $ |
|
65 |
71 |
115 |
115 |
96 |
Utilisation rate |
|
96% |
98% |
101% |
100% |
100% |
Sales volumes, kt |
|
|
|
|
|
|
Pig iron |
|
365 |
429 |
762 |
645 |
645 |
Slab Volumes |
2,697 |
2,605 |
2,440 |
2,250 |
2,250 |
|
Billets Volumes |
612 |
686 |
739 |
674 |
674 |
|
Flat Volumes |
10,065 |
10,501 |
10,735 |
10,937 |
10,937 |
|
Long Volumes |
2,196 |
2,277 |
2,520 |
2,981 |
2,981 |
|
Total sales |
|
15,935 |
16,498 |
17,197 |
17,486 |
17,486 |
Contribution to FY18E underlying EBITDA |
|
|
Flat |
Long |
|
60% |
||
7% |
||
|
||
|
USA |
|
|
8% |
|
|
Mining |
|
|
25% |
*Gearing defined as net debt/(net debt +equity)
**Working capital days is defined as (working capital/revenue)*365
|
Target price, $: |
|
|
27.8 |
||
|
Last price, $: |
|
|
24.0 |
||
|
Potential 12-month return: |
|
29.8% |
|||
Dec-YE |
|
|
|
2018E |
2019E |
2020E |
2016 |
2017 |
|
||||
Balance sheet |
|
|
|
|
|
|
Net operating assets |
7,177 |
7,858 |
|
7,424 |
7,376 |
7,282 |
Investments |
255 |
248 |
|
284 |
290 |
293 |
Equity |
6,653 |
7,166 |
|
6,737 |
6,565 |
6,428 |
Minority interest - BS |
18 |
17 |
|
14 |
11 |
8 |
Net debt (cash) |
761 |
923 |
|
957 |
1,090 |
1,138 |
Balance sheet ratios |
|
|
|
|
|
|
Gearing* |
10% |
11% |
|
12% |
14% |
15% |
Net debt to EBITDA |
0.39x |
0.35x |
|
0.26x |
0.35x |
0.42x |
RoCE |
21% |
26% |
|
39% |
33% |
27% |
RoIC (after tax) |
19% |
23% |
|
33% |
27% |
23% |
RoE |
14% |
20% |
|
35% |
29% |
24% |
Cash flow statement |
|
|
|
|
|
|
Operating cash flow |
1,674 |
1,860 |
|
2,844 |
2,711 |
2,377 |
Capex |
-559 |
-603 |
|
-650 |
-700 |
-700 |
Other - CF |
-86 |
-87 |
|
-218 |
-6 |
-3 |
FCF |
1,030 |
1,170 |
|
1,976 |
2,005 |
1,674 |
Equity shareholders' cash |
979 |
1,122 |
|
1,930 |
1,953 |
1,619 |
Dividends and share buy backs |
-579 |
-1,284 |
|
-1,965 |
-2,086 |
-1,667 |
Advances (repayments) of debt |
-407 |
12 |
|
-464 |
605 |
2 |
Increase (decrease) in cash |
-7 |
-150 |
|
-498 |
472 |
-46 |
Cash flow ratios |
|
|
|
|
|
|
Capex/EBITDA |
29% |
23% |
|
18% |
22% |
26% |
FCF yield |
11.8% |
8.7% |
|
12.9% |
12.9% |
10.8% |
Cash conversion ratio |
1.0x |
0.8x |
|
0.8x |
1.0x |
1.1x |
Equity shareholders' yield |
12.3% |
9.0% |
|
13.4% |
13.6% |
11.3% |
Working capital days** |
77 |
75 |
|
69 |
70 |
71 |
Valuation |
|
|
|
|
|
|
Calculation of target price (TP) |
|
|
|
|
$mn |
$/share |
Mining |
|
|
|
|
6,014 |
10.0 |
Flat |
|
|
|
|
10,778 |
18.0 |
Long |
|
|
|
|
1,166 |
1.9 |
USA |
|
|
|
|
842 |
1.4 |
Dansteel |
|
|
|
|
-306 |
-0.5 |
Other |
|
|
|
|
-1,090 |
-1.8 |
Enterprise value |
|
|
|
|
17,404 |
29.0 |
Financial instruments as at 31 December 2017 |
|
|
|
248 |
0.4 |
|
Net debt as at 31 December 2017 |
|
|
|
|
-923 |
-1.5 |
Equity value |
|
|
|
|
16,729 |
27.9 |
Plus: one-year forward equity shareholders' cash |
|
|
|
|
3.3 |
|
Less: dividends paid |
|
|
|
|
|
-3.3 |
Rounded to |
|
|
|
|
|
27.8 |
Share price on 29/11/2018 |
|
|
|
|
|
24.00 |
Expected share price return |
|
|
|
|
|
16.0% |
Plus: expected dividend yield |
|
|
|
|
|
13.7% |
Total implied one-year return |
|
|
|
|
|
29.8% |
Share price range, $ |
|
|
|
|
|
|
12-month high on 6-6-2018 |
28.03 |
12-month low on 17-3-2017 |
21.94 |
|||
Price move since high |
-14.4% |
Price move since low |
|
9.4% |
||
Calculation of discount rate |
|
Cost of debt |
|
|
4.0% |
|
WACC |
11.4% |
|
|
|||
Risk-free rate |
4.0% |
Tax rate |
|
|
20% |
|
Equity risk premium |
7.1% |
After-tax cost of debt |
|
0.8% |
||
Beta |
1.30 |
Debt weighting |
|
20% |
||
Cost of equity |
13.2% |
Terminal growth rate |
|
2.0% |
||
Valuation ratios |
|
|
|
|
|
|
Dec-YE |
|
|
|
2018E |
2019E |
2020E |
2016 |
2017 |
|
||||
P/E multiple |
7.3x |
8.6x |
|
6.2x |
7.5x |
9.4x |
Dividend yield |
11.6% |
11.5% |
|
15.0% |
13.6% |
11.1% |
EV/EBITDA |
4.5x |
5.0x |
|
4.1x |
5.0x |
5.8x |
P/B |
1.2x |
1.7x |
|
2.1x |
2.2x |
2.2x |
NAV per share, $ |
1.11 |
1.20 |
|
1.12 |
1.10 |
1.07 |
Source: Bloomberg, Thomson Reuters, Company data, Renaissance Capital estimates
39