


vk.com/id446425943
Steel sector margins and capex support near-term cash generation
Normalised steel margins per tonne assumptions…
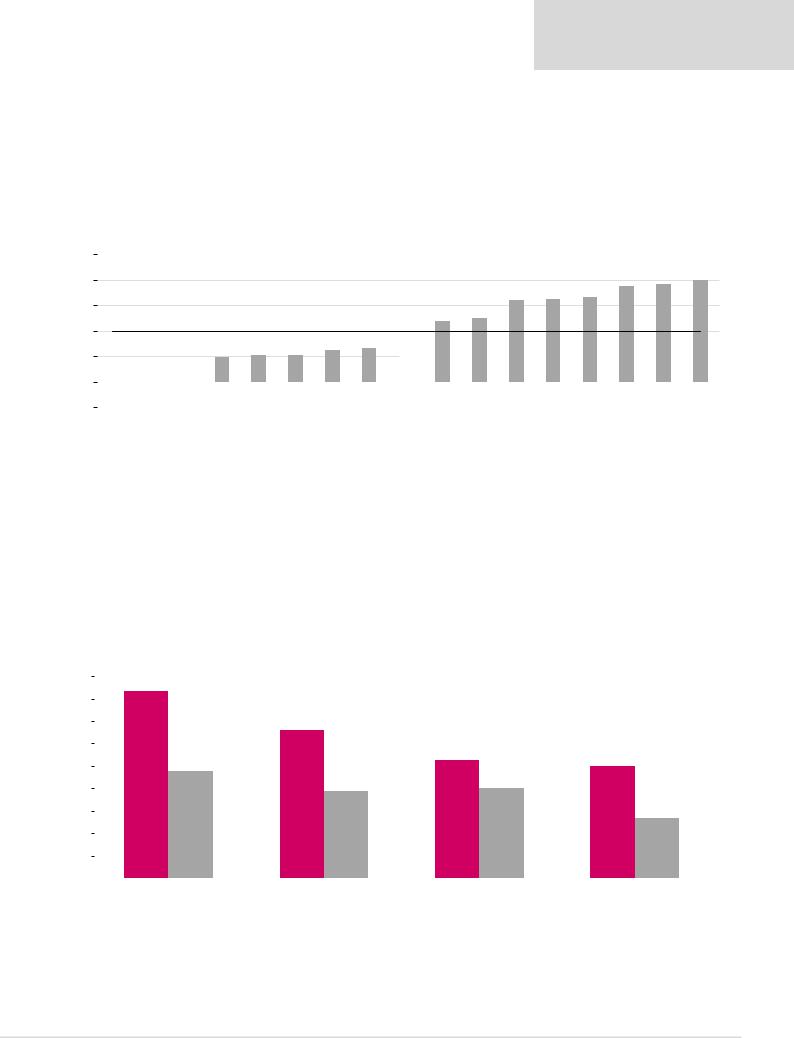
We calculate steel margins based on Bloomberg average sector consumption ratios. We forecast margins falling closer to historical averages.
Renaissance Capital
3 December 2018
Steel
Figure 46: Real steel-making replacement cost margins and near-term forecasts
|
|
|
|
|
|
|
|
|
|
|
Steel replacement cost margin |
|
|
|
|
|
|
Average |
|
|
|
|
|
|
|
|
|
|
|
|
|
|
|
|
|
|
|
|
|
|
|
|
|
|
|
|
|
Forecasts |
|
|
|
|
|
Mar-06 |
Aug-06 |
Jan-07 |
Jun-07 |
Nov-07 |
Apr-08 |
Sep-08 |
Feb-09 |
Jul-09 |
Dec-09 |
May-10 |
Oct-10 Mar-11 Aug-11 Jan-12 Jun-12 Nov-12 Apr-13 Sep-13 |
Feb-14 |
Jul-14 |
Dec-14 |
May-15 |
Oct-15 |
Mar-16 |
Aug-16 Jan-17 Jun-17 |
Nov-17 |
Apr-18 |
Sep-18 Feb-19 Jul-19 |
Dec-19 |
May-20 |
Oct-20 |
Mar-21 |
Aug-21 |
Source: Bloomberg, Renaissance Capital estimates
…result in attractive EBITDA per tonne
Our normalised steel margins result in what we believe are attractive EBITDA per tonne levels that are above historical averages.
Figure 47: Steel company EBITDA per tonne, $ (2018E real)
|
|
|
|
|
|
EBITDA per tonne, $/t |
Average |
|
|
|
|
||
180 |
|
|
|
|
|
|
|
|
|
|
|
|
|
|
|
|
|
|
|
|
|
|
|
165 |
|
|
|
160 |
|
|
|
|
|
|
|
|
|
|
|
|
|
|
|
141 |
|
|
|
|
|
|
|
|
|
|
|
140 |
|
|
|
|
|
|
|
|
|
|
|
|
|
|
|
|
|
|
|
|
|
|
|
|
124 |
|
|
120 |
117 |
|
|
|
|
116 |
|
|
113 |
|
|
|
|
|
|
110 |
|
|
|
|
|
|
|
|
|
||
|
Average, 107 |
|
|
|
|
|
|
|
|
106 |
106 |
||
|
|
|
|
|
|
101 |
|
|
|
||||
|
|
|
|
|
|
|
|
|
|
|
|
|
|
100 |
|
|
|
|
|
|
92 |
|
|
|
|
|
|
|
|
|
|
|
|
|
|
|
|
|
|
|
|
|
|
|
|
85 |
84 |
|
|
|
|
|
|
|
|
80 |
|
|
|
|
|
|
|
|
|
|
|
|
|
60 |
|
|
|
|
|
|
|
|
|
|
|
|
|
|
2009 |
2010 |
2011 |
2012 |
2013 |
2014 |
2015 |
2016 |
2017 |
2018E |
2019E |
2020E |
2021E |
Note: EBITDA margins per tonne above are for AMSA, Evraz, MMK, NLMK and Severstal. |
|
|
|
|
|
|
|
|
|||||
|
|
|
|
|
|
|
|
|
|
|
Source: Company data, Renaissance Capital estimates |
||
27

vk.com/id446425943
Renaissance Capital
3 December 2018
Steel
Near-term capex profile below historical levels…
Sector capex per tonne fell by 74% to $33/t in 2015, from a 2011 peak of $126/t. We believe that, with limited announced projects for the steel companies under coverage and a commitment to return cash to shareholders through dividends, capex should remain below historical average levels in the near term.
Figure 48: Steel peer group historical and forecast capex per steel tonne, $ |
|
|
|
|
|
|
|
||||||
|
|
|
|
|
|
Capex per tonne, $/t |
|
Average |
|
|
|
|
|
140 |
|
|
126 |
|
|
|
|
|
|
|
|
|
|
|
|
125 |
|
|
|
|
|
|
|
|
|
|
|
120 |
|
|
|
|
|
|
|
|
|
|
|
|
|
100 |
93 |
|
|
88 |
|
|
|
|
|
|
|
|
|
|
|
|
|
|
|
|
|
|
|
|
|
|
|
80 |
|
|
|
|
|
|
|
|
|
|
|
Average, 73 |
|
|
|
|
|
|
|
|
|
|
|
|
|
|
|
|
|
|
|
|
64 |
|
|
|
|
|
63 |
58 |
|
60 |
|
|
|
|
|
|
|
|
|
|
|
54 |
|
|
|
|
|
|
|
|
|
|
50 |
|
|
||
|
|
|
|
|
|
45 |
|
|
44 |
|
|
|
|
|
|
|
|
|
|
|
38 |
|
|
|
|
||
40 |
|
|
|
|
|
|
33 |
|
|
|
|
|
|
|
|
|
|
|
|
|
|
|
|
|
|
||
20 |
|
|
|
|
|
|
|
|
|
|
|
|
|
0 |
2009 |
2010 |
2011 |
2012 |
2013 |
2014 |
2015 |
2016 |
2017 |
2018E |
2019E |
2020E |
2021E |
|
|||||||||||||
|
|
|
|
|
|
|
|
|
|
|
Source: Company data, Renaissance Capital estimates |
||
…supporting near-term cash generation…
We calculate that AMSA, Evraz and MMK have the highest FY18E FCF yields of 20%- plus, 16.8% and 16.5%, respectively.
Figure 49: Steel companies’ 2018E FCF yields vs three-year average FCF yield forecasts |
|
|
|||||
25% |
|
|
2018E FCF yields |
|
Average FCF yields (2019E-2020E) |
|
|
|
|
|
|
||||
|
|
|
|
||||
|
|
|
|
|
|
|
|
20.0%+ |
|
|
|
|
|
|
|
|
|
|
|
|
|
|
|
20% |
|
|
|
|
|
|
|
16.8% |
|
|
16.5% |
16.0% |
|
||
|
|
|
|
||||
|
|
|
|
|
|||
|
|
|
|
|
|
|
|
15% |
13.6% |
|
|
13.4% |
12.5% |
||
|
|
|
|
|
|
||
|
|
|
|
|
|
|
|
|
|
|
|
10.9% |
|
|
|
10% |
|
|
|
|
|
|
|
|
|
|
|
|
7.5% |
|
|
|
|
|
|
|
|
|
|
|
5.6% |
|
|
|
|
|
|
5% |
|
|
|
|
|
|
|
|
|
|
|
|
|
|
|
0% |
|
|
|
|
|
|
|
|
|
|
|
|
|
|
|
AMSA |
Evraz |
MMK |
Severstal |
NLMK |
Note: FCF includes disposals and acquisitions over the period. |
|
|
|
|
|
|
|
|
Source: Thomson Reuters, Renaissance Capital estimates |
28
vk.com/id446425943
Renaissance Capital
3 December 2018
Steel
… and with balance sheets at comfortable levels…
The Russian steel producers have significantly deleveraged their balance sheets, largely driven by: 1) higher steel prices; 2) the depreciation of the rouble; and 3) disciplined capital allocation.
However, we believe under our cautious outlook for steel prices and any further US actions on Russia, steel producers with greater leverage are more exposed.
Figure 50: Steel peer group CY17 net debt/EBITDA
5x
4x
3x
2x
1x
0x
-1x
|
|
|
|
|
|
|
|
|
|
|
|
|
3.2x |
3.3x |
3.3x |
3.8x |
3.8x |
4.0x |
|
|
|
|
|
|
|
|
|
|
|
|
|
|
|
|
|||
|
Average, 2.0x |
|
|
|
|
|
1.3x |
1.5x |
2.4x |
2.5x |
|
|
|
|
|
|
||
|
|
|
|
|
|
|
|
|
|
|
|
|
|
|||||
|
|
0.3x |
0.4x |
1.0x |
1.0x |
1.1x |
1.2x |
|
|
|
|
|
|
|
|
|||
|
|
|
|
|
|
|
|
|
|
|
|
|
||||||
|
|
|
|
|
|
|
|
|
|
|
|
|
|
|
|
|||
|
|
|
|
|
|
|
|
|
|
|
|
|
|
|
|
|
|
|
|
|
|
|
|
|
|
|
|
|
|
|
|
|
|
|
|
|
|
0.0x |
|
|
|
|
|
|
|
|
|
|
|
|
|
|
|
|
|
|
|
|
|
|
|
|
|
|
|
|
|
|
|
|
|
|
|
|
|
MMK |
|
NLMK |
Severstal |
Steel Dynamics |
US Steel Corp. |
Nucor |
ArcelorMittal |
Posco |
Evraz |
ThyssenKrupp AG |
Gerdau |
JFE Holdings |
Kobe steel |
Hyundai Steel Co. |
AK Steel Holding |
NSSMC |
China Steel Corp. |
|
Source: Bloomberg, Company data
…could translate into attractive dividend potential
Evraz and Severstal offer the highest FY18E dividend yield potential at 21.7% and 18.3%, respectively, on our estimates.
Figure 51: Steel companies’ FY18E dividend yields vs three-year forecast dividend yields |
|
|||||
23% |
|
|
2018E dividend yields |
|
Average dividend yields (2019E-2020E) |
|
|
|
|
|
|||
|
|
|
|
|||
|
|
|
|
|
|
|
21.7% |
|
|
|
|
|
|
|
|
|
|
|
|
|
21% |
|
|
|
|
|
|
|
18.2% |
|
|
|
||
19% |
|
|
|
|
||
|
|
|
|
|
|
|
17% |
|
|
|
|
|
|
|
|
|
15.5% |
15.0% |
||
|
|
|
|
|||
|
14.5% |
|
|
|
|
|
15% |
|
|
|
|
|
|
|
12.8% |
13.1% |
|
|||
|
|
|
||||
13% |
|
|
|
|
||
|
|
|
|
|
|
|
|
|
|
|
|
10.3% |
|
11% |
|
|
|
|
|
|
|
|
|
|
|
|
|
9% |
|
|
|
|
|
|
|
|
|
|
|
|
|
7% |
|
|
|
|
|
|
|
|
|
|
|
|
|
5% |
|
|
|
|
|
|
Evraz |
|
Severstal |
|
NLMK |
MMK |
|
|
|
|
||||
Source: Thomson Reuters, Renaissance Capital estimates
29

vk.com/id446425943
Renaissance Capital
3 December 2018
Steel
100%+ market cap repayment over the next 10 years
We calculate that some steel companies could repay up to 100% of their market caps in dividends over the next 10 years, based on target gearing levels and assuming no further growth projects at value-destructive returns.
Figure 52: Cumulative 10-year dividends as a % of share price
200% |
|
|
|
|
|
|
|
|
|
|
|
|
|
|
|
|
|
|
|
|
|
|
|
|
|
|
|
|
|
|
|
|
|
|
|
|
|
|
|
|
|
|
|
|
|
|
|
|
|
|
|
|
|
|
|
|
|
|
|
184% |
|
|
|
|
|
|
|
|
|
|
|
|
|
|
|
|
|
|
|
|
|
|
|
|
|
|
|
|
|
|
|
|
|
|
|
|
|
|
|
|
|
|
|
|
|
|
|
|
|
|
|
|
|
|
|
|
|
|
|
|
|
|
|
|
|
|
|
|
|
|
|
|
|
|
|
|
|
|
|
|
|
|
|
|
|
|
|
|
|
|
|
|
|
|
|
|
|
|
|
|
|
|
|
|
|
|
|
|
|
|
|
|
|
|
|
|
180% |
|
|
|
|
|
|
|
|
|
|
|
|
|
|
|
|
|
|
|
|
|
|
|
|
|
|
|
|
|
|
|
|
|
|
|
|
|
|
|
|
|
|
|
|
|
|
|
|
|
|
|
|
|
|
|
|
|
|
|
157% 147% 139% 136% 133% 132% 132% 131% |
125% 121% 118% 118% 113% |
110% 109% |
107% 107% 103% 102% 101% 99% 98% 96% 93% 90% 90% 89% 89% 88% 88% 88% 86% 86% 84% 83% 81% 76% 75% 73% 69% 68% 67% 64% 62% 61% 60% 58% 58% 56% 54% 54% 54% 53% 52% 51% |
49% 47% 46% 46% 46% 46% 45% 42% 42% 41% 40% 39% 39% 38% 37% 36% 35% 35% 34% 33% 33% 28% 22% 22% 19% |
|||||||||||||||||||||||||||||||||||||||||||||||||||||
160% |
|
|||||||||||||||||||||||||||||||||||||||||||||||||||||||||
|
|
|
|
|
|
|
|
|
|
|
|
|
|
|
|
|
|
|
|
|
|
|
|
|
|
|
|
|
|
|
|
|
|
|
|
|
|
|
|
|
|
|
|
|
|
|
|
|
|
|
|
|
|
|
|
|
|
|
140% |
|
|
|
|
|
|
|
|
|
|
|
|
|
|
|
|
|
|
|
|
|
|
|
|
|
|
|
|
|
|
|
|
|
|
|
|
|
|
|
|
|
|
|
|
|
|
|
|
|
|
|
|
|
|
|
|
|
|
|
|
|
|
|
|
|
|
|
|
|
|
|
|
|
|
|
|
|
|
|
|
|
|
|
|
|
|
|
|
|
|
|
|
|
|
|
|
|
|
|
|
|
|
|
|
|
|
|
|
|
|
|
|
|
|
|
|
|
120% |
|
|
|
|
|
|
|
|
|
|
|
|
|
|
|
|
|
|
|
|
|
|
|
|
|
|
|
|
|
|
|
|
|
|
|
|
|
|
|
|
|
|
|
|
|
|
|
|
|
|
|
|
|
|
|
|
|
|
|
|
|
|
|
|
|
|
|
|
|
|
|
|
|
|
|
|
|
|
|
|
|
|
|
|
|
|
|
|
|
|
|
|
|
|
|
|
|
|
|
|
|
|
|
|
|
|
|
|
|
|
|
|
|
|
|
|
|
|
|
|
|
|
|
|
|
|
|
|
|
|
|
|
|
|
|
|
|
|
|
|
|
|
|
|
|
|
|
|
|
|
|
|
|
|
|
|
|
|
|
|
|
|
|
|
|
|
|
|
|
|
|
|
|
|
|
|
100% |
|
|
|
|
|
|
|
|
|
|
|
|
|
|
|
|
|
|
|
|
|
|
|
|
|
|
|
|
|
|
|
|
|
|
|
|
|
|
|
|
|
|
|
|
|
|
|
|
|
|
|
|
|
|
|
|
|
|
|
|
|
|
|
|
|
|
|
|
|
|
|
|
|
|
|
|
|
|
|
|
|
|
|
|
|
|
|
|
|
|
|
|
|
|
|
|
|
|
|
|
|
|
|
|
|
|
|
|
|
|
|
|
|
|
|
|
|
|
|
|
|
|
|
|
|
|
|
|
|
|
|
|
|
|
|
|
|
|
|
|
|
|
|
|
|
|
|
|
|
|
|
|
|
|
|
|
|
|
|
|
|
|
|
|
|
Average, 78.2% |
|
|
|
|
|
|||||
80% |
|
|
|
|
|
|
|
|
|
|
|
|
|
|
|
|
|
|
|
|
|
|
|
|
|
|
|
|
|
|
|
|
|
|
|
|
|
|
|
|
|
|
|
|
|
|
|
|
|
|
|
|
|
|||||
|
|
|
|
|
|
|
|
|
|
|
|
|
|
|
|
|
|
|
|
|
|
|
|
|
|
|
|
|
|
|
|
|
|
|
|
|
|
|
|
|
|
|
|
|
|
|
|
|
|
|
|
|
||||||
|
|
|
|
|
|
|
|
|
|
|
|
|
|
|
|
|
|
|
|
|
|
|
|
|
|
|
|
|
|
|
|
|
|
|
|
|
|
|
|
|
|
|
|
|
|
|
|
|
|
|
|
|
|
|
|
|
|
|
|
|
|
|
|
|
|
|
|
|
|
|
|
|
|
|
|
|
|
|
|
|
|
|
|
|
|
|
|
|
|
|
|
|
|
|
|
|
|
|
|
|
|
|
|
|
|
|
|
|
|
|
|
|
|
|
|
|
|
60% |
|
|
|
|
|
|
|
|
|
|
|
|
|
|
|
|
|
|
|
|
|
|
|
|
|
|
|
|
|
|
|
|
|
|
|
|
|
|
|
|
|
|
|
|
|
|
|
|
|
|
|
|
|
|
|
|
|
|
|
|
|
|
|
|
|
|
|
|
|
|
|
|
|
|
|
|
|
|
|
|
|
|
|
|
|
|
|
|
|
|
|
|
|
|
|
|
|
|
|
|
|
|
|
|
|
|
|
|
|
|
|
|
|
|
|
|
|
40% |
|
|
|
|
|
|
|
|
|
|
|
|
|
|
|
|
|
|
|
|
|
|
|
|
|
|
|
|
|
|
|
|
|
|
|
|
|
|
|
|
|
|
|
|
|
|
|
|
|
|
|
|
|
|
|
|
|
|
|
|
|
|
|
|
|
|
|
|
|
|
|
|
|
|
|
|
|
|
|
|
|
|
|
|
|
|
|
|
|
|
|
|
|
|
|
|
|
|
|
|
|
|
|
|
|
|
|
|
|
|
|
|
|
|
|
|
|
20% |
|
|
|
|
|
|
|
|
|
|
|
|
|
|
|
|
|
|
|
|
|
|
|
|
|
|
|
|
|
|
|
|
|
|
|
|
|
|
|
|
|
|
|
|
|
|
|
|
|
|
|
|
|
|
|
|
|
|
|
|
|
|
|
|
|
|
|
|
|
|
|
|
|
|
|
|
|
|
|
|
|
|
|
|
|
|
|
|
|
|
|
|
|
|
|
|
|
|
|
|
|
|
|
|
|
|
|
|
|
|
|
|
|
|
|
|
|
0% |
|
|
|
|
|
|
|
|
|
|
|
|
|
|
|
|
|
|
|
|
|
|
|
|
|
|
|
|
|
|
|
|
|
|
|
|
|
|
|
|
|
|
|
|
|
|
|
|
|
|
|
|
|
|
|
|
|
|
|
Impala |
|
Alrosa Evraz |
|
Anglo Polyus |
|
Norilsk |
|
South32 Assore |
|
|
Rio |
Tobacco |
|
AMSA |
|
|
Oil |
|
Amplats 2Bank Bank |
|
Retailer Bank Retailer Harmony Food |
Food Bank |
Private |
Healthcare Insurance |
|
Beverages HoldingInv. Retailer Retailer Food Bank |
Retailer |
|
2Tech |
||||||||||||||||||||||||||||
|
|
|
|
ARM |
|
|
Sasol |
|
NLMK |
|
Exxaro |
Fields |
|
|
Sappi |
|
|
Bank5 |
|
|
|
|
manager |
Property RBPlat |
2 |
|
Mondi Sibanye 1 5 1 |
2 |
|
1 |
|
|
Retailer goods |
Tech Retailer miner |
3 |
1 |
1 |
|
|
Tech |
|
|||||||||||||||||
|
|
|
|
|
|
Merafe Severstal |
|
Polymetal Glencore |
|
|
|
|
|
|
|
|
Tinto |
|
|
Kumba |
|
2 1 |
|
4 |
|
|
4 |
Motor |
8 1 4 |
|
|
|
6 |
|
|
|
|
|
|
|
|
|
|
|
|
|
||||||||||||
|
Fortescue |
2 |
|
|
|
AngloGold |
|
Gold |
|
MMK |
|
|
|
|
Property 1gas& |
|
Telecom |
2 |
|
equity |
2 |
|
3 |
3 |
1 6 2 |
|
|
10 |
Retailer |
|||||||||||||||||||||||||||||
|
Industrial |
|
|
|
|
Vale |
|
|
Property |
|
|
Oil |
Asset |
|
Property |
|
Telecom |
|
|
Industrial Retailer Construction |
Beverages AssurerLife |
|
|
Pharmaceutical |
|
Luxury |
|
Industrial |
Diversified |
Healthcare |
Healthcare AssurerLife Beverages |
|
||||||||||||||||||||||||||
|
|
|
|
|
|
|
|
|
|
|
|
|
|
|
|
|
|
|
5 |
|
|
|
|
gas |
1 |
2 |
|
|
1 |
|
|
|
|
2 |
|
|
|
|
3 |
3 9 |
|
|
|
|
1 |
1 |
|
|||||||||||
|
|
|
|
|
|
|
|
|
|
|
|
|
|
|
|
|
|
|
|
|
|
|
|
|
|
BHP |
|
|
|
|
|
|
|
|
|
|
|
|
|
|
|
|
|
|
|
|
|
|
|
|
|
3 |
|
|
2 |
|||
|
|
|
|
|
|
|
|
|
|
|
|
|
|
|
|
|
|
|
|
|
|
|
|
|
|
|
& |
|
|
|
|
|
|
|
|
|
|
|
|
|
|
|
|
|
|
|
|
|
|
|
|
|
|
|
|
|
|
|
Note: Priced at market close on 30 November 2018.
Source: Company data, Thomson Reuters, Renaissance Capital estimates
30