


vk.com/id446425943
2018 Wind Technologies Market Report
3 Industry Trends
GE and Vestas accounted for 78% of the U.S. wind power market in 2018
Of the 7,588 MW of wind installed in 2018, GE Wind supplied 40% (3,011 MW), with Vestas coming in second (2,886 MW, 38% market share), followed more distantly by Nordex (866 MW, 11% market share) and Siemens Gamesa Renewable Energy (SGRE, 630 MW, 8% market share) (Figure 9).14 Other suppliers included Goldwind (171 MW), Vensys (23 MW), and Emergya Wind Technologies (1 MW). GE and Vestas have dominated the U.S. market for some time, with SGRE and—more recently—Nordex vying for third.
|
100% |
|
|
|
|
|
|
|
|
|
|
|
|
|
by MW |
90% |
|
|
|
|
|
|
|
|
|
|
|
|
|
80% |
|
|
|
|
|
|
|
|
|
|
|
|
|
|
Share |
70% |
|
|
|
|
|
|
|
|
|
|
|
|
|
|
|
|
|
|
|
|
|
|
|
|
|
|
|
|
Market |
60% |
|
|
|
|
|
|
|
|
|
|
|
|
|
50% |
|
|
|
|
|
|
|
|
|
|
|
|
|
|
|
|
|
|
|
|
|
|
|
|
|
|
|
|
|
U.S. |
40% |
|
|
|
|
|
|
|
|
|
|
|
|
|
|
|
|
# of OEMs (right scale) |
|
|
|
|
|
|
|||||
OEM |
30% |
|
|
|
|
|
|
|
|
|||||
|
|
|
|
|
|
|
|
|
|
|
|
|
||
20% |
|
|
|
|
|
|
|
|
|
|
|
|
|
|
Turbine |
|
|
|
|
|
|
|
|
|
|
|
|
|
|
10% |
|
|
|
|
|
|
|
|
|
|
|
|
|
|
|
|
|
|
|
|
|
|
|
|
|
|
|
|
|
|
0% |
|
|
|
|
|
|
|
|
|
|
|
|
|
|
2005 |
2006 |
2007 |
2008 |
2009 |
2010 |
2011 |
2012 |
2013 |
2014 |
2015 |
2016 |
2017 |
2018 |
Source: AWEA WindIQ
20
18
14ofYearly |
|
16 |
|
12 |
>1% |
8 |
Serving |
10 |
OEMsof |
4 |
|
6 |
|
2 |
# |
|
|
0 |
|
 Other
Other
 Goldwind
 Acciona (pre-2016)
 Nordex (pre-2016)
 Nordex Acciona
 Gamesa (pre-2017)
 Siemens (pre-2017)
 Siemens Gamesa
 GE Wind
 Vestas
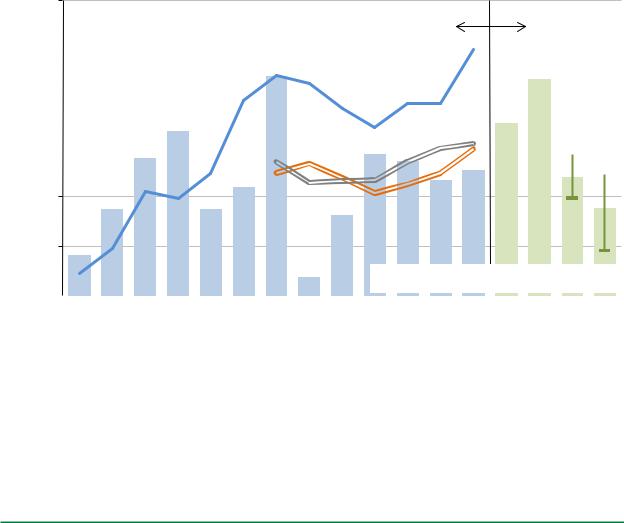
Figure 9. Annual U.S. market share of wind turbine manufacturers by MW, 2005–2018
The black line in Figure 9 shows the number of turbine manufacturers serving more than 1% (by capacity) of the U.S. market in each year. As shown, the base of turbine suppliers expanded from just four original equipment manufacturers (OEMs) in 2005 to nine from 2008 to 2011 and twelve in 2012. Since 2012, however, the U.S. turbine market has been dominated by just a handful of OEMs—a trend that may continue in the future due to consolidation among OEMs. For example, the Nordex/Acciona merger took effect in April 2016 (in Figure 9, their combined operations are reported starting in 2016), while Siemens Wind Power and Gamesa consolidated their operations in April 2017 (and are combined in Figure 9 starting in 2017).
According to the Global Wind Energy Council (GWEC), Vestas was the leading supplier of turbines worldwide in 2018, followed by Goldwind, SGRE, and GE. On a worldwide basis, Chinese turbine manufacturers continued to occupy positions of prominence, with eight of the top fifteen spots in the ranking. To date, however, the growth of Chinese turbine manufacturers has been primarily based on sales to the Chinese market. GE is the only U.S.-based utility-scale turbine manufacturer playing a role in the global supply of large wind turbines.
14 Market share is reported in MW terms and is based on project installations in the year in question.
11

vk.com/id446425943
2018 Wind Technologies Market Report
The domestic wind industry supply chain was reasonably stable in 2018
The wind industry’s domestic supply chain continues to deal with conflicting pressures: a surge in near-term expected growth from new installations and partial repowering, but also strong competitive pressures and expected reduced demand in the medium-term as the PTC is phased out. As a result, though some manufacturers increased the size of their U.S. workforce in 2018, overall growth has moderated.
Figure 10 presents a non-exhaustive list of approximately 140 wind turbine and component manufacturing and assembly facilities operating in the United States at the end of 2018, focusing on the utility-scale wind market.15 Figure 11 segments those facilities by the type of component they primarily supply.
Figure 10. Location of existing and new turbine and component manufacturing facilities
No new wind-related manufacturing facilities opened in 2018, as illustrated in Figure 11. However, two new facilities were announced and are expected to be online by the end of 2019. In August 2018, Betz Industries announced plans to build a new facility in Michigan near the company’s existing headquarters that will manufacture iron castings for multiple industries including wind energy. The facility is expected to open in 2019 and employ up to 45 workers at full capacity. Additionally, RMC Advanced Technologies—a subsidiary of Sigma Industries—announced the acquisition of a new facility in Tennessee that will produce composite parts used by the wind energy industry. The facility is expected to open in 2019 and employ 50 when operating
15 The data on manufacturing facilities presented here differ from those presented in AWEA (2019a) due, in part, to methodological differences. For example, AWEA includes data on a large number of smaller component suppliers that are not included in this report; the figure presented here also does not include research and development and logistics centers, or material suppliers. As a result, AWEA (2019a) reports a much larger number of wind-related manufacturing facilities.
12

vk.com/id446425943
2018 Wind Technologies Market Report
at capacity. Meanwhile, at least four existing wind turbine or component manufacturing facilities were consolidated, closed, or stopped serving the industry in 2018 (The Gear Works, Creative Foam, Danfoss Drives, and ZF). In addition, in late 2017, MFG Wind announced that it would be closing its blade manufacturing facility in Aberdeen, South Dakota, though the company has since adjusted the timeframe for the closure and will keep the facility open through 2020.
Number of Manufacturing Facilities
100
80
 Opened in 2018
 Opened before 2018
60
40
20
0
Turbines |
Blades |
Towers |
Nacelle Components |
Other |
Notes: No new manufacturing facilities opened in 2018. Manufacturing facilities that produce multiple components are included in multiple bars. “Other” includes facilities that produce items such as: enclosures, power converters, slip-rings, inverters, electrical components, tower internals, climbing devices, couplings, castings, rotor hubs, plates, walkways, doors, bearing cages, fasteners, bolts, magnetics, safety rings, struts, clamps, transmission housings, embed rings, electrical cable systems, yaw/pitch control systems, bases, generator plates, slew bearings, flanges, anemometers, and template rings.
Source: National Renewable Energy Laboratory
Figure 11. Number of wind turbine and component manufacturing facilities in the United States
Notwithstanding the recent supply chain consolidation and slow additions of new facilities, there remain a large number of domestic manufacturing facilities. Additionally, multiple manufacturers either expanded their workforce in 2018 to meet demand (e.g., Vestas, Broadwind, LM Wind Power), or began or completed expansions of existing facilities (e.g., LM Wind Power, Timken).
Figure 10 also highlights the spread of turbine and component manufacturing facilities across the country. Many manufacturers have chosen to locate in markets with substantial wind power capacity or near alreadyestablished large-scale OEMs. However, even states that are relatively far from major wind markets have manufacturing facilities. For example, most states in the Southeast have wind manufacturing facilities despite the limited number of wind projects in that region. Workforce considerations, transportation costs, and state and local incentives may be some of the factors that drive location decisions.
In 2010, nine out of the eleven wind turbine OEMs with the largest shares of the U.S. market owned at least one domestic manufacturing facility (Acciona, Clipper, DeWind, Gamesa, GE, Nordex, Siemens, Suzlon, and Vestas). Since that time, a number of these facilities have closed, reflecting the increased concentration of the U.S. wind industry among the top OEMs, long-term demand uncertainty, mergers among OEMs, and a desire to consolidate production at centralized facilities overseas to gain economies of scale. Even with a consolidated market, however, three major OEMs that serve the U.S. wind industry—GE, Vestas, and SGRE—had one or more operating manufacturing facilities in the country at the end of 2018. In contrast, 14 years ago in 2004, there was only one active OEM (GE) assembling nacelles domestically.16
16 Nacelle assembly is defined here as the process of combining the multitude of components included in a turbine nacelle, such as the gearbox and generator, to produce a complete turbine nacelle unit.
13
vk.com/id446425943
2018 Wind Technologies Market Report
An additional note of interest from 2018 was the continued entry of new composite producers into the U.S. market. Though not tracked within the wind turbine and component manufacturing and assembly facilities dataset otherwise reported here, composites are used in the manufacturing of some wind turbine components. In 2018, Exel Composites acquired Diversified Structural Composites of Erlanger, Kentucky to gain North American manufacturing capacity, and SKAPS Industries acquired Matrix Composites in Henderson, Kentucky. Additionally, SKAPS announced that it would invest $5 million for upgrades and hire 20 workers. Both of these facilities will supply composite materials for U.S. wind energy component manufacturers.
In aggregate, domestic turbine nacelle assembly capability—defined here as the maximum annual nacelle assembly capability of U.S. plants if all were operating at full utilization—grew from less than 1.5 GW in 2006 to more than 13 GW in 2012, fell to roughly 10 GW in 2015, and then rose to a record 15 GW in 2018 (Figure 12; AWEA 2019a). In addition, AWEA (2019a) reports that U.S. manufacturing facilities have the capability to produce 11,400 individual blades (~9.2 GW if using average sized turbines) and 3,700 towers (~8.9 GW) annually. Figure 12 contrasts this equipment manufacturing capability with past U.S. wind additions as well as near-term forecasts of future new installations (see Chapter 9, “Future Outlook”). It demonstrates that domestic manufacturing capability for blades, towers, and nacelle assembly is reasonably well balanced against historical market demand. Modest growth in domestic blade and tower manufacturing capability or additional imports may be necessary to fulfill the total anticipated demand of blades and towers in the coming two years, however, especially when also considering expected demand from partial wind project repowering. Given the anticipated decline in wind power capacity additions as the PTC phases out, domestic manufacturing capability may exceed supply needs starting in 2021.
Capacity (GW)
18
Past Projected
15 |
|
|
|
|
|
|
|
|
|
|
|
|
|
Nacelle assembly |
|
|
|
|
|
|
|
||||
|
|
|
|
|
|
|
|
|
||||
|
|
manufacturing capacity |
|
|
|
|
|
|
||||
12 |
|
|
|
|
|
|
|
|
|
|
|
|
|
Tower capacity Blades capacity |
|
|
|
|
|
|
|
|
|
||
9 |
|
|
|
|
|
|
|
|
|
|||
|
|
|
|
|
|
|
|
|
|
|||
|
|
|
|
|
|
|
|
|
|
|
|
|
|
|
|
|
|
|
|
|
|
|
|
|
|
6
3
Annual installed wind power capacity
0 


 2006 2007 2008 2009 2010 2011 2012 2013 2014 2015 2016 2017 2018 2019 2020 2021 2022
Notes: Data on blade and tower manufacturing capability are only available from 2012 to 2018. Forecasted annual wind power capacity additions from 2019 through 2022 includes simple average, minimum, and maximum value from analyst projections.
Sources: AWEA WindIQ, BNEF (2019), IHS (2019), GWEC (2019), Navigant (2019), Wood Mackenzie (2019), Berkeley Lab
Figure 12. Domestic wind manufacturing capability vs. U.S. wind power capacity installations
14
vk.com/id446425943
2018 Wind Technologies Market Report
Fierce competition throughout the supply chain has caused many manufacturers to execute cost-cutting measures. Nonetheless, the profitability of turbine OEMs has generally declined in the most recent years, following several years of recovery from a low point in 2012 (Figure 13).17 Moreover, with recent and nearterm expected growth in U.S. wind installations, wind-related job totals in the United States reached a new alltime high in 2018, at 114,000 full-time workers, an 8% boost from 2017 (AWEA 2019a). These 114,000 jobs include, among others, those in construction, development and transportation (~45,500), manufacturing and supply chain (~24,000), and operations and maintenance (~21,000).
|
20% |
|
|
|
|
Margins |
15% |
|
|
|
|
10% |
|
|
|
|
|
Proft |
5% |
|
|
|
|
OEM |
|
|
|
|
|
|
|
|
|
|
|
|
0% |
|
|
|
|
|
-5% |
Solid line with circle markers = EBITDA |
|
|
|
|
Dashed line with square markers = EBIT |
|
|
||
|
-10% |
|
|
|
|
|
|
Gamesa/SGRE |
Vestas |
Nordex |
Goldwind |
|
|
2008-2018 |
2008-2018 |
2008-2018 |
2008-2018 |
Notes: EBITDA = Earnings Before Interest, Taxes, Depreciation and Amortization; EBIT = Earnings Before Interest and Taxes. Gamesa data shown through 2016, with the merged SGRE shown after 2016.
Sources: OEM annual reports and financial statements
Figure 13. Turbine OEM global profitability over time
Domestic manufacturing content is strong for some wind turbine components, but the U.S. wind industry remains reliant on imports
The U.S. wind sector is reliant on imports of wind equipment, though the level of dependence varies by component. Some components have a relatively high domestic share, whereas others remain largely imported. These trends are revealed, in part, by data on wind equipment trade from the U.S. Department of Commerce.18
Figure 14 presents data on the dollar value of estimated imports to the United States of wind-related equipment that can be tracked through trade codes. Specifically, the figure shows imports of wind-powered generating
17Figure 13 only reports data for those OEMs that are “pure-play” wind turbine manufacturers, or that otherwise report profitability just for their wind business. Although it is one of the largest turbine suppliers in the U.S. market, GE is not included because it is a multi-national conglomerate that does not report segmented financial data for its wind turbine division. Figure 13 depicts both EBIT (i.e., “earnings before interest and taxes,” also referred to as “operating profit”) and EBITDA (i.e., “earnings before interest, taxes, depreciation, and amortization”) margins.
18See the Appendix for further details on data sources and methods used in this section, including the specific trade codes considered.
15

vk.com/id446425943
2018 Wind Technologies Market Report
sets and nacelles (i.e., nacelles with blades, nacelles without blades, and, in some cases, other turbine components internal to the nacelle) as well as imports of other select turbine components shipped separately from the generating sets and nacelles.19 The turbine components included in the figure consist only of those that can be tracked through trade codes: towers, generators (as well as generator parts), and blades and hubs.
Import estimates should be viewed with particular caution because the underlying data used to produce Figure 14 are based on trade categories that are not all exclusive to wind. Some of the import estimates shown in Figure 14 therefore required assumptions about the fraction of larger trade categories likely to be represented by wind turbine components. The error bars in Figure 14 account for uncertainty in these assumed fractions. In 2012 and 2013, all trade categories shown were either specific to or largely restricted to wind power, and therefore no error bars are shown. After 2013, only nacelles (when shipped alone) are included in a trade category that is not largely exclusive to wind20 and thus the error bars shown for 2014 through 2018 only reflect the uncertainty in nacelle imports (and, in some cases, other turbine components internal to the nacelle shipped under this trade category). More generally, as noted earlier, Figure 14 does not show comprehensive data on the import of all wind equipment, as not all such equipment is clearly identified in trade categories. The impact of this omission on import and domestic content is discussed later.
Imports (Billion 2018$US)
7
6
5
4
3
2
1
0
 Other wind-relatedequipment (estimated,2006−2011)
 Windgenerators(2012−2018)
 Wind bladesand hubs (2012−2018)
 Windtowers(estimated,2006−2010)


 Wind-poweredgeneratingsets&nacelles(estimated,2014−2018)
2006 |
2007 |
2008 |
2009 |
2010 |
2011 |
2012 |
2013 |
2014 |
2015 |
2016 |
2017 |
2018 |
2.5 GW |
5.3 GW |
8.4 GW 10.0 GW 5.2 GW |
6.8 GW 13.1 GW 1.1 GW |
4.9 GW |
8.6 GW |
8.2 GW |
7.0 GW |
7.6 GW |
||||
Source: Berkeley Lab analysis of data from USITC DataWeb: http://dataweb.usitc.gov
Figure 14. Estimated imports of wind-powered generating sets, nacelles, towers, generators, and blades and hubs, as well as exports of wind-powered generating sets
As shown, the estimated imports of tracked wind-related equipment into the United States increased substantially from 2006 to 2008, before falling through 2010, increasing somewhat in 2011 and 2012, and then plummeting in 2013 with the simultaneous drop in U.S. wind installations. From 2014 through 2018, imports of wind-related turbine equipment generally followed U.S. wind installation trends, bouncing back from the low of 2013. These overall trends are driven by a combination of factors: changes in the share of domestically manufactured wind turbines and components (versus imports), changes in the annual rate of wind installations
19Wind turbine components such as blades, towers, and generators are included in the data on wind-powered generating sets and nacelles if shipped in the same transaction. Otherwise, these component imports are reported separately.
20The trade code for tower imports is also not entirely exclusive to wind, but is believed to be dominated by wind since 2011. We assume that 100% of imports from this trade category, since 2011, represent wind equipment.
16
vk.com/id446425943
2018 Wind Technologies Market Report
(shown textually on the x-axis of Figure 14), and changes in wind turbine prices. Because imports of wind turbine component parts occur in additional, broad trade categories different from those included in Figure 14, the data presented here understate the aggregate amount of wind equipment imports.
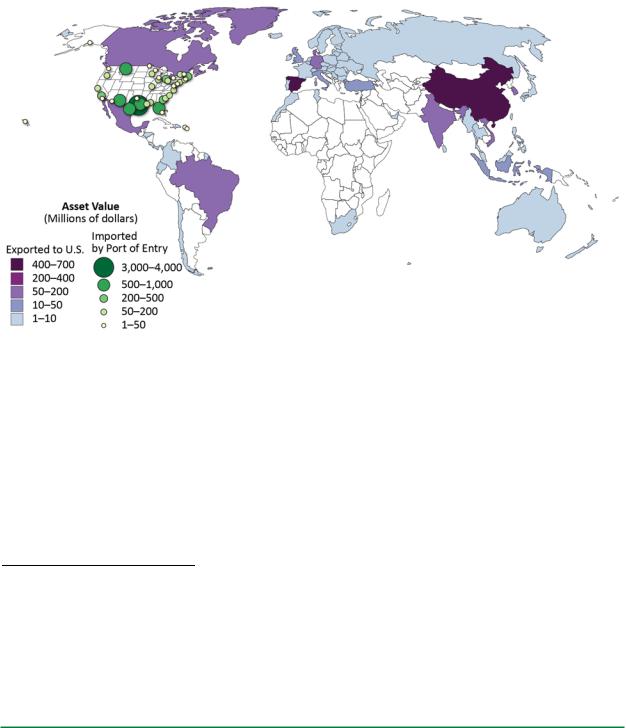
Figure 15 shows the total value of selected, tracked wind-specific imports to the United States in 2018, by country of origin, as well as the main “districts of entry”21: Forty-four percent of the import value in 2018 came from Asia (led by China), 35% from Europe (led by Spain), and 20% from the Americas (led by Mexico). The principal districts of entry were Houston-Galveston, Texas (32%), Port Arthur, Texas (10%), and Great Falls, Montana (8%).
Figure 15. Summary map of tracked wind-specific imports in 2018: countries of origin and U.S. districts of entry
Looking behind the import data in more detail and focusing on those trade codes that are largely exclusive to wind equipment, Figure 16 shows a number of trends over time in the origin of U.S. imports of wind-powered generating sets, tubular towers, wind blades and hubs, and wind generators and parts.
21 The trade categories included here are all of the wind-specific import categories for 2018, inclusive of towers, which is believed to be primarily related to wind (see the Appendix for details), and so the 2018 total import volume considered in Figure 15 differs from that in Figure 14. As noted earlier, imports of many wind turbine component parts occur in broad trade categories not captured by those included in this analysis; additionally, in the case of nacelles without blades, the trade code is not exclusive to wind and so related imports are not included in Figure 15 (though they are estimated in Figure 14). As such, the data presented in Figure 15 understate the aggregate amount of wind equipment imports into the United States. Note also that “districts of entry,” as used here, refers to, in some cases, multiple points of entry located in the same geographic region; goods may arrive at districts of entry by land, air, or sea.
17

vk.com/id446425943
2018 Wind Technologies Market Report
Wind-Powered Generating Sets
imports) |
100% |
|
|
|
|
|
|
|
|
|
|
|
|
|
|
|
|
|
|
|
|
|
|
|
|
|
|
|
|
|
|
|
|
|
|
|
|
|
|
|
|
|
|
|
|
|
|
|
|
|
|
|
|
|
|
|
|
|
|
|
|
|
|
|
|
|
|
|
|
|
Germany |
|||||
|
90% |
|
|
|
|
|
|
|
|
|
|
|
|
|
|
|
|
|
|
|
|
|
|
|
|
|
|
|
|
|
|
|
|
|
|
|
|
|
|
|
|
|
|
|
|
|
|
|
|
|
|
|
|
|
|
|
|
|
|
|
|
|
|
|
|
|
|
|
|
|
||||||
|
|
|
|
|
|
|
|
|
|
|
|
|
|
|
|
|
|
|
|
|
|
|
|
|
|
|
|
|
|
|
|
|
|
|
|
|
|
|
|
|
|
|
|
|
|
|
|
|
|
|
|
|
|
|
|
|
|
|
|
|
|
|
|
|
|
|
|
|
|
|
||||||
|
|
|
|
|
|
|
|
|
|
|
|
|
|
|
|
|
|
|
|
|
|
|
|
|
|
|
|
|
|
|
|
|
|
|
|
|
|
|
|
|
|
|
|
|
|
|
|
|
|
|
|
|
|
|
|
|
|
|
|
|
|
|
|
|
|
|
|
|
|
|
|
|
||||
annual |
|
80% |
|
|
|
|
|
|
|
|
|
|
|
|
|
|
|
|
|
|
|
|
|
|
|
|
|
|
|
|
|
|
|
|
|
|
|
|
|
|
|
|
|
|
|
|
|
|
|
|
|
|
|
|
|
|
|
|
|
|
|
|
|
|
|
|
|
|
|
|
|
|
|
|||
|
|
|
|
|
|
|
|
|
|
|
|
|
|
|
|
|
|
|
|
|
|
|
|
|
|
|
|
|
|
|
|
|
|
|
|
|
|
|
|
|
|
|
|
|
|
|
|
|
|
|
|
|
|
|
|
|
|
|
|
|
|
|
|
|
|
|
|
|
|
|
|
|||||
|
70% |
|
|
|
|
|
|
|
|
|
|
|
|
|
|
|
|
|
|
|
|
|
|
|
|
|
|
|
|
|
|
|
|
|
|
|
|
|
|
|
|
|
|
|
|
|
|
|
|
|
|
|
|
|
|
|
|
|
|
|
|
|
|
|
|
|
|
|
|
|
|
|
||||
|
|
|
|
|
|
|
|
|
|
|
|
|
|
|
|
|
|
|
|
|
|
|
|
|
|
|
|
|
|
|
|
|
|
|
|
|
|
|
|
|
|
|
|
|
|
|
|
|
|
|
|
|
|
|
|
|
|
|
|
|
|
|
|
|
|
|
|
|
|
|
|
|
||||
(% of |
|
60% |
|
|
|
|
|
|
|
|
|
|
|
|
|
|
|
|
|
|
|
|
|
|
|
|
|
|
|
|
|
|
|
|
|
|
|
|
|
|
|
|
|
|
|
|
|
|
|
|
|
|
|
|
|
|
|
|
|
|
|
|
|
|
|
|
|
|
|
|
|
|
|
|||
|
|
|
|
|
|
|
|
|
|
|
|
|
|
|
|
|
|
|
|
|
|
|
|
|
|
|
|
|
|
|
|
|
|
|
|
|
|
|
|
|
|
|
|
|
|
|
|
|
|
|
|
|
|
|
|
|
|
|
|
|
|
|
|
|
|
|
|
|
|
|
|
|||||
|
50% |
|
|
|
|
|
|
|
|
|
|
|
|
|
|
|
|
|
|
|
|
|
|
|
|
|
|
|
|
|
|
|
|
|
|
|
|
|
|
|
|
|
|
|
|
|
|
|
|
|
|
|
|
|
|
|
|
|
|
|
|
|
|
|
|
|
|
|
|
|
|
|
||||
|
|
|
|
|
|
|
|
|
|
|
|
|
|
|
|
|
|
|
|
|
|
|
|
|
|
|
|
|
|
|
|
|
|
|
|
|
|
|
|
|
|
|
|
|
|
|
|
|
|
|
|
|
|
|
|
|
|
|
|
|
|
|
|
|
|
|
|
|
|
|
|
|||||
Country |
|
30% |
|
|
|
|
|
|
|
|
|
|
|
|
|
|
|
|
|
|
|
|
|
|
|
|
|
|
|
|
|
|
|
|
|
|
|
|
|
|
|
|
|
|
|
|
|
|
|
|
|
|
|
|
|
|
|
|
|
|
|
|
|
|
|
|
|
|
|
|
|
Spain |
||||
Exporting |
|
40% |
|
|
|
|
|
|
|
|
|
|
|
|
|
|
|
|
|
|
|
|
|
|
|
|
|
|
|
|
|
|
|
|
|
|
|
|
|
|
|
|
|
|
|
|
|
|
|
|
|
|
|
|
|
|
|
|
|
|
|
|
|
|
|
|
|
|
|
|
|
|||||
|
20% |
|
|
|
|
|
|
|
|
|
|
|
|
|
|
|
|
|
|
|
|
|
|
|
|
|
|
|
|
|
|
|
|
|
|
|
|
|
|
|
|
|
|
|
|
|
|
|
|
|
|
|
|
|
|
|
|
|
|
|
|
|
|
|
|
|
|
|
|
|
|
|
||||
|
|
|
|
|
|
|
|
|
|
|
|
|
|
|
|
|
|
|
|
|
|
|
|
|
|
|
|
|
|
|
|
|
|
|
|
|
|
|
|
|
|
|
|
|
|
|
|
|
|
|
|
|
|
|
|
|
|
|
|
|
|
|
|
|
|
|
|
|
|
|
|
|
||||
|
|
10% |
|
|
|
|
|
|
|
|
|
|
|
|
|
|
|
|
|
|
|
|
|
|
|
|
|
|
|
|
|
|
|
|
|
|
|
|
|
|
|
|
|
|
|
|
|
|
|
|
|
|
|
|
|
|
|
|
|
|
|
|
|
|
|
|
|
|
|
|
|
|
|
|||
|
|
|
|
|
|
|
|
|
|
|
|
|
|
|
|
|
|
|
|
|
|
|
|
|
|
|
|
|
|
|
|
|
|
|
|
|
|
|
|
|
|
|
|
|
|
|
|
|
|
|
|
|
|
|
|
|
|
|
|
|
|
|
|
|
|
|
|
|
|
|
|
|
||||
Annual 0% |
|
|
|
|
|
|
|
|
|
|
|
|
|
|
|
|
|
|
|
|
|
|
|
|
|
|
|
|
|
|
|
|
|
|
|
|
|
|
|
|
|
|
|
|
|
|
|
|
|
|
|
|
|
|
|
|
|
|
|
|
|
|
|
|
|
|
|
|
|
|
|
|||||
2005 |
2006 |
2007 |
2008 |
2009 |
2010 |
2011 |
2012 |
2013 |
2014 |
2015 |
2016 |
2017 |
2018 |
|
|
|||||||||||||||||||||||||||||||||||||||||||||||||||||||||||||
Imports |
|
|
||||||||||||||||||||||||||||||||||||||||||||||||||||||||||||||||||||||||||
|
|
|
|
0.6 |
1.5 |
|
2.9 |
2.9 |
2.6 |
|
1.4 |
|
|
|
1.4 |
|
|
1.1 |
|
0.0 |
|
0.3* |
|
0.2* |
0.1* |
|
0.2* |
0.2* |
|
|
||||||||||||||||||||||||||||||||||||||||||||||
(billion |
|
|
|
|
|
|
|
|
|
|
|
|
|
|
|
|
|
|||||||||||||||||||||||||||||||||||||||||||||||||||||||||||
|
|
|
|
|
|
|
|
|
|
|
|
|
|
|
|
|
|
|
|
|
|
|
|
|
|
|
|
|
|
|
|
|
|
|
|
|
|
|
|
|
|
|
|
|
|
|
|
|
|
|
|
|
|
|
|
|
|
|
|
|
|
|
|
|
|
|
|
|
|
|
||||||
2018$) |
|
|
|
|
|
|
|
|
|
Towers |
|
|
|
|
|
|
|
|
|
|
|
|
Blades & Hubs |
|
|
|
|
|
|
|
|
Generators & Parts |
||||||||||||||||||||||||||||||||||||||||||||
100% |
|
|
|
|
|
|
|
|
|
|
|
|
|
|
|
|
|
|
|
|
|
|
|
|
|
|
|
|
|
|||||||||||||||||||||||||||||||||||||||||||||||
|
|
|
|
|
|
|
|
|
|
|
|
|
|
|
|
|
|
|
|
|
|
|
|
|
|
|
|
|
|
|
|
|
|
|
|
|
|
|
|
|
|
|
|
|
|
|
Canada |
|
|
|
|
|
|
|
|
|
|
|
|
|
|
|
|
|
|
|
|
|
|
|||||||
|
|
|
|
|
|
|
|
|
|
|
|
|
|
|
|
|
|
|
|
|
|
|
|
|
|
|
|
|
|
|
|
|
|
|
|
|
|
|
|
|
|
|
|
|
|
|
|
|
|
|
|
|
|
|
|
|
|
|
|
|
|
|
|
|
|
|
|
|||||||||
90% |
|
|
|
|
|
|
|
|
|
|
|
|
|
|
|
|
|
|
|
|
|
|
|
|
|
|
|
|
|
|
|
|
|
|
|
|
|
|
|
|
|
|
|
|
|
|
|
|
|
|
|
|
|
|
|
|
|
|
|
|
|
|
|
|
|
|
|
|
||||||||
|
|
|
|
|
|
|
|
|
|
|
|
|
|
|
|
|
|
|
|
|
|
|
|
|
|
|
|
|
|
|
|
|
|
|
|
|
|
|
|
|
|
|
|
|
|
|
Brazil |
|
|
|
|
|
|
|
|
|
|
|
|
|
|
|
|
|
|
|
|
|
|
|
|
|
||||
|
|
|
|
|
|
|
|
|
|
|
|
|
|
|
|
|
|
|
|
|
|
|
|
|
|
|
|
|
|
|
|
|
|
|
|
|
|
|
|
|
|
|
|
|
|
|
|
|
|
|
|
|
|
|
|
|
|
|
|
|
|
|
|
|
|
|
|
|
|
|
|
|||||
80% |
|
|
|
|
|
|
|
|
|
|
|
|
|
|
|
|
|
|
|
|
|
|
|
|
|
|
|
|
|
|
|
|
|
|
|
|
|
|
|
|
|
|
|
|
|
|
|
|
|
|
|
|
|
|
|
|
|
|
|
|
|
|
|
|
|
|
|
|
|
|
|
|
||||
|
|
|
|
|
|
|
|
|
|
|
|
|
|
|
|
|
|
|
|
Canada |
|
|
|
|
|
|
|
|
|
|
|
|
|
|
|
|
|
|
|
|
|
|
|
|
|
|
|
|
|
|
|
|
|
|
|
|
|
|
|
|
|
|
|
|
|
|
|
|
|
|
|
|||||
|
|
|
|
|
|
|
|
|
|
|
|
|
|
|
|
|
|
|
|
|
|
|
|
|
|
|
|
|
|
|
|
|
|
|
|
|
|
|
|
|
|
|
|
|
|
|
|
|
|
|
|
|
|
|
|
|
|
|
|
|
|
|
|
|
|
|
|
|
|
|
||||||
|
|
|
|
|
|
|
|
|
|
|
|
|
|
|
|
|
|
|
|
|
|
|
|
|
|
|
|
|
|
|
|
|
|
|
|
|
|
|
|
|
|
|
|
|
|
|
|
|
|
|
|
|
|
|
|
|
|
|
|
|
|
|
|
|
|
|
|
|
|
|
||||||
70% |
|
|
|
|
|
|
|
|
|
|
|
|
|
|
|
|
|
|
|
|
|
|
|
|
|
|
|
|
|
|
|
|
|
|
|
|
|
|
|
|
|
|
|
|
|
|
|
|
|
|
|
|
|
|
|
|
|
|
|
|
|
|
|
|
|
|
|
|
|
|
|
|
|
|
Mexico |
|
|
|
|
|
|
|
|
|
|
|
|
|
|
|
|
|
|
|
|
|
|
|
|
|
|
|
|
|
|
|
|
|
|
|
|
|
|
|
|
|
|
|
|
|
|
|
|
|
|
|
|
|
|
|
|
|
|
|
|
|
|
|
|
|
|
|
|
|
|
|
|
|
|
|
|||
|
|
|
|
|
|
|
|
|
|
|
|
|
|
|
|
|
|
|
|
Spain |
|
|
|
|
|
|
|
|
|
|
|
|
|
|
|
|
|
|
|
|
|
|
|
Spain |
|
|
|
|
|
|
|
|
|
|
|
|
|
|
|
|
|
|
|
|
|
|
|
|||||||||
60% |
|
|
|
|
|
|
|
|
|
|
|
|
|
|
|
|
|
|
|
|
|
|
|
|
|
|
|
|
|
|
|
|
|
|
|
|
|
|
|
|
|
|
|
|
|
|
|
|
|
|
|
|
|
|
|
|
|
|
|
|
|
|
|
|
|
|
|
|
||||||||
|
|
|
|
|
|
|
|
|
|
|
|
|
|
|
|
|
|
|
|
|
|
|
|
|
|
|
|
|
|
|
|
|
|
|
|
|
|
|
|
|
|
|
|
|
|
|
|
|
|
|
|
|
|
|
|
|
|
|
|
|
|
|
|
|
|
|
|
|
|
|
||||||
|
|
|
|
|
|
|
|
|
|
|
|
|
|
|
|
|
|
|
|
|
|
|
|
|
|
|
|
|
|
|
|
|
|
|
|
|
|
|
|
|
|
|
|
|
|
|
|
|
|
|
|
|
|
|
|
|
|
|
|
|
|
|
|
|
|
|
|
|
|
|
||||||
|
|
|
|
|
|
|
|
|
|
|
|
|
|
|
|
|
|
|
|
|
|
|
|
|
|
|
|
|
|
|
|
|
|
|
|
|
|
|
|
|
|
|
|
|
|
|
|
|
|
|
|
|
|
|
|
|
|
|
|
|
|
|
|
|
|
|
|
|
|
|
||||||
50% |
|
|
|
|
|
|
|
|
|
|
|
|
|
|
|
|
|
|
|
|
|
|
|
|
|
|
|
|
|
|
|
|
|
|
|
|
|
|
|
|
|
|
|
|
|
|
|
India |
|
|
|
|
|
|
|
|
|
|
|
|
|
|
|
|
|
|
|
|
|
|
|
|
|
|||
|
|
|
|
|
|
|
|
|
|
|
|
|
|
|
|
|
|
|
|
|
|
|
|
|
|
|
|
|
|
|
|
|
|
|
|
|
|
|
|
|
|
|
|
|
|
|
|
|
|
|
|
|
|
|
|
|
|
|
|
|
|
|
|
|
|
|
|
|
|
|
|
|||||
|
|
|
|
|
|
|
|
|
|
|
|
|
|
|
|
|
|
|
Vietnam |
|
|
|
|
|
|
|
|
|
|
|
|
|
|
|
|
|
|
|
|
|
|
|
|
|
|
|
|
|
|
|
|
|
|
|
|
|
|
|
|
|
|
|
|
|
|
|
|
|||||||||
|
|
|
|
|
|
|
|
|
|
|
|
|
|
|
|
|
|
|
|
|
|
|
|
|
|
|
|
|
|
|
|
|
|
|
|
|
|
|
|
|
|
|
|
|
|
|
|
|
|
|
|
|
|
|
|
|
|
|
|
|
|
|
|
|
|
|
|
|
|
|
|
|||||
40% |
|
|
|
|
|
|
|
|
|
|
|
|
|
|
|
|
|
|
|
|
|
|
|
|
|
|
|
|
|
|
|
|
|
|
|
|
|
|
|
|
|
|
|
|
|
|
|
|
|
|
|
|
|
|
|
|
|
|
|
|
|
|
|
|
|
|
|
|
|
|
|
|
|
|
Serbia |
|
|
|
|
|
|
|
|
|
|
|
|
|
|
|
|
|
|
|
|
|
|
|
|
|
|
|
|
|
|
|
|
|
|
|
|
|
|
|
|
|
|
|
|
|
|
|
|
|
|
|
|
|
|
|
|
|
|
|
|
|
|
|
|
|
|
|
|
|
|
|
|
|
|
|
|||
|
|
|
|
|
|
|
|
|
|
|
|
|
|
|
|
|
|
|
Indonesia |
|
|
|
|
|
|
|
|
|
|
|
|
|
|
|
|
|
|
|
|
|
|
|
|
|
|
|
|
|
|
|
|
|
|
|
|
|
|
|
|
|
|
|
|
|
|
|
|
|
||||||||
30% |
|
|
|
|
|
|
|
|
|
|
|
|
|
|
|
|
|
|
|
|
|
|
|
|
|
|
|
|
|
|
|
|
|
|
|
|
|
|
|
|
|
|
|
|
|
|
|
|
|
|
|
|
|
|
|
|
|
|
|
|
|
|
|
|
|
|
|
|
|
Spain |
||||||
|
|
|
|
|
|
|
|
|
|
|
|
|
|
|
|
|
|
|
|
|
|
|
|
|
|
|
|
|
|
|
|
|
|
|
|
|
|
|
|
|
|
|
|
|
|
|
China |
|
|
|
|
|
|
|
|
|
|
|
|
|
|
|
|
|
|
|
|
|
|
|
|
|
||||
|
|
|
|
|
|
|
|
|
|
|
|
|
|
|
|
|
|
|
|
|
|
|
|
|
|
|
|
|
|
|
|
|
|
|
|
|
|
|
|
|
|
|
|
|
|
|
|
|
|
|
|
|
|
|
|
|
|
|
|
|
|
|
|
|
|
|
|
|
|
|
|
|||||
20% |
|
|
|
|
|
|
|
|
|
|
|
|
|
|
|
|
|
|
|
|
|
|
|
|
|
|
|
|
|
|
|
|
|
|
|
|
|
|
|
|
|
|
|
|
|
|
|
|
|
|
|
|
|
|
|
|
|
|
|
|
|
|
|
|
|
|
|
|
|
|
|
China |
||||
|
|
|
|
|
|
|
|
|
|
|
|
|
|
|
|
|
|
|
|
|
|
|
|
|
|
|
|
|
|
|
|
|
|
|
|
|
|
|
|
|
|
|
|
|
|
|
|
|
|
|
|
|
|
|
|
|
|
|
|
|
|
|
|
|
|
|
|
|
|
|
||||||
|
|
|
|
|
|
|
|
|
|
|
|
|
|
|
|
|
|
|
S. Korea |
|
|
|
|
|
|
|
|
|
|
|
|
|
|
|
|
|
|
|
|
|
|
|
|
|
|
|
|
|
|
|
|
|
|
|
|
|
|
|
|
|
|
|
|
|
|
|||||||||||
10% |
|
|
|
|
|
|
|
|
|
|
|
|
|
|
|
|
|
|
|
|
|
|
|
|
|
|
|
|
|
|
|
|
|
|
|
|
|
|
|
|
|
|
|
|
|
|
|
|
|
|
|
|
|
|
|
|
|
|
|
|
|
|
|
|
|
|
|
|
|
Vietnam |
||||||
|
|
|
|
|
|
|
|
|
|
|
|
|
|
|
|
|
|
|
|
|
|
|
|
|
|
|
|
|
|
|
|
|
|
|
|
|
|
|
|
|
|
|
|
|
|
|
|
|
|
|
|
|
|
|
|
|
|
|
|
|
|
|
|
|
|
|
|
|
|
|
|
|
|
|||
|
|
|
|
|
|
|
|
|
|
|
|
|
|
|
|
|
|
|
|
|
|
|
|
|
|
|
|
|
|
|
|
|
|
|
|
|
|
|
|
|
|
|
|
|
|
|
|
|
|
|
|
|
|
|
|
|
|
|
|
|
|
|
|
|
|
|
|
|
|
|
|
|
|
|||
0% |
|
|
|
|
|
|
|
|
|
|
|
|
|
|
|
|
|
|
|
|
|
|
|
|
|
|
|
|
|
|
|
|
|
|
|
|
|
|
|
|
|
|
|
|
|
|
|
|
|
|
|
|
|
|
|
|
|
|
|
|
|
|
|
|
|
|
|
|
|
|
|
|
|
|
||
|
|
|
|
|
|
|
|
|
|
|
|
|
|
|
|
|
|
|
|
|
|
|
|
'12 |
'13 |
'14 |
|
'15 |
'16 |
'17 |
'18 |
|
|
|
'12 |
'13 |
'14 |
'15 |
'16 |
'17 |
'18 |
|
|
|||||||||||||||||||||||||||||||||
'11 |
|
'12 |
'13 |
'14 |
'15 |
|
'16 |
'17 |
'18 |
|
|
|
|
|
|
|
|
|
|
|||||||||||||||||||||||||||||||||||||||||||||||||||||||||
|
|
|
|
|
|
|
|
|
|
|
|
|
|
|||||||||||||||||||||||||||||||||||||||||||||||||||||||||||||||
|
|
0.5 |
|
0.9 |
0.1 |
|
0.3 |
0.3 |
|
0.3 |
0.2 |
0.2 |
|
|
|
|
1.0 |
|
0.3 |
0.5 |
|
0.9 |
0.9 |
0.9 |
0.9 |
|
|
|
0.5 |
0.2 |
0.4 |
|
0.4 |
0.4 |
0.3 |
0.3 |
|
|
||||||||||||||||||||||||||||||||||||||
|
|
|
|
|
|
|
|
|
|
|
|
|
|
|
|
|
|
|
|
|
|
|
|
|
|
|
|
|
|
|
|
|
|
|
|
|
|
|
|
|
|
|
|
|
|
|
|
|
|
|
|
|
|
|
|
|
|
|
|
|
|
|
|
|
|
|
|
|
|
|
|
|
|
|
|
|
|
|
|
|
|
|
|
|
|
|
|
|
|
|
|
|
|
|
|
|
|
|
|
|
|
|
|
|
|
|
|
|
|
|
|
|
|
|
|
|
|
|
|
|
|
|
|
|
|
|
|
|
|
|
|
|
|
|
|
|
|
|
|
|
|
|
|
|
|
|
|
|
|
|
|
|
|
Source: Berkeley Lab analysis of data from USITC DataWeb: https://dataweb.usitc.gov/
* Since 2014, some equipment that would previously have been included in the wind-powered generating sets trade category may be included in a different trade category (not wind specific, so not shown here) due to a change in trade category classification.
Figure 16. Origins of U.S. imports of selected wind turbine equipment
For wind-powered generating sets, the primary source markets from 2005 to 2018 have been Europe and, to a lesser extent, Asia, with leading countries often being those that have been home to the major international turbine manufacturers such as Denmark, Spain, Japan, India, and Germany. In 2018, imports of wind-powered generating sets were dominated by Spain and Germany, though the total import value was relatively low (at
18

vk.com/id446425943
2018 Wind Technologies Market Report
$199 million).22 The share of imports of tubular towers from Asia was over 80% in 2011 and 2012 (almost 50% was from China), with much of the remainder from Canada and Mexico. From 2013 to 2018, not only did the total import value decline relative to earlier years, but there were almost no imports from China and Vietnam from 2013 to 2015—likely a result of the tariff measures that were imposed on wind tower manufacturers from these countries.23 Tower imports in 2018 came from a mix of countries from Asia (principally South Korea, Indonesia, and Vietnam), Europe (principally Spain), and North America (principally Canada). With regard to blades and hubs, Asia (principally China) has been the dominant source market since 2016, the European share has been relatively stable, and imports from the Americas have decreased from over 65% in 2013 to under 20% in 2018. Finally, the import origins for wind-related generators and generator parts were distributed across a number of Asian, European, and North American countries; in recent years, the role of Asian imports has decreased, while North American imports (especially from Mexico) have increased.
Because trade data do not track all imports of wind equipment, it is not possible to use those data to establish a clear overall distinction between imported and domestic content. The trade data also do not allow for a precise estimate of the domestic content of specific turbine components. Nonetheless, based on those data, Table 3 presents rough estimates of the domestic content for a subset of the major wind turbine components used in new (and repowered) U.S. wind projects in 2018. As shown, domestic content is relatively strong for large, transportation-intensive components such as towers and blades. Nacelle assembly also has high domestic content, wherein domestic and imported component are assembled into complete nacelles on U.S. soil.
Table 3. Approximate Domestic Content of Major Components in 2018
Towers |
|
Blades & Hubs |
|
Nacelle Assembly |
|
|
|
|
|
75%–90% |
|
50%–70% |
|
> 85% of nacelle assembly |
|
|
|
|
|
These figures, however, understate the wind industry’s reliance on turbine and component imports. This is because significant wind-related imports occur under trade categories not captured in Table 3, including wind equipment (such as mainframes, converters, pitch and yaw systems, main shafts, bearings, bolts, controls) and manufacturing inputs (such as foreign steel in domestic manufacturing).24 For example, an interview-based approach to estimating domestic content that was conducted in 2012 revealed that domestic content was relatively high for blades, towers, nacelle assembly and nacelle covers at that time, supporting the results depicted in Table 3. However, the domestic content of most of the equipment internal to the nacelle—much of which is not tracked in wind-specific trade data—was considerably lower, often well below 20%.25
22Since 2014, some nacelles could be imported under a different trade category that is not exclusive to wind equipment, and so are not reported in the figure. As such, trends in imports of wind-powered generating sets before 2014 might be expected to differ from those shown in 2014 and after.
23In 2016, the Department of Commerce decided to reduce the anti-dumping duties to zero for a single company, which led to an increase in tower imports from Vietnam.
24On the other hand, this analysis also assumes that all components imported into the United States are used for the domestic market and not used to assemble wind-powered generating sets that are exported from the United States. If this were not the case, the resulting domestic fraction would be slightly higher than that presented here.
25The interviews and analysis were conducted by GLWN, under contract to Berkeley Lab.
19

vk.com/id446425943
2018 Wind Technologies Market Report
The project finance environment remained strong in 2018
Initial concerns over the potential negative impact of the Tax Cuts and Jobs Act (which became law in lateDecember 2017) on wind project finance in the United States have proven to be largely unfounded. In particular, an anticipated reduction in the supply of tax equity due to the lower corporate tax rate (which reduces the tax liability of tax equity investors)26 failed to materialize, as larger profits generally outweighed the lower tax rate, leaving overall tax capacity largely unchanged (Norton Rose Fulbright 2019). As a result, the market remained active in 2018, continuing to finance the backlog of 100% PTC-qualified equipment.
For example, roughly $6–$7 billion in third-party tax equity was committed in 2018 to finance new wind projects and partial repowerings—this dollar amount is roughly on par with the amount of tax equity raised in each of the previous four years. Partnership flip structures27 remained the dominant tax equity vehicle, with indicative tax equity yields closing out the year around 7% on an after-tax unlevered basis (Figure 17).
12% |
|
|
|
|
|
|
|
|
|
|
|
|
|
|
10% |
|
|
|
|
|
|
|
|
|
|
|
|
|
|
8% |
|
|
|
|
|
|
|
|
|
|
Tax Equity Yield (after-tax) |
|||
|
|
|
|
|
|
|
|
|
|
|
|
|
|
|
6% |
|
|
|
|
|
|
|
|
|
15-Year Debt Interest Rate (pre-tax) |
||||
|
|
|
|
|
|
|
|
|
|
|||||
4% |
|
|
|
|
|
|
|
|
|
|
|
|
|
|
2% |
|
|
|
|
|
|
|
|
15-Year Debt Interest Rate (after-tax) |
|||||
|
|
|
|
|
|
|
|
|
||||||
0% |
|
|
|
|
|
|
|
|
|
|
|
|
|
|
Jan-05 |
Jan-06 |
Jan-07 |
Jan-08 |
Jan-09 |
Jan-10 |
Jan-11 |
Jan-12 |
Jan-13 |
Jan-14 |
Jan-15 |
Jan-16 |
Jan-17 |
Jan-18 |
Jan-19 |
Sources: Intercontinental Exchange Benchmark Administration (https://www.theice.com/iba), BNEF (2017), Norton Rose Fulbright (2019)
Figure 17. Cost of 15-year debt and tax equity for utility-scale wind projects over time
On the debt side, banks continued to focus more on shorter-duration loans (7–10 year mini-perms remained the norm28), though a number of banks are reportedly willing to lend for as long as 15 or even 18 years in some
26The lower corporate tax rate also reduces the value of depreciation (or expensing) and interest deductions (and under the new law, interest deductions may be further limited if a company's net interest expense exceeds 30% of its adjusted taxable income).
27A “partnership flip” is a project finance structure in which the developer or project sponsor partners with a third-party tax equity investor to jointly invest in and own part of the project. Initially, allocations of tax benefits are skewed heavily in favor the tax equity partner (which is able to efficiently monetize the tax benefits), but eventually “flip” in favor of the project sponsor partner once the tax benefits have been largely exhausted. Cash is also allocated between the partners, with one or more “flip” events, but in recent years has been increasingly directed toward the project sponsor to the extent possible, in order to support back leverage or dividend payments to YieldCo investors.
28A “mini-perm” is a relatively short-term (e.g., 7–10 years) loan that is sized based on a much longer tenor (e.g., 15–17 years) and therefore requires a balloon payment of the outstanding loan balance upon maturity. In practice, this balloon payment is often paid from the proceeds of refinancing the loan at that time. Thus, a ten-year mini-perm might provide the same amount of leverage as a 17-year fully amortizing loan but with refinancing risk at the end of ten years. In contrast, a 17-year fully amortizing loan would be repaid entirely through periodic principal and interest payments over the full tenor of the loan (i.e., no balloon payment required and no refinancing risk).
20

vk.com/id446425943
2018 Wind Technologies Market Report
cases (Norton Rose Fulbright 2019). As shown in Figure 17, all-in interest rates on benchmark 15-year debt moved higher through much of 2018, but then dropped back down to near 4% toward the end of 2018 as the Federal Reserve paused its multi-year string of 25 basis point rate hikes and shifted to more of a neutral stance, causing both the base rate and swap rates to decline (in concert with bank margins).
With two more years (2019 and 2020) in which to finance and build 100% PTC safe-harbored projects, the market should remain active in the near-term. Post-2020, roughly 10 GW of projects have reportedly qualified for 80% of the PTC’s nominal value, while at least 6.6 GW have reportedly qualified for 60% of the PTC’s nominal value by starting construction by the end of 2018 (Froese 2019). Given the four-year safe harbor window in which to bring PTC-qualified projects online, these 80%- and 60%-PTC projects might be expected to be online by the end of 2021 and 2022, respectively (see Table 4, later, for details on the PTC phase-out).
Independent power producers own the majority of wind assets built in 2018
Independent power producers (IPPs) own 6,073 MW or 80% of the 7,588 MW of new wind capacity installed in the United States in 2018 (Figure 18, right pie chart). Investor-owned utilities (IOUs)—namely MidAmerican (817 MW) and Public Service Company of Colorado (600 MW)—installed a total of 1,509 MW (20%). Publicly owned utilities (POUs) own just 2 MW of the new wind power capacity brought online in 2018. Finally, 4 MW of capacity falls into the “other” category of projects owned by neither IPPs nor utilities (e.g., owned by towns, schools, businesses, farmers).29 Of the cumulative installed wind power capacity at the end of 2018 (Figure 18, left chart), IPPs own 83% and utilities own 15% (13% IOU and 2% POU), with the remaining 2% falling into the “other” category.
|
100% |
|
100% |
2018 Capacity by |
|
Capacity |
90% |
|
90% |
||
|
Owner Category |
||||
80% |
|
80% |
|||
|
|
||||
|
|
|
|||
Installed |
70% |
|
70% |
IPP: |
|
50% |
|
50% |
|||
|
60% |
|
60% |
6,073 MW (80.0%) |
|
Cumulative |
|
|
|
||
20% |
Investor-Owned Utility (IOU) |
20% |
|
||
|
40% |
Other |
40% |
|
|
|
30% |
Publicly Owned Utility (POU) |
30% |
IOU: |
|
|
|
|
|
1,509 MW |
|
of |
10% |
Independent Power Producer (IPP) |
10% |
(19.9%) |
|
|
|||||
% |
Other: 4 MW (0.1%) |
||||
|
|
|
|||
|
0% |
|
0% |
||
|
1998 1999 2000 2001 2002 2003 2004 2005 2006 2007 2008 2009 2010 2011 2012 2013 2014 2015 2016 2017 2018 |
POU: 2 MW (0.0%) |
|||
|
|
|
|||
|
|
|
|
||
Source: Berkeley Lab estimates based on AWEA WindIQ |
|
|
|||
Figure 18. Cumulative and annual (2018) wind power capacity categorized by owner type
29 Many of the “other” projects, along with some IPPand POU-owned projects, might also be considered “community wind” projects that are owned by or benefit one or more members of the local community to a greater extent than typically occurs with a commercial wind project. According to AWEA (2019a), 65 MW (2%) of 2018 wind capacity additions qualified as community wind projects.
21

vk.com/id446425943
2018 Wind Technologies Market Report
Long-term contracted sales to utilities remained the most common off-take arrangement, but direct retail sales and merchant off-take arrangements were both significant
Electric utilities continued to be the largest off-takers of wind power in 2018 (i.e., ‘users’ of wind to serve load) (Figure 19, right pie chart), either owning wind projects (20%) or buying the electricity from wind projects (27%) that, in total, represent 47% of the new capacity installed last year (with the 47% split between 34% IOU and 12% POU). On a cumulative basis, utilities own (15%) or buy (48%) power from 63% of all wind power capacity installed in the United States (with the 63% split between 43% IOU and 20% POU, with the POU category including community choice aggregators (CCAs)).
|
100% |
|
100% |
2018 Capacity by |
||
Capacity |
90% |
|
90% |
|
||
|
|
Off-Take Category |
||||
80% |
|
80% |
|
|||
|
|
|
|
|||
70% |
|
70% |
|
|
|
|
Installed |
|
|
Merchant: |
IOU: |
||
60% |
|
60% |
|
|||
|
|
1,776 MW |
2,616 MW |
|||
50% |
|
50% |
|
|||
|
|
(23%) |
(34%) |
|||
Cumulative |
|
|
||||
40% |
Merchant/Quasi-Merchant |
40% |
|
Retail: |
|
|
|
On-Site |
|
|
|
||
30% |
30% |
|
1,794 MW |
|
||
Direct Retail |
|
POU: |
||||
20% |
Power Marketer |
20% |
|
(24%) |
||
|
|
923 MW |
||||
of |
10% |
Undisclosed |
10% |
|
|
(12%) |
% |
POU |
|
|
|
||
|
0% |
IOU |
0% |
Power Marketer |
Undisclosed |
|
|
1998 1999 2000 2001 2002 2003 2004 2005 2006 2007 2008 2009 2010 2011 2012 2013 2014 2015 2016 2017 2018 |
|||||
|
|
|
|
212 MW (3%) |
252 MW (3%) |
|
|
|
|
|
Onsite: 17 MW (0%) |
||
|
|
|
|
|
||
Source: Berkeley Lab estimates based on AWEA WindIQ
Figure 19. Cumulative and annual (2018) wind power capacity categorized by power off-take arrangement
Merchant/quasi-merchant projects accounted for 23% of all new 2018 capacity and 23% of cumulative capacity. Merchant/quasi-merchant projects are those whose electricity sales revenue is tied to short-term contracts and/or wholesale spot electricity market prices (with the resulting price risk commonly hedged over a 10to 12-year period30) rather than being locked in through a long-term PPA. Most of these projects are located within ERCOT in Texas, though there are some merchant/quasi-merchant projects within other markets, including PJM, MISO, SPP, and NYISO.
Direct retail purchasers of wind power, including a diverse and growing set of corporate and non-corporate offtakers, are supporting 1,794 MW or 24% of the new wind power capacity installed in the United States in 2018 (up from 10% of new capacity installed in 2015, but the same share as in both 2016 and 2017). Direct retail sales should continue to represent a sizable market in coming years, based on AWEA (2019a) estimates that 49% of all wind PPAs that were executed in 2018 were with non-utility purchasers (compared to 40% in 2017, 39% in 2016, 52% in 2015, and 18% for 2014—not all of which have yet achieved commercial operations).
Power marketers were very active throughout the first decade of this century following the initial wave of electricity market restructuring, but their influence has waned in recent years: just 3% of 2018 and 6% of cumulative wind power capacity in the United States sells to power marketers, down from more than 20%
30 Hedges are often structured as a “fixed-for-floating” power price swap—a purely financial arrangement whereby the wind power project swaps the “floating” revenue stream that it earns from spot power sales for a “fixed” revenue stream based on an agreedupon strike price. For some projects, the hedge is structured in the natural gas market rather than the power market.
22

vk.com/id446425943
2018 Wind Technologies Market Report
(cumulative) in the early 2000s. Power marketers are defined here to include commercial intermediaries that purchase power under contract and then resell that power to others.31
Finally, just 17 MW of the wind power additions in 2018 that used turbines larger than 100 kW were interconnected on the customer side of the utility meter, with the power being consumed on site rather than sold.32
31These intermediaries include the wholesale marketing affiliates of large IOUs, which may buy wind on behalf of their load-serving affiliates.
32For more information on distributed wind, see the U.S. Department of Energy’s 2018 Distributed Wind Market Report: https://energy.gov/eere/wind/downloads/2018-distributed-wind-market-report
23