


vk.com/id446425943
2018 Wind Technologies Market Report
6 Cost Trends
This chapter presents empirical data on both the upfront and operating costs of wind projects in the United States. It begins with a review of wind turbine prices, followed by total installed project costs, and then finally operations and maintenance (O&M) costs. Sample size varies among these different datasets, and is therefore discussed in each section of this chapter.
Wind turbine prices remained well below levels seen a decade ago
Wind turbine prices have dropped substantially since 2008, despite continued technological advancements that have yielded increases in hub heights and especially rotor diameters. Further cost decreases occurred in 2018, with wind turbines sold at price points similar to the early 2000s.
Figure 45 depicts wind turbine transaction prices from a variety of sources: (1) Vestas, SGRE, and Nordex, on those companies’ global average turbine pricing, as reported in corporate financial reports; (2) BNEF (2018a) and MAKE (2018), on those companies’ turbine price indices by contract signing date; and (3) 122 U.S. wind turbine transactions totaling 30,780 MW announced from 1997 through 2018, as previously collected by Berkeley Lab.51 Wind turbine transactions can differ in the services included (e.g., whether towers are provided, the length of the service agreement, etc.), turbine characteristics (and therefore performance), and the timing of future turbine delivery, driving some of the observed intra-year variability in transaction prices. Most of the prices and transactions reported in the figure are inclusive of towers, and delivery to the site.
Sources: Berkeley Lab, Vestas, SGRE, BNEF, MAKE
Figure 45. Reported wind turbine transaction prices over time
51 Sources of turbine price data for these 122 transactions vary, and include financial and regulatory filings, as well as press releases and news reports. Most of the transactions include turbines, towers, delivery to site, and limited warranty and service agreements, but the precise content of many of the individual transactions is not known.
49

vk.com/id446425943
2018 Wind Technologies Market Report
After hitting a low of roughly $800/kW from 2000 to 2002, average wind turbine prices increased by more than $800/kW through 2008, rising to an average of greater than $1,600/kW. This increase in turbine prices was caused by several factors, including a decline in the value of the U.S. dollar relative to the Euro; increased materials, energy, and labor input prices; a general increase in turbine manufacturer profitability due in part to strong demand growth; and increased costs for turbine warranty provisions (Moné et al. 2017).
Since 2008, wind turbine prices have steeply declined, reflecting a reversal of some of the previously mentioned underlying trends that had earlier pushed prices higher (Moné et al. 2017) as well as increased competition among manufacturers and significant cost-cutting measures on the part of turbine and component suppliers. As shown in Figure 45, data signal average pricing in the range of $700/kW to $900/kW.
Overall, these figures suggest price declines of roughly 50% since 2008. Moreover, these declines have been coupled with improved turbine technology (e.g., the recent growth in average hub heights and rotor diameters shown in Chapter 4) and, in some cases, more favorable terms for turbine purchasers (e.g., more-stringent performance guarantees). These turbine price trends have exerted downward pressure on total project costs and wind power prices, whereas increased rotor diameters and hub heights are improving capacity factors and further reducing wind power prices. At the same time, it is important to acknowledge that this downward trend is compared to a 2008 peak in the market in terms of turbine pricing, and that looking back farther in time, turbine prices have only recently fallen back to where they were in the early 2000s.
Lower turbine prices have driven reductions in reported installed project costs
Berkeley Lab also compiles data on the total installed cost of wind projects in the United States, including data on 44 projects completed in 2018 totaling 5,676 MW, or 75% of the wind power capacity installed in that year. In aggregate, the dataset (through 2018) includes 975 completed wind power projects in the continental United States totaling 82,975 MW and equaling roughly 86% of all wind power capacity installed at the end of 2018.
In general, reported project costs reflect turbine purchase and installation, balance of plant, and any substation and/or interconnection expenses. Data sources are diverse, however, and are not all of equal credibility, so emphasis should be placed on overall trends in the data rather than on individual project-level estimates.
As shown in Figure 46, the average installed costs of projects declined from the beginning of the U.S. wind industry in the 1980s through the early 2000s,52 and then increased—reflecting turbine price changes—through the latter part of the last decade. Whereas turbine prices peaked in 2008/2009, however, project-level installed costs peaked in 2009/2010, with declines since that time. It is not surprising that changes in average installed project costs would lag behind changes in average turbine prices, as this reflects the normal passage of time between when a turbine supply agreement is signed (the announcement date in Figure 45) and when those turbines are actually installed and commissioned (the commercial operations date in Figure 46).
52 Although our sample size in the 1980s and 1990s is relatively sparse compared to more recent years, for the most part, the individual project-level data and capacity-weighted averages for projects built in the 1980s and 1990s are consistent with average cost data for a subset of those years reported by the California Energy Commission (1988) and Gipe (1995).
50

vk.com/id446425943
2018 Wind Technologies Market Report
Installed Project Cost (2018 $/kW)
7,000 |
Interior (55.1 GW) |
|
6,000 |
West (12.5 GW) |
|
Great Lakes (9.5 GW) |
||
|
||
5,000 |
Northeast (4.7 GW) |
|
Southeast (1.1 GW) |
||
|
||
4,000 |
Capacity-Weighted Average |
|
|
3,000
2,000
1,000
0
1982198319841985198619871988198919901991199219931994199519961997199819992000200120022003200420052006200720082009201020112012201320142015201620172018 Commercial Operation Date
Sources: Berkeley Lab (some data points suppressed to protect confidentiality), Energy Information Administration
Figure 46. Installed wind power project costs over time
In 2018, the capacity-weighted average installed project cost within our sample stood at roughly $1,470/kW. This is down nearly $1,000/kW or 40% from the average reported costs in 2009 and 2010, but is roughly on par with the installed costs experienced in the early 2000s. All of the lowest-cost projects in recent years are located in the Interior region, which dominates the sample and where average costs have fallen by more than $1,000/kW since 2010. Early indications from a limited sample of 14 projects (totaling 2.9 GW) currently under construction and anticipating completion in 2019 suggest that capacity-weighted average installed costs in 2019 will be slightly lower than in 2018, with some developers reporting costs in the $1,100–$1,250/kW range.
Installed costs differed by project size and turbine size
Installed costs exhibit economies of scale, which are especially evident when moving from smallto mediumsized projects. Figure 47 shows that among the sample of projects installed in 2018, there is a substantial drop in per-kW average installed costs when moving from projects of 5 MW or less to projects in the 20–50 MW range. Economies of scale continue, though to a lesser degree, as project size increases beyond 50 MW.
51

vk.com/id446425943
2018 Wind Technologies Market Report
|
5,000 |
|
|
|
Capacity-Weighted Average Project Cost |
||
|
|
|
|
|
|||
$/kW) |
|
|
|
|
Individual Project Cost |
|
|
4,000 |
|
|
|
|
|
|
|
|
|
|
|
|
|
|
|
(2018 |
|
|
|
|
Sample includes projects built in 2018 |
||
3,000 |
|
|
|
|
|
|
|
Cost |
|
|
|
|
|
|
|
|
|
|
|
|
|
|
|
Project |
2,000 |
|
|
|
|
|
|
Installed |
1,000 |
|
|
|
|
|
|
|
|
|
|
|
|
|
|
|
0 |
≤5 MW |
5-20 MW |
20-50 MW |
50-100 MW |
100-200 MW |
>200 MW |
Project size: |
|||||||
|
# of MW: |
33 MW |
0 MW |
161 MW |
220 MW |
2,235 MW |
3,026 MW |
Source: Berkeley Lab
Figure 47. Installed wind power project costs by project size: 2018 projects
Another way to look for economies of scale is by turbine size, on the theory that a given amount of wind power capacity may be built less expensively using fewer, larger turbines. Figure 48 explores this relationship and finds mixed results. On a $/kW basis, projects using larger turbines (in the 2–2.5 MW and 2.5–3 MW bins) do appear to be progressively less-expensive on average than projects using smaller turbines (of between 1.5 and 2 MW). But, the trend ends with projects using turbines of 3 MW or larger—partly due to a number of single-turbine projects using 3 MW turbines installed in 2018 at the same $5,000/kW cost.53
|
5,000 |
|
Capacity-Weighted Average Project Cost |
|
|
$/kW) |
|
|
|
||
|
|
Individual Project Cost |
|
|
|
|
|
|
|
|
|
(2018 |
4,000 |
|
|
|
|
|
|
Sample includes projects built in 2018 |
|
||
|
|
|
|
||
Cost |
3,000 |
|
|
|
|
|
|
|
|
|
|
Project |
2,000 |
|
|
|
|
Installed |
1,000 |
|
|
|
|
|
|
|
|
|
|
|
0 |
≥1.5& <2MW |
≥2&<2.5MW |
≥2.5& <3MW |
≥3&<3.5MW |
Turbine size: |
|||||
|
# of MW: |
33 MW |
2,813 MW |
1,843 MW |
987 MW |
Source: Berkeley Lab
Figure 48. Installed wind power project costs by turbine size: 2018 projects
53 Notwithstanding these small, single-turbine projects using large turbines, in general there is likely to be some correlation between turbine size and project size, at least at the low end of the range of each. As such, Figure 47 and Figure 48 could both be reflecting the same influence, making it difficult to tease out the unique influences of turbine size from project size. The same challenges exist when considering regional differences in costs, as the largest projects tend to be built in the lowest-cost Interior of the country—making it difficult to discern the degree to which cost differences are determined by project size or region.
52
vk.com/id446425943
2018 Wind Technologies Market Report
Installed costs differed by region
As intimated earlier in Figure 46, regional differences in average project costs are also apparent and may occur due to variations in labor costs, development costs, transportation costs, siting and permitting requirements and timeframes, and other balance-of-plant and construction expenditures—as well as variations in the turbines deployed in different regions (e.g., use of low-wind-speed technology in regions with lesser wind resources). Considering only projects in the sample that were installed in 2018, Figure 49 breaks out project costs among four of the five regions defined in Figure 1.54 The Interior region—which tends to feature larger projects on flatter terrain—was the lowest-cost region on average, with an average cost of $1,400/kW, while the Northeast—which tends to feature smaller projects on complex terrain—was the highest-cost region in 2018.55 Two of the four regions have very limited sample size, so extrapolations based on these data should be treated with care. Nonetheless, outside of the Interior region, the average cost in 2018 was $1,740/kW.
Installed Project Cost (2018 $/kW)
5,000 |
Capacity-Weighted Average Project Cost |
|
|
|
|
|
|
||
|
Individual Project Cost |
|
|
|
4,000 |
Capacity-Weighted Average Cost, Total U.S. |
|
|
|
|
Sample includes projects built in 2018 |
|
|
|
3,000 |
|
|
|
|
2,000 |
|
|
|
|
1,000 |
|
|
|
|
0 |
Interior |
Great Lakes |
West |
Northeast |
|
||||
|
4,559 MW |
881 MW |
135 MW |
101 MW |
Source: Berkeley Lab
Figure 49. Installed wind power project costs by region: 2018 projects
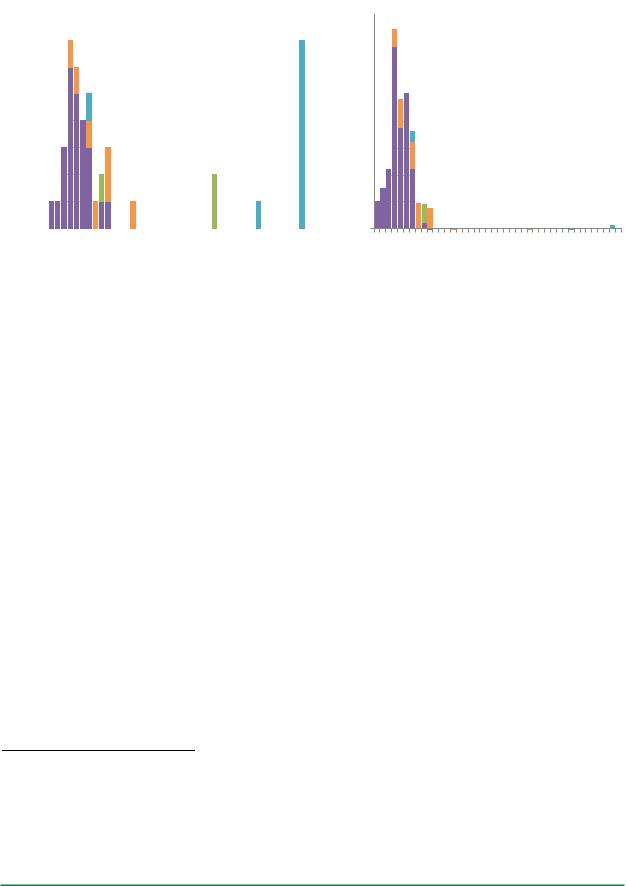
Figure 50 shows two histograms that present the distribution of installed project costs among 2018 projects, in terms of both number of projects and capacity. Most of the projects—and most of the low-cost projects—are located in the Interior region, where the distribution is centered on the $1,300–$1,400/kW bins. Projects in other regions generally have higher costs (a number of the high-cost projects shown in the left half of the figure are not visible in the right half because their capacity is very small).
54For reference, the 96,433 MW of wind installed in the United States at the end of 2018 is apportioned among the five regions shown in Figure 1 as follows: Interior (68%), West (15%), Great Lakes (11%), Northeast (5%), and Southeast (1%). The remaining installed U.S. wind power capacity is located in Hawaii, Alaska, and Puerto Rico and is typically excluded from our analysis sample due to the unique issues facing wind development in these three isolated states/territories.
55Graphical presentation of the data in this way should be viewed with some caution, as numerous other factors also influence project costs, and those are not controlled for in Figure 49.
53
vk.com/id446425943
2018 Wind Technologies Market Report
|
8 |
|
|
|
|
|
|
|
|
|
|
|
|
|
|
|
|
|
|
|
|
|
|
|
|
|
|
|
|
|
|
|
|
|
|
|
|
|
|
|
|
|
|
|
|
|
|
|
|
|
|
|
|
|
|
|
|
|
|
|
|
|
|
|
|
|
|
|
|
|
|
|
|
|
|
|
|
|
|
|
|
|
|
|
|
|
|
|
|
|
|
|
|
|
|
|
|
|
|
|
7 |
|
|
|
|
|
|
|
|
|
|
|
|
|
|
|
|
|
|
|
|
|
|
|
|
|
|
|
|
|
|
|
|
|
|
|
|
|
|
|
|
|
|
|
|
|
|
|
|
|
|
|
|
|
|
|
Northeast |
|
|
|
|
|
|
|
|
|
|
|
|
|
|
|
|
||||||||||||||||||||||||||
|
|
|
|
|
|
|
|
|
|
|
|
|
|
|
|
|
|
|
|
|
|
|
|
|
|
|
|
|
|
|
|
|
|
|
|
|
|
|
|
|
|
|
|
|
|
|
|
|
|
|
|
|
|
|
|
|
|
|
|
|
|
|
|
|
|
|
|
|
|
|
|
||||||||||||||||||||||||||||
|
|
|
|
|
|
|
|
|
|
|
|
|
|
|
|
|
|
|
|
|
|
|
|
|
|
|
|
|
|
|
|
|
|
|
|
|
|
|
|
|
|
|
|
|
|
|
|
|
|
|
|
|
|
|
|
|
|
|
|
|
|
|
|
|
|
|
|
|
|
|
|
||||||||||||||||||||||||||||
|
|
|
|
|
|
|
|
|
|
|
|
|
|
|
|
|
|
|
|
|
|
|
|
|
|
|
|
|
|
|
|
|
|
|
|
|
|
|
|
|
|
|
|
|
|
|
|
|
|
|
|
|
|
|
|
Great Lakes |
|
|
|
|
|
|
|
|
|
|
|
|
|
|
|
|
|||||||||||||||||||||||||||
ProjectsofNumber |
6 |
|
|
|
|
|
|
|
|
|
|
|
|
|
|
|
|
|
|
|
|
|
|
|
|
|
|
|
|
|
|
|
|
|
|
|
|
|
|
|
|
|
|
|
|
|
|
|
|
|
|
|
|
|
|
|
|
|
|
|
|
|
|
|
|
|
|
|
|
|
|
MWofNumber |
|||||||||||||||||||||||||||
|
|
|
|
|
|
|
|
|
|
|
|
|
|
|
|
|
|
|
|
|
|
|
|
|
|
|
|
|
|
|
|
|
|
|
|
|
|
|
|
|
|
|
|
|
|
|
|
|
|
|
|
|
|
|
|
|
|
|
|
|
|
|
|
|
|
|
|
|
|
||||||||||||||||||||||||||||||
|
|
|
|
|
|
|
|
|
|
|
|
|
|
|
|
|
|
|
|
|
|
|
|
|
|
|
|
|
|
|
|
|
|
|
|
|
|
|
|
|
|
|
|
|
|
|
|
|
|
|
|
|
|
|
|
|
|
|
|
|
|
|
|
|
|
|
|
|
|
||||||||||||||||||||||||||||||
5 |
|
|
|
|
|
|
|
|
|
|
|
|
|
|
|
|
|
|
|
|
|
|
|
|
|
|
|
|
|
|
|
|
|
|
|
|
|
|
|
|
|
|
|
|
|
|
|
|
|
|
|
|
|
|
|
West |
|
|
|
|
|
|
|
|
|
|
|
|
|
|
|
||||||||||||||||||||||||||||
|
|
|
|
|
|
|
|
|
|
|
|
|
|
|
|
|
|
|
|
|
|
|
|
|
|
|
|
|
|
|
|
|
|
|
|
|
|
|
|
|
|
|
|
|
|
|
|
|
|
|
|
|
|
|
|
|
|
|
|
|
|
|
|
|
|
|
|
|
|
|
|
||||||||||||||||||||||||||||
|
|
|
|
|
|
|
|
|
|
|
|
|
|
|
|
|
|
|
|
|
|
|
|
|
|
|
|
|
|
|
|
|
|
|
|
|
|
|
|
|
|
|
|
|
|
|
|
|
|
|
|
|
|
|
|
|
|
|
|
|
|
|
|
|
|||||||||||||||||||||||||||||||||||
|
|
|
|
|
|
|
|
|
|
|
|
|
|
|
|
|
|
|
|
|
|
|
|
|
|
|
|
|
|
|
|
|
|
|
|
|
|
|
|
|
|
|
|
|
|
|
|
|
|
|
|
|
|
|
|
|
|
|
|
|
|
|
|
|
|
|
|
|
|
|
|
||||||||||||||||||||||||||||
|
4 |
|
|
|
|
|
|
|
|
|
|
|
|
|
|
|
|
|
|
|
|
|
|
|
|
|
|
|
|
|
|
|
|
|
|
|
|
|
|
|
|
|
|
|
|
|
|
|
|
|
|
|
|
|
|
|
Interior |
|
|
|
|
|
|
|
|
|
|
|
|
|
|
|
|
||||||||||||||||||||||||||
|
|
|
|
|
|
|
|
|
|
|
|
|
|
|
|
|
|
|
|
|
|
|
|
|
|
|
|
|
|
|
|
|
|
|
|
|
|
|
|
|
|
|
|
|
|
|
|
|
|
|
|
|
|
|
|
|
|
|
|
|
|
|
|
|
|
|
|
|
|
|
|
||||||||||||||||||||||||||||
|
|
|
|
|
|
|
|
|
|
|
|
|
|
|
|
|
|
|
|
|
|
|
|
|
|
|
|
|
|
|
|
|
|
|
|
|
|
|
|
|
|
|
|
|
|
|
|
|
|
|
|
|
|
|
|
|
|
|
|
|
|
|
|
|
|
|
|
|
|
|
|
||||||||||||||||||||||||||||
|
3 |
|
|
|
|
|
|
|
|
|
|
|
|
|
|
|
|
|
|
|
|
|
|
|
|
|
|
|
|
|
|
|
|
|
|
|
|
|
|
|
|
|
|
|
|
|
|
|
|
|
|
|
|
|
|
|
|
|
|
|
|
|
|
|
|
|
|
|
|
|
|
|
|
|
|
|
|
|
|
|
|
|
|
|
|
|
|
|
|
|
|
|
|
|
|
|
|
|
|
|
|
|
|
|
|
|
|
|
|
|
|
|
|
|
|
|
|
|
|
|
|
|
|
|
|
|
|
|
|
|
|
|
|
|
|
|
|
|
|
|
|
|
|
|
|
|
|
|
|
|
|
|
|
|
|
|
|
|
|
|
|
|
|
|
|
|
|
|
|
|
|
|
|
|
|
|
|
|
|
|
|
|
|
|
|
|
|
|
|
|
|
|
|
|
|
|
|
|
|
|
|
|
|
|
|
|
|
|
|
|
|
|
|
|
|
|
|
|
|
|
|
|
|
|
|
|
|
|
|
|
|
|
|
|
|
|
|
|
|
|
|
|
|
|
|
|
|
|
|
|
|
|
|
|
|
|
|
|
|
|
|
|
|
|
|
|
|
|
|
|
|
|
|
|
|
|
|
|
|
|
|
|
|
|
|
|
|
|
|
|
|
|
|
|
|
|
|
|
|
|
2 |
|
|
|
|
|
|
|
|
|
|
|
|
|
|
|
|
|
|
|
|
|
|
|
|
|
|
|
|
|
|
|
|
|
|
|
|
|
|
|
|
|
|
|
|
|
|
|
|
|
|
|
|
|
|
|
|
|
|
|
|
|
|
|
|
|
|
|
|
|
|
|
|
|
|
|
|
|
|
|
|
|
|
|
|
|
|
|
|
|
|
|
|
|
|
|
|
|
|
|
|
|
|
|
|
|
|
|
|
|
|
|
|
|
|
|
|
|
|
|
|
|
|
|
|
|
|
|
|
|
|
|
|
|
|
|
|
|
|
|
|
|
|
|
|
|
|
|
|
|
|
|
|
|
|
|
|
|
|
|
|
|
|
|
|
|
|
|
|
|
|
|
|
|
|
|
|
|
|
|
|
|
|
|
|
|
|
|
|
|
|
|
|
|
|
|
|
|
|
|
1 |
|
|
|
|
|
|
|
|
|
|
|
|
|
|
|
|
|
|
|
|
|
|
|
|
|
|
|
|
|
|
|
|
|
|
|
|
|
|
|
|
|
|
|
|
|
|
|
|
|
|
|
|
|
|
|
|
|
|
|
|
|
|
|
|
|
|
|
|
|
|
|
|
|
|
|
|
|
|
|
|
|
|
|
|
|
|
|
|
|
|
|
|
|
|
|
|
|
|
|
|
|
|
|
|
|
|
|
|
|
|
|
|
|
|
|
|
|
|
|
|
|
|
|
|
|
|
|
|
|
|
|
|
|
|
|
|
|
|
|
|
|
|
|
|
|
|
|
|
|
|
|
|
|
|
|
|
|
|
|
|
|
|
|
|
|
|
|
|
|
|
|
|
|
|
|
|
|
|
|
|
|
|
|
|
|
|
|
|
|
|
|
|
|
|
|
|
|
|
|
0 |
|
|
|
|
|
|
|
|
|
|
|
|
|
|
|
|
|
|
|
|
|
|
|
|
|
|
|
|
|
|
|
|
|
|
|
|
|
|
|
|
|
|
|
|
|
|
|
|
|
|
|
|
|
|
|
|
|
|
|
|
|
|
|
|
|
|
|
|
|
|
|
|
|
|
|
|
|
|
|
|
|
|
|
|
|
|
|
|
|
|
|
|
|
|
|
|
|
|
|
|
1000 1200 1400 1600 1800 2000 2200 2400 2600 2800 3000 3200 3400 3600 3800 4000 4200 4400 4600 4800 5000 |
|
|
|||||||||||||||||||||||||||||||||||||||||||||||||||||||||||||||||||||||||||||||||||||||||||||||
InstalledCost≥ (2018$/kW)
Source: Berkeley Lab
1600 |
|
|
|
|
|
|
|
|
|
|
|
|
|
|
|
|
|
|
|
|
|
|
|
|
|
|
|
1400 |
|
|
|
|
|
|
|
|
|
|
|
Northeast |
|
|
|
|
|
|
|
|
|
|
|
|
|
||
|
|
|
|
|
|
|
|
|
|
|
|
||
|
|
|
|
|
|
|
|
|
|
|
Great Lakes |
|
|
1200 |
|
|
|
|
|
|
|
|
|
|
|
|
|
|
|
|
|
|
|
|
|
|
|
|
|
||
|
|
|
|
|
|
|
|
|
|
|
|
||
1000 |
|
|
|
|
|
|
|
|
|
|
|
West |
|
|
|
|
|
|
|
|
|
|
|
|
|
||
|
|
|
|
|
|
|
|
|
|
||||
|
|
|
|
|
|
|
|
|
|
|
|
||
800 |
|
|
|
|
|
|
|
|
|
|
|
Interior |
|
|
|
|
|
|
|
|
|
|
|
|
|
||
600 |
|
|
|
|
|
|
|
|
|
|
|
|
|
|
|
|
|
|
|
|
|
|
|
|
|
|
|
|
|
|
|
|
|
|
|
|
|
|
|
|
|
|
|
|
|
|
|
|
|
|
|
|
|
|
|
400 |
|
|
|
|
|
|
|
|
|
|
|
|
|
|
|
|
|
|
|
|
|
|
|
|
|
|
|
200 |
|
|
|
|
|
|
|
|
|
|
|
|
|
|
|
|
|
|
|
|
|
|
|
|
|
|
0
100012001400160018002000220024002600280030003200340036003800400042004400460048005000 InstalledCost≥ (2018$/kW)
Figure 50. Histogram of installed costs by projects and MW: 2018 projects
Operations and maintenance costs varied by project age and commercial operations date
Operations and maintenance costs are an important component of the overall cost of wind energy and can vary substantially among projects. Unfortunately, publicly available market data on actual project-level O&M costs are not widely available. Even where data are available, care must be taken in extrapolating historical O&M costs given the dramatic changes in wind turbine technology that have occurred over time (see Chapter 4).
Berkeley Lab has compiled limited O&M cost data for 168 installed wind power projects in the United States, totaling 14,709 MW and with commercial operation dates of 1982 through 2017. These data cover facilities owned by both IPPs and utilities, although data since 2004 are exclusively from utility-owned projects and so may not be broadly representative. A full time series of O&M cost data, by year, is available for only a small number of projects; in all other cases, O&M data are available for just a subset of years of project operations. Although the data sources do not all clearly define what items are included in O&M costs, in most cases the reported values include the costs of wages and materials associated with operating and maintaining the wind project, as well as rent.56 Other ongoing expenses, including general and administrative expenses, taxes, property insurance, depreciation, and workers’ compensation insurance, are generally not included. As such, Figure 51 and Figure 52 are not representative of total operating expenses for wind power projects; the last paragraphs in this section include data from other sources that demonstrate higher total operating expenses. Given the scarcity, limited content, and varying quality of the data, the results that follow should be taken only as indicative of potential overall trends. Note finally that the available data are presented in $/kW-year terms, as if O&M represents only a fixed cost. In fact, O&M costs are in part variable and in part fixed; expressing O&M costs in units of $/MWh yields qualitatively similar results to those presented in this section.
56 The vast majority of the recent data derive from FERC Form 1, which uses the Uniform System of Accounts to define what should be reported under “operating expenses”—namely, those operational costs associated with supervision and engineering, maintenance, rents, and training. Though not entirely clear, there does appear to be some leeway within the Uniform System of Accounts for project owners to capitalize certain replacement costs for turbines and turbine components and report them under “electric plant” accounts rather than maintenance accounts.
54
vk.com/id446425943
2018 Wind Technologies Market Report
Figure 51 shows project-level O&M costs by commercial operation date.57 Here, each project’s O&M costs are depicted in terms of its average annual O&M costs from 2000 through 2018, based on however many years of data are available for that period. For example, for projects that reached commercial operation in 2017, only year 2018 data are available, and that is what is shown.58 Many other projects only have data for a subset of years during the 2000–2018 timeframe, so each data point in the chart may represent a different averaging period within the overall 2000–2018 timeframe. The chart highlights the 83 projects, totaling 11,062 MW, for which 2018 O&M cost data were available; those projects have either been updated or added to the chart since the previous edition of this report.
Source: Berkeley Lab; some data points suppressed to protect confidentiality
Figure 51. Average O&M costs for available data years from 2000 to 2018, by COD
The data exhibit considerable spread, demonstrating that O&M costs (and perhaps also how O&M costs are reported by respondents) are far from uniform across projects. However, Figure 51 also suggests that projects installed in the past decade have, on average, incurred lower O&M costs than those installed earlier. Specifically, capacity-weighted average 2000–2018 O&M costs for the 24 projects in the sample constructed in the 1980s equal $72/kW-year, dropping to $60/kW-year for the 37 projects installed in the 1990s, to $29/ kW-year for the 65 projects installed in the 2000s, and staying at $29/kW-year for the 42 projects installed since 2010.59,60 This drop in O&M costs may be due to a combination of at least two factors: (1) O&M costs
57For projects installed in multiple phases, the commercial operation date of the largest phase is used. For repowered projects, the date at which repowering was completed is used.
58Projects installed in 2018 are not shown because only data from the first full year of project operations (and afterwards) are used, which in the case of projects installed in 2018 would be year 2019.
59Operational expenditure data collected via an industry survey and reported in Wiser et al. (2019) are generally consistent with these cost ranges and trends. Also somewhat consistent with these observed O&M cost magnitudes (if not necessarily time trends), BNEF (2018b) reports that, globally, the average cost from a sample of initial full-service O&M contracts was $26.4/kWyear for those agreements signed in 2016, $20.5/kW-year in 2017, and $18.1/kW-year in 2018. North American contracts in 2018, meanwhile, had a reported average of just $15.4/kW-yr.
60If the data were expressed instead in terms of $/MWh, capacity-weighted average 2000–2018 O&M costs were $37/MWh for projects in the sample constructed in the 1980s, dropping to $25/MWh for projects constructed in the 1990s, to $11/MWh for projects constructed in the 2000s, and to $9/MWh for projects constructed since 2010.
55

vk.com/id446425943
2018 Wind Technologies Market Report
generally increase as turbines age, component failures become more common, and manufacturer warranties expire;61 and (2) projects installed more recently, with larger turbines, more sophisticated designs and servicing, and more-mature technology may experience lower overall O&M costs on a $/kW-year basis.
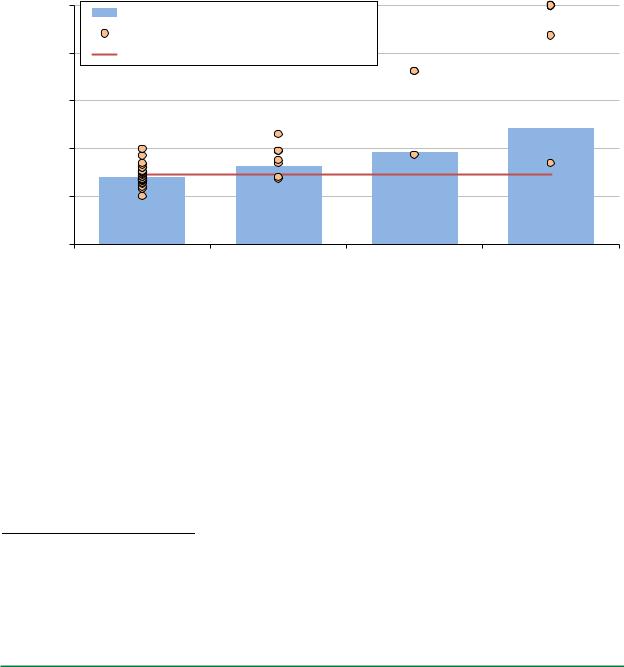
Although limitations in the underlying data do not permit the influence of these two factors to be unambiguously distinguished, to help illustrate key trends, Figure 52 shows median annual O&M costs over time, based on project age (i.e., the number of years since the commercial operation date) and segmented into three project-vintage groupings. Data for projects under 5 MW in size are excluded, to help control for the confounding influence of economies of scale, which reportedly can be significant (BNEF 2018b, Wiser et al. 2019). Note that, at each project age increment and for each of the three project vintage groups, the number of projects used to compute median annual O&M costs is limited and varies substantially.
Source: Berkeley Lab; medians shown only for groups of two or more projects, and only projects >5 MW are included
Figure 52. Median annual O&M costs by project age and commercial operation date
With these limitations in mind, Figure 52 shows an upward trend in project-level O&M costs as projects age, at least among the oldest projects in our sample—i.e., those built from 1998 to 2005—although the sample size after year 4 is relatively limited for these earliest projects. Projects built in 2006 or after, on the other hand, do not show a consistent trend in costs with project age. Figure 52 also shows that projects installed more recently have had, in general, lower O&M costs than those installed in earlier years (1998–2005), at least for the first 12 years of operation, with little difference in observed costs between the sample of projects built from 2006 to 2011 and those built from 2012 to 2017.
As indicated previously, the data presented in Figure 51 and Figure 52 include only a subset of total operating expenses. In comparison, the financial statements of EDP Renováveis (EDPR), a company that owned more than 5.2 GW of U.S. wind project assets at the end of 2018 (all of which have been installed since 2000), indicate markedly higher total operating costs. Specifically, EDPR (2019) reported total operating expenses of
61 Some of the projects installed most recently may still be within their turbine manufacturer warranty period, and/or may have partially capitalized O&M service contracts within their turbine supply agreement. In either case, reported O&M costs would be artificially low.
56

vk.com/id446425943
2018 Wind Technologies Market Report
$59/kW-year for its North American portfolio in 201862—twice the ~$29/kW-year average O&M cost reported above for the 107 projects in the Berkeley Lab data sample installed since 2000. Similarly, a U.S. wind industry survey of total operating costs shows that these expenses for recently installed projects are anticipated to average between $33/kW-year and $59/kW-year, with a mid-point of ~$44/kW-year (Wiser et al. 2019).
The disparity between total operating costs and those costs reported in the Berkeley Lab data sample reflects, in large part, differences in the scope of expenses reported. For example, EDPR breaks out its total U.S. operating costs in 2018 ($59/kW-year) into three categories: supplies and services, which “includes O&M costs” ($34/kW-year); personnel costs ($12/kW-year); and other operating costs, which “mainly includes operating taxes, leases, and rents” ($12/kW-year). Among these three categories, the $34/kW-year for supplies and services is probably closest in scope to the Berkeley Lab data. The recent wind industry survey noted, meanwhile, demonstrates that turbine O&M is expected to constitute less than half of total operating costs (Wiser et al. 2019).
62 Though not entirely clear, EDPR’s reported operating expenses may exclude any repair or replacement costs that have been capitalized rather than expensed. Also, at the end of 2018, EDPR’s North American portfolio consisted of 5,242 MW of wind and 90 MW of PV in the United States, along with 30 MW of wind in Canada and 200 MW of wind in Mexico. Hence, reported North American operating costs are neither entirely U.S.-based nor entirely for wind.
57