
World Bank - Commodity Market Outlook_watermark
.pdf
vk.com/id446425943
COMMODITY MARKETS OUTLOOK | APRI L 2019 EXECUTI VE SU MMARY 3
TABLE 1 Nominal price indexes and forecast revisions
|
Price Indexes (2010=100)1 |
|
Change (%) q/q |
|
Change (%) y/y |
|
Index revision3 |
|||||||
|
|
|
|
|
|
|
|
|
|
|
|
|
|
|
|
2016 |
2017 |
2018 |
2019f2 |
2020f2 |
|
2018Q4 |
2019Q1 |
2019 |
2020 |
|
2019f2 |
2020f2 |
|
|
|
|
|
|
|
|
|
|
|
|
|
|
|
|
Energy |
55 |
68 |
87 |
82 |
81 |
-9.5 |
-8.0 |
-5.4 |
-1.4 |
-9.6 |
-4.6 |
|||
|
|
|
|
|
|
|
|
|
|
|
|
|
|
|
Non-Energy3 |
79 |
84 |
85 |
83 |
85 |
-1.5 |
0.9 |
-2.1 |
1.4 |
-2.4 |
-2.2 |
|||
|
|
|
|
|
|
|
|
|
|
|
|
|
|
|
Agriculture |
87 |
87 |
87 |
84 |
86 |
-2.2 |
0.9 |
-2.6 |
1.7 |
-3.2 |
-3.2 |
|||
|
|
|
|
|
|
|
|
|
|
|
|
|
|
|
Fertilizers |
78 |
74 |
82 |
86 |
88 |
6.6 |
-5.4 |
4.8 |
1.7 |
3.6 |
3.4 |
|||
|
|
|
|
|
|
|
|
|
|
|
|
|
|
|
Metals and minerals |
63 |
78 |
83 |
81 |
82 |
-1.0 |
1.7 |
-1.9 |
0.8 |
-1.2 |
-0.8 |
|||
|
|
|
|
|
|
|
|
|
|
|
|
|
|
|
Precious metals4 |
97 |
98 |
97 |
100 |
103 |
0.7 |
6.1 |
2.6 |
3.1 |
4.0 |
7.8 |
|||
|
|
|
|
|
|
|
|
|
|
|
|
|
|
|
Memorandum items |
|
|
|
|
|
|
|
|
|
|
|
|
|
|
|
|
|
|
|
|
|
|
|
|
|
|
|
|
|
Crude oil ($/bbl) |
43 |
53 |
68 |
66 |
65 |
-11.9 |
-6.0 |
-3.4 |
-1.5 |
-8.0 |
-4.0 |
|||
|
|
|
|
|
|
|
|
|
|
|
|
|
|
|
Gold ($/toz) |
1,249 |
1,258 |
1,269 |
1,310 |
1,360 |
1.3 |
6.1 |
3.2 |
3.8 |
65.1 |
129.0 |
|||
|
|
|
|
|
|
|
|
|
|
|
|
|
|
|
Source: World Bank.
Notes: (1) Numbers may differ from tables A.1-4 due to rounding. (2) "f" denotes forecasts. (3) Denotes revision to the forecasts from the October 2018 report (expressed as change in index value except for $/bbl for crude oil, and $/toz for gold). (4) The non-energy price index excludes precious metals. See Appendix C for definitions of prices and indexes.
vk.com/id446425943

vk.com/id446425943
SPECIAL FOCUS
Food Price Shocks:
Channels and Implications
vk.com/id446425943
vk.com/id446425943
C O M M O DI T Y M ARKE T S O U T LOO K | AP RI L 2 0 1 9 |
S P EC I AL F O CU S |
7 |
|
|
|
Food Price Shocks: Channels and Implications
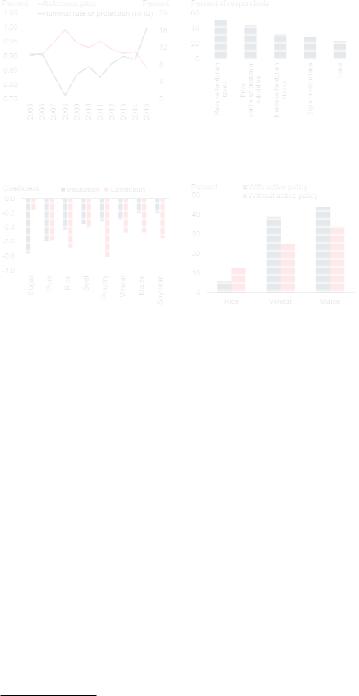
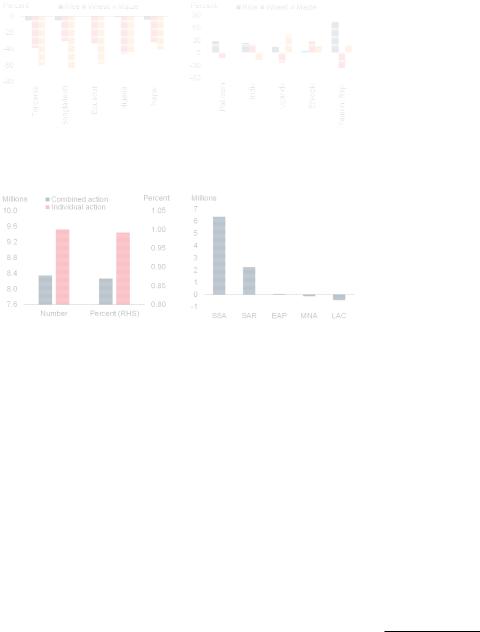
Countries sometimes use trade policies to dampen the impact of international food price swings on domestic markets to lessen the burden of adjustment on vulnerable population groups. While individual countries can succeed at insulating their domestic markets from fluctuations in global food prices, the collective intervention of many countries may amplify the movements of world prices. Insulating policies introduced during the 2010-11 food price spike may have accounted for 40 percent of the increase in the world price of wheat and one-quarter of the increase in the world price of maize. Combined with government policy responses, the 2010-11 food price spike tipped 8.3 million people (almost 1 percent of the world’s poor) into poverty. Instead of trade policies, targeted safety net interventions such as cash transfers, food and in-kind transfers, and risk management instruments can be more effective in mitigating the negative effects of food price shocks on poor households.
Introduction
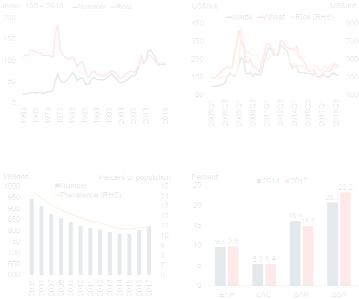
Food commodities have experienced a large and broad-based price cycle during the past two decades. Between 2000 and 2008, the World Bank’s Food Price Index rose by 80 percent in real terms (Figure SF1). While prices have come down from their 2008 highs, they are still 40 percent higher than their 1985-2000 average, a period characterized by moderate and stable prices.
Agricultural and food prices are expected to remain stable over the medium term. However, sharp price changes stemming from energy price fluctuations, adverse weather events, or trade tensions cannot be ruled out. First, higher-than- expected energy prices, a key input in the production of most agricultural commodities, could affect food prices, especially grains and oilseeds. Energy prices affect agricultural production costs directly (through fuel use) and indirectly (through fertilizer and other chemicals use). They also create incentives to shift production to biofuels. Second, El Niño episodes, such as the one in 2016-17, could disrupt commodity supplies, especially at a regional level, particularly in Central America, the Caribbean, and Southern Africa. Third, the growing frequency of extreme weather events increases the risk of disruption to food production, food availability, and access to food. Finally, policy measures introduced by major producers and exporters in response to higher price shocks could also affect prices (World Bank 2018).
Food price increases have important macroand microeconomic impacts through several channels.
At the macroeconomic level, food price increases raise inflation and contribute to terms of trade shocks. At the microeconomic level, for households that are net sellers of food products, rising food prices can increase real incomes. However, on average, higher food prices raise poverty, reduce nutrition, and curtail the consumption of essential services such as education and health care (World Bank 2011).
Countries often use policy interventions to dampen the domestic impact of international food price spikes and lessen the burden on vulnerable population groups. For example, during the 200708 food price spike, close to three-quarters of emerging market and developing economies (EMDEs) took policy actions to moderate the impact (World Bank 2009). In the event of food price increases, net food-importing countries usually intervene by lowering trade protection (typically tariffs) on food items, while net foodexporting countries impose export restrictions or bans. These policies are often complemented with social safety net programs such as cash transfers or school feeding programs.
To the extent that policy interventions reduce the transmission of international price surges to domestic markets, they achieve their objective. However, the combined intervention of many countries can exacerbate changes in international prices. Insulating policies introduced during price spikes encourage consumption and dampen incentives to increase production. In turn, this results in higher import demand and reduced export supply that can further drive up global prices. During price plunges, government
vk.com/id446425943
8 |
S P EC I AL F O CU S |
C O M M O DI T Y M ARKE T S O U T LOO K | AP RI L 2 0 1 9 |
|
|
|
FIGURE SF.1 Global food prices
Although food prices have declined considerably since their 2011 highs, they are still significantly above their lows of the early 2000s. Evidence points to a rise in undernourishment rates in the past two years, reversing the declining trend observed in the previous decade.
A. Global food prices, annual |
B. Global food prices, quarterly |
C. Global undernourishment |
D. Regional undernourishment |
Source: FAO; World Bank.
A. Based on yearly commodity price indexes between 1960-2017.
C.D. Undernourishment is defined a state, lasting for at least one year, of inability to acquire enough food, defined as a level of food intake insufficient to meet dietary energy requirements.
D. EAP = East Asia and Pacific, LAC = Latin America and the Caribbean, SAR = South Asia, and SSA = Sub-Saharan Africa.
Download data and charts.
interventions encourage exports that tend to depress world prices. Only countries that insulate themselves to an above-average degree can reduce price volatility in their domestic markets (Anderson, Martin, and Ivanic 2017).
In this context, this essay addresses the following questions: How do food price shocks affect EMDEs? How do countries intervene to reduce the impact of food price shocks? What was the impact of the 2010-11 food price spike on poverty?
The impact of food price shocks
At the macroeconomic level, a high share of agriculture and food in total output, consumption, employment, trade, and government revenues heightens the vulnerability of countries to volatility in international food prices.
•Reliance on food imports and production.
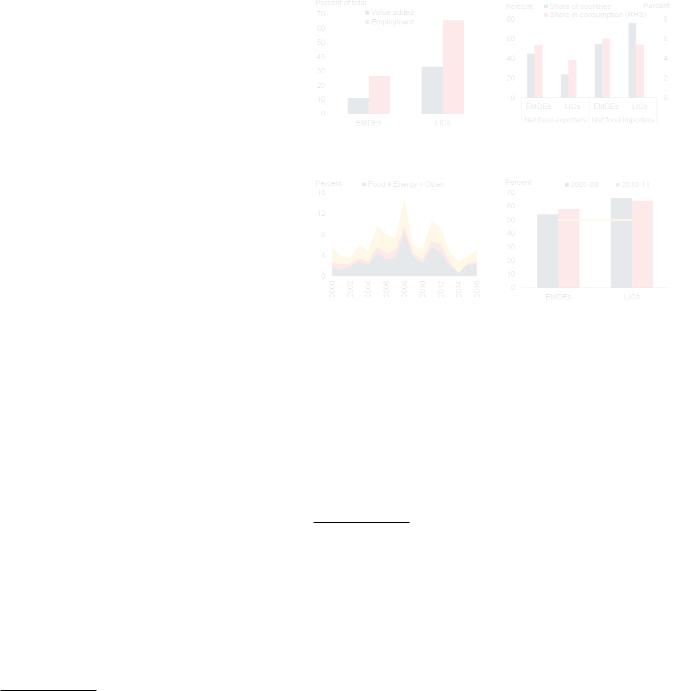
Agriculture accounts for close to one-third of total value added and two-thirds of total employment in low-income countries (LICs). This is almost three times as much as in the average EMDE (Figure SF2; Aksoy and Beghin 2004). In addition, more than threequarters of LICs are net food importers, compared to only half of EMDEs.
•Inflation. A rise in food prices increases headline consumer price inflation. For example, during the latest food price spikes, LIC inflation more than doubled, from 7 to 15 percent during 2007-2008 and from 5 to 11 percent during 2010-2011. The increase in EMDE inflation was less pronounced, rising from 7 to 11 percent during 2007-2008 and from 5 to 6 percent during 2010-2011. Food prices accounted disproportionately for these increases in inflation—about two-thirds in LICs and more than half in EMDEs.
•Terms of trade. Sharp increases in food prices can result in significant adverse terms of trade shocks that lower growth, especially in countries that are large net importers of food. In heavy food importers, the exchange rate depreciation typically associated with adverse terms of trade shocks can compel central banks to tighten monetary policy, which can further lower growth. Indeed, during the 2007-08 food price spike, close to half of EMDE central banks responded to rising inflation and currency depreciation by tightening monetary policy.
•Fiscal policy. Absent stabilizing fiscal arrangements, heavy reliance on food and agricultural trade can contribute to volatility in public finances and erode fiscal sustainability. When food prices fall, revenue losses in the agricultural sector are exacerbated by political pressures to subsidize food production. Food price spikes may also cause sociopolitical instability, including political unrest (Barrett 2013).
At the microeconomic level, a high share of net food buyers among the poorest segments of society
vk.com/id446425943
C O M M O DI T Y M ARKE T S O U T LOO K | AP RI L 2 0 1 9 |
S P EC I AL F O CU S |
9 |
|
|
|
heightens the adverse effects of food price spikes on poverty and income inequality. Rising food prices impact households through price and income channels. They can reduce household purchasing power via higher food prices. However, they can also raise income generated from food production. The overall impact on poverty and income inequality depends on the relative magnitude of these effects for households in different segments of the income distribution.
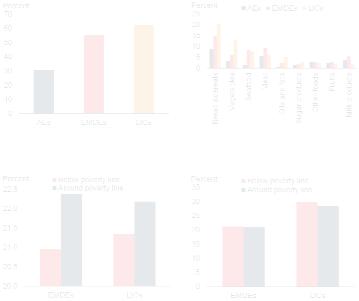
•Food consumption in the average household. In LICs, households spend, on average, close to 60 percent of their income on food (Figure SF3). More than one-third of LIC household consumption expenditure on food is spent on staple foods such as cereals and vegetables. These staple foods are considerably more exposed to international price volatility than domestically processed food products.
•Net food buyers and sellers. For households that are net sellers of agricultural and food products, rising food prices raise incomes. In contrast, poor urban households who are typically net buyers of food spend a large share of their consumption expenditure on food (Aksoy and Hoekman 2010). On average, many of the poor in EMDEs and LICs are net buyers of food. As a result, food price spikes tend to raise poverty, reduce nutrition, and cut consumption of essential services such as education and health care.1 In extreme cases, food price spikes can lead to food insecurity and hunger, with severe adverse long-term impacts on human capital.
Government policy responses. In the event of large swings in global food prices, governments are confronted with difficult policy choices. One option is to allow domestic prices to adjust to world food price changes, exposing domestic consumers and producers to changes in their real incomes. Such an adjustment, however, may raise inflation in the short run, and in countries where inflation expectations are poorly anchored, in the
1 If food price spikes are associated with a positive, large, and quick agricultural supply response they can lead to a reduction in poverty (Headey 2018).
FIGURE SF.2 Macroeconomic channels of transmission from global food price changes
A high share of agriculture and food in total output, consumption, employment, trade, and government revenues heightens the vulnerability of countries to sharp movements in international food prices.
A. Share of agriculture in economy |
B. Net food imports and exports |
C. Inflation in LICs |
D. Contribution of food prices to |
|
inflation |
Source: World Bank.
A.Based on a sample of 93 non-LIC EMDEs and 21 LICs. Averages for 2010-16.
B.Blue bars show the share of non-LIC EMDEs or LICs in which food imports exceed food exports (“Net food importers”) or food imports fall short of food exports (“Net food exporters”). Red bars show net food imports relative to consumption in non-LIC EMDE and LIC food exporters and importers.
C.Average inflation based on a sample of 12 LICs.
D.Share of inflation accounted for by food price inflation.
Download data and charts.
medium to long run.2 Alternatively, governments can spare consumers or producers from these losses by reducing the transmission of international food price shocks to domestic markets.3 In practice, governments in EMDEs
2 The decline in real incomes associated with higher inflation could entail welfare losses (Gouel and Jean 2015; Freund and Ozden 2008; Giordani, Rocha, and Ruta 2016; Easterly and Fischer 2001). In principle, monetary policy tightening can offset inflationary effects from rising global food prices to ensure that rising food prices remain a purely relative price change and do not become entrenched in higher inflation. However, this would come at the cost of reduced economic activity (Lustig 2009).
3 Policymakers may also have a longer-term goal to protect (or to tax) domestic agents (Grossman and Helpman 1994). In empirical work based on political economy models, government interventions vary to reduce both the costs associated with adjusting prices and the costs of providing interventions that differ from the long-run political equilibrium (Anderson and Nelgen 2011; Ivanic and Martin 2014). The less-than-perfect pass through of world price shocks into domestic markets is explicitly considered.
vk.com/id446425943
10 |
S P EC I AL F O CU S |
C O M M O DI T Y M ARKE T S O U T LOO K | AP RI L 2 0 1 9 |
|
|
|
FIGURE SF.3 Microeconomic channels of transmission from global food price changes
A high share of net food buyers among the poorest segments of the population heightens the adverse effects of food price spikes on income distribution and poverty.
A. Share of food in total consumption |
B. Consumption expenditure by |
expenditure |
product of the poorest households |
C. Share of net food sellers |
D. Share of income generated by food |
Source: International Food Policy Research Institute; World Bank.
A.Indicates share of food in total consumption expenditure of households. Data is available for 19 AEs, 63 non-LIC EMDEs and 25 LICs. The base year of the household surveys differs but the data has been converted to a common reference year, 2010. The share of income spent on food is likely to be different.
B.Indicates the share of products in total household consumption expenditure. Data is available for 19 AEs, 63 non-LIC EMDEs and 25 LICs. The base year of the household surveys differs but the data has been converted to a common reference year, 2010. The share of income spent on food is likely to be different.
C.D. Averages weighted by the number of poor for a sample of 22 non-LIC EMDEs and 7 LICs. Poverty line is defined as $1.90/day.
Download data and charts.
tend to respond particularly strongly to sharp changes in the world prices of staple foods—such as rice, wheat and maize—to reduce the volatility of domestic prices. For staple foods, domestic price movements can diverge substantially from international price movements in the short run, but converge in the longer term.
Evolution of global and domestic food prices
Food price spikes during the 2000s. Domestic food prices are considerably less volatile than global food prices in the short run. However, over the longer term there is a tendency for domestic
prices to return to their original relationship with international prices. The movements of world and domestic staple food prices during the latest two food price spikes (2007-08 and 2010-11) resembled similar earlier episodes: world prices rose rapidly, while domestic prices rose only gradually. However, the 2010-11 spike was different from previous episodes in several aspects. The 2007-08 increase in food prices came after a long period of stability in food prices. In 2007-08, world prices of all staple foods increased steeply, led by rice.
Government interventions. During the 2007-08 food price spike, close to three-quarters of EMDEs took action to insulate their economies (World Bank 2009). The most commonly used interventions were reductions in taxes, including import duties and consumer taxes (Figure SF4). Net importers frequently intervened by lowering import tariffs or even by introducing import subsidies, while net exporters imposed export restrictions to dampen price increase. In contrast, the 2010-11 food price spike episode occurred when world markets and policies were still normalizing from the 2007-08 episode. Government interventions differed considerably across countries and across commodities. On average, policy actions actually contributed to a decline in the world price of rice.
•Rice. Between 2007Q1 and 2008Q2, world rice prices increased by 170 percent. This sharp increase reflected export restrictions introduced by major producers (e.g., India and Vietnam) motivated by food security concerns, panic buying by several large importers, a weak dollar, and record high oil prices, a major input into food production (Baffes and Haniotis 2016). During this episode, domestic markets were largely insulated (Ivanic and Martin 2008). By contrast, during the 2010-11 price spike, rice prices increased much less, about 30 percent between June 2010 and May 2012. In some countries, adverse supply conditions, combined with changes in non-tariff trade policies, resulted in domestic rice prices rising above world prices. Instead of policies aimed at insulating domestic markets, EMDEs
vk.com/id446425943
C O M M O DI T Y M ARKE T S O U T LOO K | AP RI L 2 0 1 9 |
S P EC I AL F O CU S |
11 |
|
|
|
typically implemented measures that raised domestic prices relative to world prices.
•Wheat. Between 2007Q1 and 2008Q2, world wheat prices increased by 75 percent, partly in response to lower-than-anticipated production caused by drought in Australia, Ukraine, and other major exporters. Strong policy intervention partially insulated domestic markets from the price spike and subsequent collapse in the aftermath of the global financial crisis. Similarly, during the 2010-11 event, world wheat prices more than doubled between June 2010 and May 2011. This time, the increase in world prices was partly driven by lower-than-expected production and exports in Kazakhstan, Russia, and Ukraine and excessive rains in Australia that damaged crops. Large orders from major wheat importers in the Middle East and North Africa added to price pressures.
•Maize. During the 2007-08 food price spike, the world price of maize rose by 50 percent, partly as a result of increasing U.S. demand for maize stimulated by mandatory targets for ethanol production. Similarly, during the 2010-11 episode, the world price of maize increased significantly. As in the case of wheat, adverse weather-related events in major maize exporting countries contributed to the jump in world prices. In contrast, many countries in Sub-Saharan Africa benefitted from excellent maize harvests, which in combination with unpredictable trade policies led to sharp falls in domestic prices.
Insulation of domestic food markets
Measuring the insulation of domestic markets.
Governments intervene to insulate domestic prices from global food price swings. The degree of insulation is quantified using an Error Correction Model that estimates the shortand long-run response of domestic food prices to global food commodity prices (Laborde, Lakatos, and Martin 2019). The model estimates the degree of insulation to global price changes in both the short run and long run. The sample includes annual data for 8 food commodity prices in 82
FIGURE SF.4 Food-related government policies
Insulation policies undertaken during the 2010-11 episode amplified the increase of world prices and accounted for about 40 percent of the increase in the world price of wheat and one-quarter of the increase in the world price of maize.
A. Interventions in agricultural |
B. Policy interventions during the |
markets |
2007-08 food price spike |
C. Insulation and correction |
D. Increase in world prices, 2010-11 |
coefficients |
|
Source: Ag-Incentives Database, Ivanic and Martin (2014), World Bank.
A.Nominal rate of protection is computed as the price difference between the farm gate price received by producers and an undistorted reference price at the farm gate level.
B.Percent of respondents based on a survey of 80 EMDEs.
C.D. Estimates based on an Error Correction Model described in Laborde, Lakatos, and Martin (2019). The coefficient of price insulation ranges from 0 for countries that do not insulate against the rise in world prices, to -1 for countries that adopt policies that fully insulate domestic markets. Based on data for 82 countries, of which 26 are advanced economies, 44 are non-LIC EMDEs, and 12 are LICs for the period 1955-2011.
Download data and charts.
countries, of which 44 are EMDEs and 12 are LICs, during 1955-2011.
Estimates of short-term insulation. Estimates point to considerable short-term insulation in markets for key staple foods such as rice and wheat (Figure SF4). Among these three grains, insulation is the highest for rice. In the short run, a 10 percent increase in global rice, wheat, and maize prices is associated with an increase in domestic prices of 6 percent, 7 percent, and 8 percent, respectively.4
4 BaHes, Kshirsagar, and Mitchell (2019) argue that domestic prices respond faster to regional prices than to the international benchmark.
vk.com/id446425943
12 |
S P EC I AL F O CU S |
C O M M O DI T Y M ARKE T S O U T LOO K | AP RI L 2 0 1 9 |
|
|
|
FIGURE SF.5 Government interventions during the 201011 food price spike and their poverty impact
The 2010-11 food price spike raised global poverty. The combined impact of all government interventions raised poverty worldwide, except in a few countries.
A. Decline in protection rates, |
B. Increase in protection rates, |
2010-11 |
2010-11 |
|
|
C. Global poverty impact of policy |
D. Regional poverty impact of the |
|
responses to the 2010-11 food price |
2010-11 food price shock |
|
shock |
|
|
|
|
|
Source: World Bank. |
|
A. Changes in the rates of protection are presented in the form: Ti = |
t/(1+t0), where t is the initial |
rate of protection (positive if an import tariff or export subsidy) and |
t is the change in this rate of |
protection. If the change in the rate of protection is negative during a period of rising world prices, countries are seeking to insulate their markets from the increase in prices. If it is positive, policymakers are compounding the increase in world prices with an increase in protection, which may be due to the correction of past “errors”: If domestic prices fall below policymakers’ desired long-run level of protection, or if a policy that insulated the domestic market from world markets and a subsequent exogenous shock—such as a harvest shortfall—has caused the domestic price to rise relative to the world price.
C.D. Based on estimates using the MIRAGRODEP computable general equilibrium model and assuming increases in the price of maize, rice, and wheat as represented in Figure SF.4.D. Based on a poverty line of $1.90/day.
C. EAP = East Asia and Pacific; LAC = Latin America and the Caribbean; MNA = Middle East and North Africa; SAR = South Asia; and SSA = Sub-Saharan Africa.
Download data and charts.
Effectiveness of insulating policy measures.
Certain types of interventions in markets for staple foods have raised volatility in domestic markets. For example, during the 2008-09 food price spike, several African countries intervened using food pricing, marketing, and trade policies to stabilize domestic maize markets. Countries that intervened most intensively experienced the highest domestic price volatility, mostly because of the ad hoc and unpredictable nature of these
interventions (Chapoto and Jayne 2009).5 The use of an export ban during food price spikes illustrates the tradeoff between different policy instruments:
•Ensuring food security. By restricting the sale of food for exports, an export ban increases domestic supply and dampens domestic food price increases. This can help net-food buyers access food.
•Alleviating poverty. Net food sellers are likely to be hardest-hit by price hikes caused by drought. An export ban reduces their ability to mitigate their production losses with higher incomes from higher prices. If these farmers are among the poorer segments of the income distribution, the export ban will likely increase poverty, as it did in Zambia during the 201617 El Niño event (Al-Mamun et al. 2017).
•Volatility. While export bans may alleviate price pressures during a specific situation, they affect domestic prices by preventing domestic shocks from being dissipated through changes in trade. If bans are backed up by stockholding measures they can be consistent with domestic price stabilization, perhaps at the cost of higher fiscal outlays (see Gouel, Gautam, and Martin 2016 for the case of India).
Synchronous policy measures. While individual countries can succeed at insulating their domestic markets from short-term fluctuations in global food prices, their combined policies could affect world prices. Government interventions tend to increase consumption and reduce production during price spikes and support production and discourage consumption during price plunges. During price spikes, this results in higher import demand (or lower exports) and, hence, even higher world prices. During price plunges, the
5 After abstaining from the use of interventions in staple food markets for several years, policymakers in eastern and southern Africa used extensively pricing, marketing, and trade policy tools during the 2015-16 agricultural season to contain the impact of an El Niñoinduced decline in output and food security (Al-Mamun et al. 2017; Tschirley and Jayne 2010).
