

World Bank - Commodity Market Outlook_watermark
.pdfvk.com/id446425943
C O M M O DI T Y M ARKE T S O U T LOO K | AP RI L 2 0 1 9 |
E N E RGY |
23 |
|
|
|
Natural gas
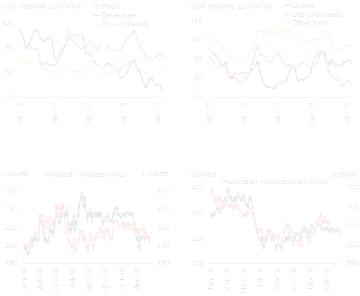
Natural gas prices have declined sharply since the start of the year, with the wedge between the three main spot prices narrowing dramatically (Figure 5). U.S. prices temporarily surged at the end of 2018, rising more than 50 percent to $4.6/mmbtu in November, before dropping below $3/mmbtu at the start of January 2019. The spike in prices was triggered by expectations of a colder-than- average winter, which was exacerbated by low inventories. Spot prices in Europe and Asia, which had risen in the second half of 2018, plunged in March. The fall was triggered by weaker demand due to mild weather and the restarting of nuclear power plants in Japan, as well as greater availability of liquefied natural gas (LNG).
Global exports of LNG have been rising steadily. Exports from the United States rose 50 percent to 3 bcf/d in 2018 and are expected to double to 6.1 bcf/d by the end of 2019. Surging production of natural gas in the U.S. has facilitated an increase in LNG exports, despite a 10 percent jump in U.S. natural gas consumption in 2018. LNG export capacity in Australia and Qatar has also increased substantially and is set to grow further.
Over the next two years prices are expected to recover from their current lows as demand picks up but remain below 2018 averages. Further ahead, the increase in LNG capacity is set to alter the composition of natural gas markets, which have historically seen prices linked to oil prices. Reflecting these developments, long-term forecasts for natural gas prices have been revised down, from $8/mmbtu to $7/mmbtu in Europe, and from $10/mmbtu to $8.5/mmbtu in Japan. The expansion of long-distance gas trade via LNG tankers will cause the price differentials between different locations to shrink.
Coal
Coal prices fell 7.6 percent in the first quarter of 2019 (q/q) following steep declines in the second half 2018. In advanced economies demand for coal declined in favor of natural gas, particularly for electricity generation. Seaborne prices have also
FIGURE 5 Coal and natural gas developments
Natural gas prices have been volatile over the past 12 months, and price differentials between the three benchmarks have shrunk on increased supply. Very low levels of inventories in the United States contributed to temporary price spikes in 2018. Coal prices also fell sharply in the first quarter of 2019, on lower natural gas prices and reduced demand from China and some other countries.
A. Natural gas prices |
B. U.S. natural gas inventories, |
|
deviation from 5-year average |
C. Coal prices |
D. Annual growth in coal demand |
Source: Bloomberg, BP Statistical Review, EIA, IEA, World Bank.
A.Range of quarterly average natural gas prices in Japan, Europe, and the United States, with prices in Japan systematically the highest and those in the United States the lowest. Data for 2019 Q2 show EIA expectations for LNG exports, and average prices for the first week of April 2019.
B.Lines show the deviation of inventories relative to their average for each month over the period 2013-2017. Last observation is April 12, 2019.
C.Last observation is March 2019.
D.2018 estimated using IEA growth rates.
Download data and charts.
been affected by China’s decision to curb imports of coal from Australia, its biggest supplier.
Coal prices are expected to partially recover from their current levels and average $94/mt in 2019, a 12.1 percent decline from 2018, reflecting the weakness in natural gas prices, as well as muted demand. The ongoing shift away from coal to natural gas in electricity generation is expected to continue. Risks are skewed to the downside, and include weaker global growth, and environmental policies aimed at reducing air pollution, primarily in China, as well as other countries such as India, which accounts for 11 percent of global demand for coal.
vk.com/id446425943
24 |
AG RI C U L T U RE AND F E RT I L IZ E RS |
C O M M O DI T Y M ARKE T S O U T LOO K | AP RI L 2 0 1 9 |
|
|
|
|
|
FIGURE 6 Agricultural price developments
Agricultural commodity prices stabilized in 2019 Q1 following declines in 2018. The factors that pushed prices down last year have moderated, including easing of trade tensions, lower plantings in the U.S., and stabilization of currencies of key exporters.
A. Agriculture price indexes |
B. Food price indexes |
C. Wheat and maize prices |
D. Soybean and soybean oil prices |
|
|
Source: Bloomberg, World Bank.
A.B. Last observation is March 2019.
C.D. Last observation is April 19, 2019.
Download data and charts.
Agriculture
Most agricultural commodity prices rose moderately in the first quarter of 2019, following considerable declines during the second half of last year. The World Bank’s Agriculture Price Index increased 0.9 percent in the quarter (q/q), as a 3.4 percent decline in beverages was balanced by moderate gains in all other categories. The index was still 5.6 percent lower than a year ago. Most of the factors that depressed prices last year have moderated, including easing of trade tensions and lower prospective plantings in the U.S. for next season’s crop. The index is expected to decline 2.6 percent in 2019 and increase 1.7 percent in 2020 due to lower production and higher fertilizer prices. Downside risks to the forecast emanate primarily from an escalation of trade tensions. On the upside, higher energy prices could lift the cost of energy-intensive crops, notably grains and oilseeds. Higher-than-projected demand for biofuels could also induce higher prices for some commodities.
Grains, oils, and meals
Recent developments
The World Bank’s Grain Price Index gained nearly 2 percent in the first quarter of 2019 (q/q), and is more than 1 percent higher than a year ago (Figure 6). Production estimates for 2018-19 have been revised upward throughout the season. According to the U.S. Department of Agriculture’s (USDA) latest assessment (April 2019), global supplies of the three main grains (wheat, maize, and rice) are projected to reach 3,126 million metric tons (mmt) this season (September 2018 to August 2019), nearly 1 percent higher than last season’s supplies.
Wheat prices, which gained 1 percent in the first quarter, are more than 10 percent higher than a year ago. Global wheat supplies tightened considerably this season, with production projected to be 4 percent lower compared to last season’s record of 763 mmt, according to the USDA. The decline—though less severe than originally estimated—is due to weather-related yield losses in key Eastern European and Central Asian producers. Global consumption of wheat is expected to decline marginally from last season, pushing the stocks-to-use ratio—a measure of supply availability relative to demand—down by 1 percentage point, but still the second highest ratio of the past two decades.
Maize prices rose 3 percent in the first quarter, following a 3 percent increase in Q4. The global maize crop for 2018-19, which has been revised gradually upward throughout the season, is projected to be almost 3 percent higher than 2017-18, according to the USDA, as lower output from the United States, the world’s top producer, will be more than offset by larger-than-expected crops from other key producers, including Argentina, the European Union, and Ukraine. Consumption of maize is projected to increase more than 3 percent, pushing the stocks-to-use ratio to 27.4 percent, a 5-year low. Such a low stock-to-use ratio would typically be cause for alarm, however ample supplies of other grains and oilseeds help provide a buffer (Figure 7).

vk.com/id446425943
C O M M O DI T Y M ARKE T S O U T LOO K | AP RI L 2 0 1 9 |
AG RI C U L T U RE AND F E RT I L IZ E RS |
25 |
|
|
|
Rice prices have been remarkably stable during the past three quarters, fluctuating between $400/mt and $410/mt, after plunging nearly 12 percent from May to July last year. Weather-related disruptions in Brazil and the Philippines have been offset by favorable conditions in most Asian rice producers, including India, Indonesia, Thailand, and Vietnam. Global rice production is projected to increase marginally in 2018-19 to 501 mmt, a slightly more optimistic outcome than earlier assessments. Global consumption is projected to increase by about 1 percent, resulting in a stock-to-use ratio of 35 percent, a 20-year high.
The World Bank’s Oil and Meals Price Index remained broadly stable in the first quarter of 2019 (q/q) but stands 14 percent lower than 2018 Q1. Although there was price weakness across the board last year, it was more pronounced in coconut, palm kernel, and palm oils, whose prices plunged by 42, 38, and 17 percent, respectively, from 2018 Q1 to 2019 Q1. Low prices reflect favorable harvests across all regions and, to a lesser extent, Chinese tariffs on soybeans (see October 2018 Commodity Markets Outlook).
The edible oil production outlook for the current season (ending September 2019) continues to look promising due to favorable growing conditions. Global output of the 17 major edible oils (including palm, soybean, and rapeseed, which together account for two-thirds of global output) is forecast to increase 2 percent in the 2018-19 season. More than two-thirds of the production gains are projected to come from palm oil. Indonesia and Malaysia are the primary producers of palm oil, and both are experiencing favorable weather conditions. Most of the remaining growth is expected from sunflower oil, due to good growing conditions in Ukraine and Russia, which together account for half of global output.
Global oilseed output for 2018-19 is also projected to rise, with supplies of the 10 major oilseeds projected to reach 578 mmt, up from last season’s 566 mmt. All of the growth is expected to come from soybeans, mostly from Argentina and, to a lesser extent, the United States.
Global soybean prices were also depressed by upwardly revised production estimates and weaker
FIGURE 7 Supply conditions for grains and edible oils
Despite some weather-related disruptions, supplies of most grains and edible oils are ample, keeping the stock-to-use ratios at comfortable levels. Early estimates for the next season’s U.S. crop indicate an overall reduction in plantings and a shift from soybeans to maize.
A. Grain supply growth |
B. Edible oil production growth |
C. Stock-to-use ratios for key grains |
D. U.S. Planting intentions |
|
|
Source: USDA, World Bank.
A.B.C. Years represent crop season (for example, 2018 refers to 2018-19). Data update on April 9, 2019.
D. 2019e refer to estimates from the March 29 USDA’s Prospective Plantings Report. Download data and charts.
demand for animal feed resulting from the spread of African swine flu to China in the second half of 2018. The edible oil and oilseed markets have also been affected by trade frictions. Soybeans were particularly impacted by the imposition of a 25 percent tariff in July 2018 by China on imports from the United States. Because the U.S. and China are the largest players in the global soybean market—the United States accounts for one-third of global production and China accounts for twothirds of global imports—the tariffs exerted downward pressure on soybean prices. However, the medium– and longer-term impact of tariffs on soybean prices is expected to be marginal, for three reasons of which there is already much evidence:
•Trade diversion: To avoid tariffs applied to U.S. soybeans, importers from China turned to South American producers, especially Brazilian suppliers (Brazil and Argentina

vk.com/id446425943
26 |
AG RI C U L T U RE AND F E RT I L IZ E RS |
C O M M O DI T Y M ARKE T S O U T LOO K | AP RI L 2 0 1 9 |
|
|
|
|
|
FIGURE 8 Demand conditions for grains and oilseeds
Consumption of grains and edible oils is expected to increase only marginally in 2018-19 due to lower animal feed use growth. Growth in biofuel consumption, a key source of food commodity demand, is projected to moderate in the longer term.
A. Grain consumption |
B. Edible oil consumption |
|
|
C. Animal feed consumption growth |
D. Biofuel production |
|
|
|
|
Source: IEA, OECD, USDA, World Bank.
A.B.C. Years represent crop season (for example, 2018 refers to 2018-19). Data update on April 9, 2019.
D. Shaded area (2019-25) represents IEA and OECD projections. Download data and charts.
account for 33 and 15 of global soybean supplies). Reduced purchases from the United States and increased purchases from South America initially created a gap between U.S. and Brazilian soybean prices of more than 20 percent in October. However, the price gap disappeared by December.
•Changing crop patterns: Because of reduced soybean exports to China, U.S. farmers were expected to substitute soybean plantings with other crops. According to the March 29
Prospective Plantings Report, the USDA estimates that U.S. farmers will reduce the area allocated to soybeans by more than 5 percent and increase the area for maize by 4 percent.
•Substitution. China’s soybean imports are projected to decline from 94.1 mmt during
2017-18 to 87.2 mmt during 2018-19. However, imports of palm oil (a close substitute to soybean oil) are projected to increase from 5.4 to 6.1 mmt and imports of maize (a close substitute to soybean meal) are expected to increase by 1.3 mmt during the same period.
Price forecasts and risks
The Grain Price Index is expected to increase marginally in 2019 before edging up more than 1 percent in 2020, as lower plantings are likely to reduce global supplies. Oils and Meals prices are expected to gain 3 percent in 2020, partly offsetting a projected decline of 7 percent in 2019. Several risks underpin these forecasts: the direction of energy and fertilizer prices (both of which are key inputs to grains and oilseeds); whether trade frictions are resolved; changes to domestic support policies; strengthening of the U.S. dollar; and currency movements of major exporters of particular commodities. Other risks include adverse weather patterns, including the ongoing (weak) El Niño, and diversion of food commodities to biofuels (Figure 8).
Energy is a key input to agricultural production and affects costs directly (through fuel) and indirectly (through fertilizer and other chemicals). Energy prices are expected to decline nearly 8 percent in 2019 while fertilizer prices are projected to increase 5 percent. Higher-than-expected prices for energy and fertilizer could exert upward pressure on most agricultural commodities, especially grains and oilseeds, which are energy intensive.
Trade policies appeared to have played an important role in commodity price movements last year (see Box in the October 2018 Commodity Markets Outlook). As noted earlier for the soybean market, trade diversion, changing crop patterns, and substitution among commodities partly offset the impact of tariffs. However, an escalation of trade frictions among other countries and other commodities could distort agricultural markets.
On the macroeconomic side, a strengthening of the U.S. dollar could exert downward pressure on

vk.com/id446425943
C O M M O DI T Y M ARKE T S O U T LOO K | AP RI L 2 0 1 9 |
AG RI C U L T U RE AND F E RT I L IZ E RS |
27 |
|
|
|
commodity prices. Indeed, last year’s weakness in commodity prices was, in part, a reflection of the weak U.S. dollar. Research has shown that a 10 percent appreciation of the dollar against major currencies is associated with a 5 percent declined in prices of internationally-traded commodities (see the Special Focus of the July 2016 Commodity Markets Outlook). Furthermore, currency depreciations of countries that account for a large share of global trade in a commodity market could also affect the price outlook.
El Niño weather conditions, which strengthened since February 2019, are likely to continue through the Northern Hemisphere spring (80 percent probability from April to June) and summer (60 percent probability from June to August). Given the mild nature of El Niño, combined with ample supplies, global agricultural markets are unlikely to be affected in a major way. However, according to the U.S. National Oceanic and Atmospheric Administration, the ongoing El Niño bears some similarities to the 2015 episode, one of the strongest El Niño patterns in recent history. The ongoing El Niño has already been linked to tropical cyclone Veronica, which caused iron ore supply disruptions in Australia.
Finally, the agricultural outlook assumes that biofuel production will continue to be a source of demand for some food commodities, especially in the United States, Brazil, and the European Union. Although output of biofuels has plateaued, there are indications that growth may pick up again. For example, China announced in 2018 that it will increase the production of maize-based ethanol. Global biodiesel production growth has also accelerated recently.
Beverages
The World Bank’s Beverage Price Index declined more than 3 percent in 2019 Q1 (q/q), down 7 percent from a year ago, with coffee (Arabica and Robusta) and tea all experiencing significant price drops. The index is projected to decline almost 3 percent in 2019 before a modest recovery in 2020.
Both Arabica and Robusta prices declined sharply in the first quarter (down 5 percent each), with
FIGURE 9 Beverage commodity market developments
Following last year’s declines due to ample supplies and currency depreciations of key exporters, beverage prices stabilized.
A. Arabica coffee price vis-a-vis |
B. Cocoa and Robusta prices |
BRL/USD |
|
C. Coffee production |
D. Cocoa production |
|
|
Source: Bloomberg, ICO, USDA, World Bank. A.B. Last observation is April 19, 2019.
C.D. Years represent crop season (for example, 2018 refers to 2018-19). Data update on April 9, 2019.
Download data and charts.
the former reaching an 11-year low. The price drop reflects record global production, which reached 172 million bags, up from last year’s 158 million bags, and led to an increase in inventories of 10 million bags (Figure 9). The supply glut reflects large crops in Brazil and Vietnam—the world’s largest Arabica and Robusta suppliers, respectively—and weaker-than-expected consumption. Estimates for the ongoing crop year also point to record supplies, especially in the Robusta market. Arabica and Robusta coffee prices are expected to average $2.85/kg and $1.75/kg in 2019 (representing 3 and 6 percent declines from 2018), followed by a marginal increase in 2020.
Cocoa prices, which rose 3 percent in the first quarter, have been relatively stable during the past three quarters. The global cocoa crop experienced no change in 2018/19 as gains by Côte d’Ivoire and Ghana—which account for two-thirds of
vk.com/id446425943
28 |
AG RI C U L T U RE AND F E RT I L IZ E RS |
C O M M O DI T Y M ARKE T S O U T LOO K | AP RI L 2 0 1 9 |
|
|
|
|
|
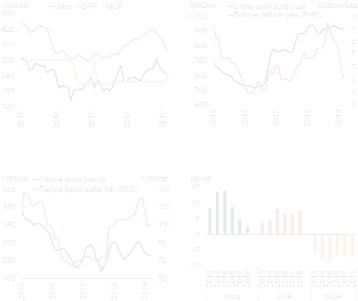
FIGURE 10 Agricultural raw materials market developments
Natural rubber prices staged a recovery in response to supply shortfalls of key Asian suppliers. Cotton prices remain weak on expected ample supplies due to larger plantings.
A. Agricultural raw material prices |
B. Cotton stocks |
|
|
|
|
C. Natural rubber production |
D. Natural rubber consumption |
Source: Bloomberg, ICAC, IRSG, World Bank.
A.Last observation is April 19, 2019.
B.Years represent crop season (for example, 2018 refers to 2018-19 crop season). C.D. Last observation is 2018Q4.
Download data and charts.
global supplies—were balanced by declines elsewhere, including Brazil, Cameroon, Indonesia, and Nigeria. Cocoa prices are expected to remain at current levels in 2019, before gaining 2 percent in 2020.
Tea prices, especially Kolkata and Mombasa, plunged 23 and 7 percent, respectively, in the first quarter (q/q), and stand 7 and 25 percent lower than a year ago. The Kolkata auction dropped to an 11-year low. Large tea crops due to favorable weather conditions in East Africa (especially Kenya) and India have caused the price collapse. In response, the Indian Tea Board ordered a suspension of tea production in December. Tea prices (3-auction average) are expected to decline 14 percent in 2019, before making marginal gains in 2010.
Agricultural raw materials
The World Bank’s Raw Materials Price Index gained 2 percent in the first quarter of 2019 (q/q) in response to a large increase in rubber prices but stood almost 4 percent lower than 2018 Q1. The index is expected to stabilize in 2019 and gain marginally in 2020.
Cotton prices declined nearly 5 percent in the first quarter and stand almost 9 percent lower than a year ago. The weakness reflects estimates that production will outpace consumption next season (2019-20), the first time since 2015-16. Production is expected to reach 27.6 mmt in 2019-20, with increases in most major producing countries including the United States, China, India, Pakistan, and several West African countries. Consumption, on the other hand, is estimated at 27.3 mmt, suggesting global stocks will increase by almost 2 mmt. Following a projected decline of almost 7 percent in 2019, cotton prices are expected to experience a 1 percent increase in 2020.
Natural rubber prices surged almost 18 percent in the first quarter to reach $1.72/kg in March, after plunging to a 30-month low in the third quarter of 2018 (Figure 10). The rebound reflects a slowdown in global natural rubber production in late 2018 and early 2019 due to adverse weather conditions and slower tapping. Lower production materialized in most East Asian producers, especially Thailand, Indonesia, and Malaysia, which together account for nearly 70 percent of global supplies. On the demand side, consumption of natural rubber for vehicle tires (two-thirds of its market) is expected to fall as vehicle sales have been slowing in all main regions, including China, North America, and Europe. However, fiscal stimulus in China, along with the reversal of interest rate hikes in many advanced economies is expected to stimulate demand somewhat. On net, natural rubber prices are expected to gain almost 9 percent in 2019 and 3 percent in 2020.
vk.com/id446425943
C O M M O DI T Y M ARKE T S O U T LOO K | AP RI L 2 0 1 9 |
AG RI C U L T U RE AND F E RT I L IZ E RS |
29 |
|
|
|
Fertilizers
The World Bank’s Fertilizer Price Index fell 5.4 percent in the first quarter of 2019 (q/q) after three consecutive quarterly increases. Seasonally weak Chinese demand, limited fertilizer application in North America, and declines in input costs contributed to the recent price fall. Fertilizer demand is expected to recover and the price index is forecast to increase by 4.8 percent in 2019, led by potash. Over the medium term, prices are subject to downside risks as adoption of enhanced-efficiency specialty fertilizers (controlledand slow-release) gain pace, leading to reduced application of conventional fertilizers.
Nitrogen (urea) prices fell 11 percent in the first quarter after large gains in the second half of 2018 (Figure 11). The decline reflected weak Chinese seasonal demand, below-average use in North America due to early snow, and lower input costs (natural gas and coal). These factors more than offset strong import demand elsewhere, notably Brazil. On the production side, stringent environmental policies have led to plant closures and sharp reductions in urea exports from China, the world’s largest nitrogen fertilizer producer. However, this has been offset by capacity additions in India, Nigeria, and Russia. In addition, concerns that the re-imposition of sanctions on Iran by the United States would curtail Iranian supply did not materialize, due to waivers given to China, India, and Turkey (accounting for more than threequarters of Iranian urea exports). Urea prices are projected to remain broadly unchanged in 2019.
Phosphate DAP (diammonium phosphate) prices plunged 12 percent in the first quarter, following a slight decline in the preceding quarter, on weak global demand. Consumption in China, the world’s largest consumer of phosphate fertilizers, continues to fall as it moves toward its zero growth policy on fertilizer use, while Indian demand remains lackluster as buyers are holding back purchases until there is more clarity on subsidies following the general elections in May. Cheaper input costs (ammonia and sulfur) also pushed prices lower. Phosphate production has risen in Morocco and Saudi Arabia, while Chinese exports, which had been trending down due to environmental
FIGURE 11 Fertilizer market developments
Fertilizer prices declined in the first quarter of 2019 on weak seasonal Chinese demand, limited use in North America in the fall season, and lower input costs.
A. Fertilizer prices |
B. Nitrogen fertilizer input costs |
C. Phosphate fertilizer input costs |
D. China’s net exports of fertilizers |
|
|
Source: Bloomberg, General Administration of Customs China, World Bank.
A-C. Last observation is March 2019.
Download data and charts.
restrictions, have also increased. During the remainder of 2019, prices are expected to mildly recover from current levels but, on average, remain 6 percent lower than in 2018.
Potash MOP (muriate of potash, or potassium chloride) prices increased 4.6 percent in the first quarter, after remaining flat throughout 2018. Global potash demand reached a record high in 2018, led by gains in Brazil (for corn and soybeans), China (fruits and vegetables), and Southeast Asia (palm oil). Demand is expected to further increase on corn acreage expansions in the United States and more soybean plantings in Brazil. Record harvests in recent years and limited use in the fall season should see increased fertilizer application to replenish lost nutrients. Production growth is expected to be modest, as new projects in Canada, Russia, and Turkmenistan have fallen short of market expectations. Potash prices are projected to rise 11.4 percent in 2019.
vk.com/id446425943
30 |
M E T AL S AN D P RE C IO U S M E T AL S |
C O M M O DI T Y M ARKE T S O U T LOO K | AP RI L 2 0 1 9 |
|
|
|
|
|
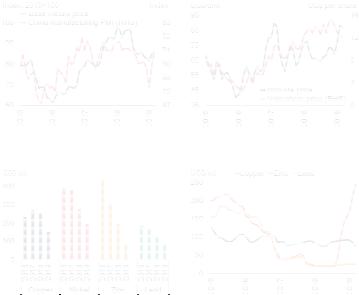
FIGURE 12 Metals and minerals market developments
Metal prices rose in the first quarter of 2019 on supply concerns and improved growth prospects in China because of fiscal stimulus and progress in trade negotiations between the United States and China.
A. Base metal prices and China |
B. Iron ore price and Vale share price |
manufacturing PMI |
|
C. Inventories |
D. Refining costs |
|
|
Source: Bloomberg, China National Bureau of Statistics, Haver Analytics, LME, Shanghai Metals Market, World Bank, World Bureau of Metal Statistics.
A.B.D. Last observation is March 2019.
A. PMI (purchasing managers’ index) reading above (below) 50 indicates an expansion (contraction).
C.Average daily LME inventories. Last observation is April 19, 2019.
D.Refining costs refer to smelting fees to turn concentrates into refined metal (treatment charges). Prices shown are spot treatment charges in China.
Download data and charts.
Metals and Minerals
The World Bank’s Metals and Minerals Price Index increased 1.7 percent in the first quarter of 2019 (q/ q). This was a rebound from a decline in the fourth quarter of 2018 that followed an even steeper decline in the preceding quarter. The price increase reflected supply concerns, progress in trade negotiations between the United States and China, and fiscal stimulus in China. Metal prices are anticipated to continue rebounding from their 2018 troughs but average 1.9 percent lower in 2019. Risks are broadly balanced. Downside risks include a weaker-than- expected demand boost from China’s fiscal stimulus and a prolonged stall in U.S.-China trade negotiations. Most base metal prices face upside risks from the possibility of tighter-than-expected environmental policies and slower-than-expected easing of commodity-specific supply bottlenecks.
Copper prices rose 1 percent in the first quarter after a steep plunge in the second half of 2018. Since early 2019, prices have been supported by improving prospects for economic growth, and strong import copper demand in China, which accounts for half of global copper consumption (Figure 12). China’s copper imports were encouraged by a ban on scrap imports that was initially imposed in 2017 and subsequently tightened, most recently in December. China’s value added tax cut in April 2019 on manufacturing, transport, and construction is expected to boost investment in copper-intensive infrastructure projects, especially in electricity and railways, and in housing. Since early 2019, copper prices have also been supported by heavy floods in Chile, production cuts in the Democratic Republic of Congo, and protests in Peru. During the remainder of the year, prices are expected to gradually increase but still average 0.6 percent lower than in 2018. Risks to this outlook are to the downside. In particular, the most recent fiscal stimulus package in China could lift copper demand less than earlier packages since it prioritized tax cuts over government spending.
Nickel prices gained 8.3 percent in the first quarter after a sharp decline during the last quarter of 2018. The price increase since early 2019 was in large part due to concerns about prospects and operations of the world’s largest nickel producer, Vale (13 percent of global nickel supply), following its tailings dam accident in Brazil. Rapidly growing demand for electric vehicles, despite subsidy cuts by the Chinese government, also supported prices. Amid lower nickel inventories, prices are expected to continue inching higher during the remainder of 2019 but, on average, remain 1.8 percent lower than in 2018. Over the medium to long term, demand for nickel is anticipated to be robust as electric vehicle production strengthens and battery composition changes to use more nickel. Risks to nickel prices are to the upside, especially if new large-scale battery-grade Indonesian projects are delayed or authorities renew export bans.
Alone among base metals, aluminum prices dropped 5.1 percent in the first quarter as supply concerns receded in early 2019. Sanctions
vk.com/id446425943
C O M M O DI T Y M ARKE T S O U T LOO K | AP RI L 2 0 1 9 |
M E T AL S AN D P RE C IO U S M E T AL S |
31 |
|
|
|
imposed on the Russian aluminum producer Rusal in April 2018 were lifted in January 2019. A production embargo on the world’s largest alumina refinery, Alunorte in Brazil (10 percent of global alumina supply excluding China), due to alleged environmental breaches was lifted although the resumption of full production is still awaiting federal court approval. Aluminum production and smelter capacity have expanded in China where environmental curbs were less stringent than expected. Aluminum prices are projected to fall by 8 percent in 2019 reflecting lower alumina prices and large aluminum overcapacity in China. Risks are tilted to the upside arising from tighter-than-expected environmental policies in China and a delayed resumption of Alunorte’s full production.
Zinc prices increased 3.1 percent in the first quarter following gains in the preceding quarter, accompanied by steep drawdowns in inventories. Price increases have largely reflected robust demand from China, which accounts for half of global consumption, and smelter bottlenecks that restricted refined output. Against the backdrop of rapidly growing zinc ore production, smelter capacity constraints have driven refining fees (zinc concentrate treatment charges) to near recordhighs. Zinc prices are projected to fall by 1.8 percent in 2019 on moderating demand and new ore production coming onstream from Australia, Canada, and South Africa. This outlook is subject to upside risk from the possibility of tighter-than- expected environmental policy in China constraining smelter capacity.
Lead prices rose 3.6 percent in the first quarter, in a partial rebound from declines in the preceding two quarters. Prices were supported by strong import demand from China, which accounts for two-fifths of global consumption, amid production cuts in the country as a result of efforts to reduce emissions. Inventories have also fallen to the lowest level in nearly 10 years. Lead prices are projected to gradually increase over the remainder of 2019 but remain 11.6 percent lower than in 2018. More stringent environmental regulations
in China restricting the recycling of lead scrap materials, which accounts for more than two-fifths of total refined production, presents an upside risk to the forecast. Over the medium term, a shift toward electric vehicles is likely to depress demand for lead, which is heavily used in batteries for internal combustion engine vehicles but not in electric vehicles.
Tin prices saw the largest increase among base metals in the first quarter, rising 9.9 percent (q/q), largely reversing declines in the two preceding quarters. The price increase reflected raw material shortages that caused partial closures at Chinese smelters after Indonesia tightened export regulations, and mines in Myanmar depleted. Tin prices are forecast to gain 5.3 percent in 2019 amid persistent pressures on raw material supplies. Risks are tilted to the upside if the depletion of mines proceeds faster than expected or export restrictions are extended. Looking forward, tin is expected to benefit from robust demand from growing technologies like electric vehicles, renewable energy, and robotics.
Iron ore prices increased sharply by 16.2 percent in the first quarter, primarily due to supply disruptions in Brazil and Australia. Following the Brumadinho dam rupture, all of Vale’s upstream tailings dams in Brazil have been decommissioned and operations at several mines have been temporarily suspended. In Australia, BHP and Rio Tinto’s production were impacted by tropical cyclone Veronica, and ore shipments have been disrupted due to a fire at the latter’s export terminal. These supply disruptions amount to about 6 percent of the global iron ore seaborne market. The recent Chinese fiscal stimulus is also expected to strengthen steel use, and hence, iron ore demand, since China accounts for one-half and three-fifths of global steel and iron ore consumption, respectively. Iron ore prices are projected to increase 11.4 percent in 2019. This forecast is subject to downside risks, especially renewed tightening of environmental policies in China that would restrict steel production.
vk.com/id446425943
32 |
M E T AL S AN D P RE C IO U S M E T AL S |
C O M M O DI T Y M ARKE T S O U T LOO K | AP RI L 2 0 1 9 |
|
|
|
|
|
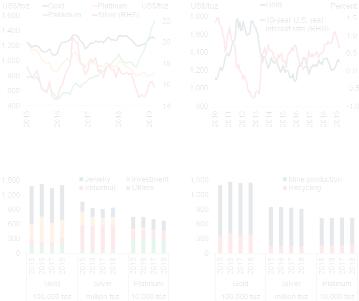
FIGURE 13 Precious metals market developments
Precious metals prices rose in the first quarter of 2019 due to a pause in interest rate hikes by the U.S. Federal Reserve and an increase in gold and silver demand.
A. Precious metals prices |
B. Gold prices and interest rates |
C. Demand for precious metals |
D. Supply of precious metals |
Source: Bloomberg, FRED, Silver Institute, World Bank, World Bureau of Metal Statistics, World Gold Council, World Platinum Investment Council.
A.B. Last observation is March 2019.
B.The interest rate is the 10-year treasury inflation-indexed security with constant maturity (not seasonally adjusted).
C.For gold, Others = central bank purchases; for silver, Others = silverware; for platinum, Others = automotive demand.
Download data and charts.
Precious Metals
The World Bank’s Precious Metals Price Index rose 6.1 percent in the first quarter (q/q) of 2019 following a slight increase in the preceding quarter. A pause in interest rate hikes by the U.S. Federal Reserve and robust gold and silver demand contributed to the price increase. The price index is forecast to continue its upward trend, led by gold, and average 2.6 percent higher than in 2018. Upside risks to the forecast include the possibility of an interest rate cut in the United States.
Gold prices, after reaching a recent trough in September 2018, increased 6.1 percent in the first quarter (Figure 13). Prices have been supported by strong demand and a fall in long-term real interest rates. The depreciation of the U.S. dollar against the renminbi led to a strengthening in Chinese
jewelry demand. Emerging market central banks, particularly China, India, Russia, and Turkey, have increased gold holdings to diversify their asset base, and investors have increased net long positions in gold-backed exchange traded funds. These factors have more than offset soft industrial demand. Demand in the electronics sector has been stable but the use of gold in dental applications continues to fall due to the preference for cheaper porcelain alloys. Gold prices are forecast to be 3.2 higher in 2019 on expectations of robust demand and a prolonged pause in interest rate hikes by the U.S. Federal Reserve.
Silver prices have moved in line with gold, rising 6.9 percent in the first quarter. Silver’s heavy discount to gold has led investors to diversify their portfolios, with Indian investment demand rising. Jewelry demand and silverware fabrication also rose moderately. However, industrial demand for silver, which accounts for more than half of total demand, remains weak. Tariffs on solar imports to the United States led to reduced use of silver in solar panels in 2018, and this trend is expected to persist. The use of silver in photovoltaics is expected to decline as it is one of the most expensive components. Silver prices are projected to remain broadly unchanged in 2019.
Platinum prices remained unchanged in the first quarter of 2019 after steep declines in the first three quarters of 2018. Jewelry and automotive demand, each accounting for about two-fifths of platinum demand, continue to trend lower. Platinum, used extensively in the catalytic converters on diesel engine vehicles, has fallen out of favor in Europe due to declining market share for diesel vehicles. On the other hand, the price of palladium, which is used for pollution control in gasoline-powered vehicles, has been boosted by supply disruptions in South Africa. Despite diverging platinum and palladium prices, prospects for substitution are limited at present due to technical constraints. In addition, with the switch to electric vehicles on the horizon there is less incentive to invest in platinum-based technology, which may become obsolete. Platinum prices are expected to decline by 4.5 percent in 2019.