

World Bank - Commodity Market Outlook_watermark
.pdfvk.com/id446425943
C O M M O DI T Y M ARKE T S O U T LOO K | AP RI L 2 0 1 9 |
S P EC I AL F O CU S |
13 |
|
|
|
interventions encourage greater exports and, as a result, lower world prices.
Poverty impact of the 2010-11 food price shock
The impact of the 2010-11 food price shock on poverty is quantified in two steps. The first step estimates protection rates to capture government interventions (Anderson, Ivanic, and Martin 2014). In the second step, these estimates are fed into a computable general equilibrium (CGE) model in combination with household models for 285,000 households from 31 countries to determine the impact of policy interventions on poverty (Laborde, Robichaud and Tokgoz 2013;
Laborde, Lakatos, and Martin 2019). Two scenarios are compared. In the first scenario, the impact of countries’ own interventions on poverty is considered. In the second scenario, the combined effect of all policy interventions on global food markets and their feedback to domestic poverty is quantified.
Quantifying policy interventions. A primary shock, such as a weather shock, is assumed to generate initial production shortfalls that are calibrated to match the observed changes in protection rates and world prices. Government interventions to suppress the pass-through of domestic prices from global food price spikes are reflected in a falling ratio of domestic to world prices—the “protection rate.” If the protection rate rises, policymakers are compounding the increase in world prices. Protection rates are assumed to reflect trade measures by governments, such as the introduction of export bans (food exporters) or the reduction of import duties (food importers). These policy responses are calibrated to match the observed protection rates and world price increases in 2010-11. As the model distinguishes between domestic and imported goods, two potential policy instruments are considered—an import duty (or subsidy) and an export subsidy (or tax). These measures, in turn, reinforce the original shock to world prices. The data used for quantifying the extent of trade policy interventions are taken primarily from the AgIncentives Consortium database reflecting changes
in domestic and world prices for 57 countries and 68 agricultural and food commodities during 2005-2015.6 Where data from the Ag-Incentives database were unavailable, alternative data were used from FAOSTAT, GIEWS and Fewsnet.7 Overall, this analysis covers 24 major food- producing and consuming countries, using data on household income sources and spending patterns from 2011. Of these, 18 are EMDEs and 6 are LICs.
Impact of policy interventions on global prices.
During the food price spike of 2010-11, world prices of maize, wheat and rice rose by 44 percent, 39 percent, and 6 percent, respectively. Results suggest that the combined action of many governments amplified global wheat and maize price increases, accounting for about 40 percent of the increase in world price of wheat and onequarter of the increase in the price of maize (Figure SF4). In contrast, combined policy action reduced the rice price surge compared to a nonaction scenario. This primarily reflects the elimination of export restrictions in India and the increased import protection in Indonesia, Pakistan, Uganda, and Yemen.
•Wheat. Most EMDEs took measures to offset the increase in global wheat prices in 2010-11, broadly similar to those employed during the spike in wheat prices in 2007-08. Policymakers justified efforts to dampen the impact of the global wheat price spike by noting that the world wheat price spike partly reflected a catching up with rising domestic wheat prices.8 The combined intervention of
6 The data is available at www.ag-incentives.org.
7 FAOSTAT refers to the UN’s Food and Agriculture Organization Statistics, GIEWS is the Global Information and Early Warning System, and Fewsnet is the Farming Early Warning Systems Network.
8 Ethiopia, where domestic wheat prices rose 28 percentage points more than world prices during 2010-11, is an exception. This reflected domestic supply shocks, combined with limited access to global wheat markets to alleviate shortages. In particular, wheat output fell by 10 percent in 2010-11 as a result of a fungus that destroyed the wheat harvest and lowered stocks in 2011. Wheat imports rose but were constrained by tight foreign exchange controls, effectively stopping private sector imports and ensuing that all grain imports are channeled through the state-owned Ethiopian Grain Trade Enterprise (Negassa and Jayne 1997; Wakeyo and Lanos 2014).

vk.com/id446425943
14 |
S P EC I AL F O CU S |
C O M M O DI T Y M ARKE T S O U T LOO K | AP RI L 2 0 1 9 |
|
|
|
countries accounted for close to 40 percent of the increase in the world price of wheat.
•Maize. Although most countries insulated their domestic maize markets against maize price increases during 2010-11, there was considerable heterogeneity in policy responses. In Bangladesh, Ecuador, Malawi, Tanzania, and Zambia, protection rates fell, fully offsetting the rise in global maize prices. Ethiopia, Uganda, and Yemen increased protection rates or used policies that, in combination with domestic output shocks, amplified the increase in domestic prices.
•Rice. Some countries (e.g., Bangladesh, Nepal, Panama, Tanzania, and Zambia) reduced trade barriers to partially offset the rise in world rice prices. However, important net rice exporters such as India, Pakistan, and Yemen implemented policy interventions that ultimately raised domestic rice prices more than the increase in world prices. In India, the world’s second-largest rice producer, quantitative restrictions imposed in 2007 initially prevented domestic price increases. However, the subsequent abolition of export quotas in September 2011 resulted in a surge in exports and a rise in domestic prices. In Pakistan, heavy summer flooding that affected one-fifth of the country’s land area and inflicted extensive damage to crops raised domestic rice prices relative to the world price over the same period. A large increase in domestic prices relative to external prices occurred in Yemen, amid persistent water shortages and a shift to less water-intensive non-staple crops; in Ethiopia and Uganda, and cause was drought. The combined intervention of all countries dampened the increase in the world price of rice by about 50 percent compared to a scenario without insulation policies.
Poverty impact of 2010-11 food price spike with policy intervention. Model results suggest that despite widespread interventions, the food price spikes of 2010-11 still raised poverty in most countries. Globally, the 2010-11 food price spike tipped 8.3 million people (almost 1 percent of the
world’s poor) into poverty (Figure SF5). This is the marginal impact of the food price shocks on poverty levels; due to other forces the actual number of people living in poverty fell by 128 million over this period. The increase in world food prices, combined with government intervention, was most strongly felt in countries such as India and Uganda, where the extreme poor tend to be net food-buyers whose real incomes declined.9 These poverty impacts are less pronounced compared to the 2007-08 food price shock, due to the latter’s greater severity, stronger world-domestic price transmission, and higher initial poverty rates (Ivanic and Martin 2008; Anderson, Ivanic, and Martin 2014; Laborde, Lakatos, and Martin 2019).
Conclusion
Following post-2000 food price increases, many countries used trade policies to insulate domestic markets from increases in world prices. Such policies became increasingly common during the 2010-11 food price spike. While each country’s policies dampened domestic price movements, the combined use of policies by many countries amplified the increase in world prices. Insulation policies accounted for 40 percent of the increase in world wheat prices and one-quarter for world maize prices. The increase in food prices combined with government policy responses in 2010-11 tipped 8.3 million people into poverty. These findings highlight how the use of trade policy interventions to insulate domestic markets from food price shocks can amplify international price movements, and may not be effective in protecting the most vulnerable populations groups.
Instead of trade policy interventions, policy makers could use other policies to soften the impact of large food price fluctuations. These include targeted safety-net interventions such as cash transfers, food and in-kind transfers, school
9 Results reported here do not take into account the impact of safety-net programs such as India’s Public Distribution System, which distributes food to poor households at fixed prices and so automatically makes larger transfers to the poor when food prices rise.
vk.com/id446425943
C O M M O DI T Y M ARKE T S O U T LOO K | AP RI L 2 0 1 9 |
S P EC I AL F O CU S |
15 |
|
|
|
feeding programs, and public works programs. Measures such as crop and weather insurance and warehouse receipt systems could also be used as risk management instruments. These interventions could be combined with targeted nutrition and health programs as well as regulatory interventions to improve health outcomes.
Barrett, C. 2013. Food Security and Sociopolitical Stability. Oxford: Oxford University Press.
Chapoto, A., and T. S. Jayne. 2009. “Effects of Maize Marketing and Trade Policy on Price Unpredictability in Zambia.” Food Security Collaborative Working Papers 54499, Michigan State University.
References
Aksoy, M. A., and J. C. Beghin. 2004. Global Agricultural Trade and Developing Countries. Washington, DC: World Bank.
Aksoy, M. A., and B. Hoekman. 2010. Food Price and Rural Poverty. Washington, DC: World Bank.
Al-Mamun, A., A. Chapoto, B. Chisanga, W. Martin, and P. Samboko. 2017. “El Niño Impacts and Trade Policy Responses on Grain Markets and Trade in Eastern and Southern Africa.” Mimeo. International Food Policy Research Institute, Washington, DC.
Anderson, K., M. Ivanic, and W. Martin. 2014. “Food Price Spikes, Price Insulation and Poverty.” In The Economics of Food Price Volatility, edited by J. P. Chavas, D. Hummels, and B. Wright. Chicago: University of Chicago Press.
Anderson, K., W. Martin, and M. Ivanic. 2017. “Food Price Changes, Domestic Price Insulation and Poverty (When All Policymakers Want to be Above-Average).” In Agriculture and Rural Development in a Transforming World, edited by P. Pingali and G. Feder. London: Routledge.
Anderson, K., and S. Nelgen. 2011. “Trade Barrier Volatility and Agricultural Price Stabilization.” World Development 40 (1): 36-48.
Baffes, J., and T. Haniotis. 2016. “What Explains Agricultural Price Movements?” Journal of Agricultural Economics 67 (3): 706-721.
Baffes, J., V. Kshirsagar, and D. Mitchell. 2019. “What Drives Local Food Prices? Evidence From the Tanzanian Maize Market.” The World Bank Economic Review 33 (1): 160-184.
Easterly, W., and S. Fischer. 2001, “Inflation and the Poor.” Journal of Money, Credit and Banking
33 (2): 160-78.
Freund, C., and C. Ozden. 2008. “Trade Policy and Loss Aversion.” The American Economic Review 98 (4): 1675–91.
Giordani, P., N. Rocha, and M. Ruta. 2016. “Food Prices and the Multiplier Effect of Trade Policy.”
Journal of International Economics 101 (1): 102–22.
Gouel, C., M. Gautam, and W. Martin. 2016. “Managing Food Price Volatility in a Large Open Country: The Case Of Wheat In India.” Oxford Economic Papers 68 (3): 811–35.
Gouel, C., and S. Jean. 2015. “Optimal Food Price Stabilization in a Small Open Developing Country.” World Bank Economic Review 29 (1): 74-101.
Grossman, G., and E. Helpman. 1994. “Protection for Sale.” The American Economic Review 84 (4): 833-50.
Headey, D. 2018. “Food Prices and Poverty.” The World Bank Economic Review 32 (3): 676-691.
Ivanic, M., and W. Martin. 2008. “Implications of Higher Global Food Prices for Poverty in LowIncome Countries.” Policy Research Working Paper 4594, World Bank, Washington, DC.
———. 2014. “Implications of Domestic Price Insulation for Global Food Price Behavior.”
Journal of International Money and Finance 42 (1): 272-288.
Laborde, D., C. Lakatos, and W. Martin. 2019. “Poverty Impact of Food Price Shocks and Policies.” In Inflation in Emerging and Developing
vk.com/id446425943
16 |
S P EC I AL F O CU S |
C O M M O DI T Y M ARKE T S O U T LOO K | AP RI L 2 0 1 9 |
|
|
|
Economies—Evolution, Drivers, and Policies, edited by Jongrim Ha, M. Ayhan Kose, and Franziska Ohnsorge, 371-401. Washington, DC: World Bank Group.
Laborde, D., V. Robichaud, and S. Tokgoz. 2013. “MIRAGRODEP 1.0: Documentation.” AGRODEP Technical Note, International Food Policy Research Institute, Washington, DC.
Lustig, N. 2009. “Coping with Rising Food Prices: Policy Dilemmas in the Developing World.” Institute for International Economic Policy, George Washington University, Washington, DC.
Negassa, A., and T. S. Jayne. 1997. “The Response of Ethiopian Grain Markets to Liberalization.” Food Security Collaborative Working Papers 55595, Michigan State University.
Tschirley, D., and T. Jayne. 2010. “Exploring the Logic Behind Southern Africa’s Food Crises.”
World Development 38 (1): 76–87.
Wakeyo, M., and B. Lanos. 2014. “Analysis of Price Incentives for Wheat in Ethiopia.” Food and Agriculture Organization of the United Nations, Rome.
World Bank. 2009. Global Economic Prospects:
Commodities at Crossroads. January. Washington,
DC: World Bank.
———.2011. “Responding to Global Food Price Volatility and Its Impact on Food Security.” World Bank, Washington, DC.
———.2018. Commodity Market Outlook. The Changing of the Guard: Shifts in Commodity Demand. October. Washington, DC: World Bank.

vk.com/id446425943
Commodity Market
Developments and Outlook
vk.com/id446425943
vk.com/id446425943
C O M M O DI T Y M ARKE T S O U T LOO K | AP RI L 2 0 1 9 |
E N E RGY |
19 |
|
|
|
Energy
Energy prices partially recovered in the first quarter of 2019, following a steep decline in almost all energy prices in the preceding quarter. However, there has been significant divergence between different energy commodities. Oil prices have risen 34 percent since the start of the year, amid production cuts by the Organization of the Petroleum Exporting Countries (OPEC) and other producers, and supply disruptions elsewhere. In contrast, natural gas prices fell sharply in March and into April in part due to rising liquefied natural gas exports from the United States and Australia, which also weighed on the prices of coal as a close substitute to natural gas. Oil prices are expected to decline from recent highs and average $66/bbl in 2019 and $65/bbl in 2020, with risks around this outlook broadly balanced.
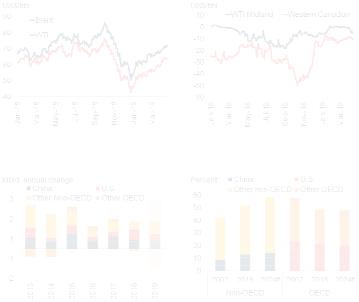
FIGURE 2 Oil market developments
Crude oil prices recovered over the first quarter of 2019, with Brent reaching $74 in April. Price differentials for different types of crude oil fell amid reduced transport bottlenecks in the United States and production restraint in Canada. Oil demand remained robust in 2018, and growth in 2019 is expected to be driven by China and India, a continuation of a longer-term shift away from advanced economies.
A. Crude oil prices |
B. Crude oil price differentials |
C. Oil demand growth |
D. Shares of global oil demand |
Crude oil
Recent developments
Crude oil prices fell 6 percent in the first quarter of 2019 (q/q) following a 11.5 percent decline in the previous quarter (Figure 2). However, prices have risen steadily since the start of the year, with the price of Brent crude oil reaching $74/bbl and West Texas Intermediate (WTI) reaching $66/bbl in late April. These fluctuations have been driven by supply developments: in November the United States granted waivers to its sanctions against Iran to eight countries, which, together with a sharp increase in supply among OPEC countries, primarily Saudi Arabia, resulted in much higher- than-expected global production in the last quarter of 2018. This contributed to oil prices plunging 41 percent between mid-October and December. However, subsequent production cuts by OPEC and its partners, together with supply disruptions elsewhere, have since boosted prices.
There have also been sizeable movements in the prices of different grades of crude oil. Western Canadian oil had been trading at a very large discount to WTI Cushing, the U.S. benchmark, because of severe transport bottlenecks, with the spread reaching $50/bbl in October. This led the province of Alberta to enforce mandatory
Source: Bloomberg, IEA, World Bank.
A.Last observation is April 19, 2019.
B.Lines show differences compared with WTI Cushing. Last observation is April 19, 2019.
C.Shaded area shows IEA forecast for 2019.
D.2024f indicates IEA forecast.
Download data and charts.
production cuts of 0.3 million barrels per day (mb/d) in January, an intervention that has since substantially boosted Western Canadian prices. Similarly, WTI Midland (the price of oil in the Permian region) was trading at a discount of $18 to WTI Cushing because of transport bottlenecks, but eased towards parity in the second half of 2018, assisted by technological developments such as improved pipeline management.
Global consumption of crude oil rose 1.1 percent in the first quarter of 2019 (y/y), a slight acceleration relative to the previous quarter. China, India, and the United States accounted for most of the increase. Oil consumption expanded 3 percent (0.4 mb/d) in China, although the pace of growth
vk.com/id446425943
20 |
E N E RGY |
C O M M O DI T Y M ARKE T S O U T LOO K | AP RI L 2 0 1 9 |
|
|
|
|
|
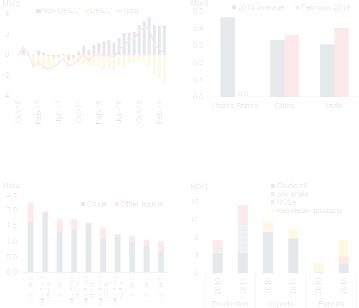
FIGURE 3 Oil production developments
Global oil production fell sharply in the first quarter of 2019, following a steep increase in the second half of 2018. OPEC and its partners substantially cut production, while output also fell sharply in Iran and Venezuela. U.S. oil production rose at the fastest pace ever recorded in any country in 2018, contributing to a sharp increase in exports.
A. Cumulative changes in crude oil |
B. Venezuelan oil exports, by partner |
production |
|
C. Top 10 one-year increases in oil |
D. U.S. oil production and trade, |
production, by country and year |
by product |
Source: Bloomberg, EIA, IEA, World Bank.
A. Change in crude oil production since October 2016, the date of the first OPEC production cut agreement. OPEC excludes Qatar. Last observation is March 2019.
C.The number in brackets is the year in which the increase occurred. “Other liquids” include condensates and natural gas liquids. Sample begins in 1984.
D.NGLs stands for “natural gas liquids.”
Download data and charts.
has been slowing, partly because of environmental policies. For example, demand from the transport sector has been dampened by the use of vehicle quotas in major cities which has restricted new vehicle sales. Growth in the United States has been strong in recent quarters and rose 1.4 percent (0.3 mb/d) in the first quarter of 2019 (y/y). Strong economic growth, increased demand from the transport sector (particularly for e-commerce), and a booming petrochemical industry all contributed to the rise. Oil consumption among other advanced economies has fallen, with a decline of 0.1 mb/d in both Germany and Japan on weaker economic activity.
Consumption is expected to rise by 1.2 percent in 2019, somewhat less than expected in the October 2018 report and toward the lower end of industry
forecasts. Global growth in 2019 is expected to be weaker than previously forecast, although the weakness should be temporary. Non-OECD countries are expected to continue to account for most of the increase in demand given their higher growth rates relative to advanced economies.
Beyond 2020, OECD oil consumption growth is expected to be negligible according to the International Energy Agency (IEA)’s Oil Market Report 2019, with small increases in North America offset by declines in Europe and Japan as efficiency and environmental policies reduce oil consumption, particularly in the transport sector. Non-OECD consumption growth is expected to average around 2 percent per year over the next five years, but gradually slow as countries continue to improve energy efficiency and strengthen environmental policies.
Global oil production plunged in the first quarter of 2019, following a sharp expansion in the preceding quarter (Figure 3). The increase at the end of last year was primarily due to Saudi Arabia, who substantially increased production between June and October by 0.6 mb/d in anticipation of the U.S. sanctions on Iran. However, in November the U.S. decided to grant waivers to the sanctions to eight countries, including China and India (which together account for 18 percent of global oil consumption). This led to much higher-than-expected levels of production in November and December, contributing to a rise in inventories and declining prices.
In response to these developments, OPEC and its coalition of partners, including Russia, agreed to implement production cuts of 1.2 mb/d starting in 2019. Compliance with the agreement by OPEC members has been strong, and output has fallen by more than agreed levels. Production curtailments have been led by Saudi Arabia, which reduced output by 8 percent (0.81 mb/d) between October 2018 and March 2019, compared with its agreed cut of 3 percent (0.32 mb/d). NonOPEC countries have been slower to adhere to the reduction, with Russia projected to reach its target in April. OPEC and its partners are expected to decide whether to extend production limits at their meeting in June.
vk.com/id446425943
C O M M O DI T Y M ARKE T S O U T LOO K | AP RI L 2 0 1 9 |
E N E RGY |
21 |
|
|
|
Production has also fallen in Iran and Venezuela, which are exempt from the OPEC agreement. The impact of U.S. sanctions on Iranian production, despite the existing waivers, has been substantial. Output is down almost 30 percent (1.1 mb/d) relative to its peak in the second quarter of 2018, and comparable to the impact of earlier sanctions in 2014. In Venezuela crude oil production has fallen by a third (0.4 mb/d) since September, to just 0.9 mb/d in March 2019. This deterioration reflects the worsening political and economic situation in the country, including prolonged power cuts. New U.S. sanctions on Venezuela have also affected the oil industry—U.S. imports of Venezuelan oil fell from an average of 0.5 mb/d in 2018 to zero in February, although there has been some diversion of Venezuelan oil exports to other countries such as China and India.
Oil production in the United States surged 2.4 mb/d in 2018 Q4 (y/y), double the increase expected by the U.S. Energy Information Administration in its Short-Term Energy Outlook report in January 2018. An increase in investment, together with efficiency gains and innovative solutions to transport bottlenecks, allowed U.S. oil production, including natural gas liquids (NGLs), to increase at the fastest annual pace recorded by any country. Indeed, the shale boom has led the U.S. to account for five of the ten largest one-year increases in oil production globally since 1984, all occurring in the last six years.
In contrast to the previous year’s surge, U.S. oil production was almost unchanged in the first quarter of 2019 relative to the previous quarter. The rig count fell nearly 10 percent (q/q) as companies responded to the unexpected increase in OPEC supply at the end of last year, while U.S. production was also disrupted by adverse weather. U.S. oil production is nonetheless expected to rise by 1.6 mb/d in 2019 according to the IEA’s April 2019 Oil Market Report, a slower pace than 2018 but still robust. Many wells have been drilled but uncompleted, which would enable producers to quickly ramp up production. Additional pipeline capacity is also expected to come onstream throughout 2019, further easing transport bottlenecks and raising oil flows.
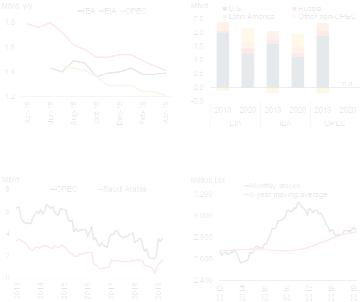
FIGURE 4 Oil market prospects
Oil prices are expected to average $66/bbl in 2019, amid weaker expectations for demand growth in 2019, rising U.S. production, and OPEC restraint. Increased levels of spare capacity in OPEC countries and adequate inventories provide a buffer against unexpected outages.
A. Evolution of 2019 oil demand |
B. Non-OPEC oil production growth |
growth forecasts |
forecasts |
C. OPEC spare capacity |
D. OECD oil inventories |
Source: Bloomberg, EIA, IEA, OPEC, World Bank.
B.Chart shows latest forecasts for non-OPEC production by the EIA, IEA, and OPEC. N.A. indicates data are not available.
C.OPEC includes Saudi Arabia.
D.Trailing 5-year moving average.
Download data and charts.
As a result of the sharp increase in production, U.S. exports of oil, NGLs, and petroleum products have risen sharply, although the U.S. remains a net importer of these liquids. The IEA expects the United States will become a net exporter of oil and other liquids by the end of 2020, and will export more than Russia by the end of 2023.
PRICE FORECASTS AND RISKS
Crude oil prices are expected to moderate a little from their current levels and average $66/bbl in 2019, and $65/bbl in 2020. This is a downward revision from the previous forecast and reflects weaker-than-expected global growth and a much larger increase in U.S. production than anticipated in 2018. The forecast assumes that: oil demand
vk.com/id446425943
22 |
E N E R G Y |
C O M M O D I T Y MA RK E T S OU T LO O K | A P R I L 2 0 1 9 |
|
|
|
growth slows slightly in line with weaker global growth this year; U.S. shale production increases robustly in 2019 albeit at a slower pace than 2018, before slowing in 2020; and growth in other non-OPEC countries rises modestly (Figure 4).
Risks to the outlook relate primarily to policy decisions, but are broadly offsetting. The United States’ decision on April 22 to terminate waivers to its sanctions on Iran could put upward pressure on oil prices. However, the impact of this decision remains uncertain, for two reasons. First, it is not clear how quickly countries will comply with the removal of waivers. Second, countries could choose to ignore the sanctions—for example, over the past three months some countries have been importing more oil from Iran than allowed under the existing waivers. As such, the full impact of the sanctions on the oil market could be smaller than if all Iranian oil exports stopped when the waivers expire on May 2. Iran currently exports around 1.4 mb/d of crude oil and condensates, around 1.4 percent of global supply.
It is possible that major oil-producing countries, notably Saudi Arabia and the United Arab Emirates, could increase production to compensate for any shortfall resulting from the termination of waivers. OPEC currently has around 3.5 mb/d of spare capacity, with Saudi Arabia accounting for approximately one-half of this. However, it is unclear how rapidly these countries will be willing to respond to a reduction in Iranian exports. Any change in their production will have implications for the future of the production agreement between OPEC and its partners—the group is due to meet in June to discuss whether to extend the cuts.
Other geopolitical risks also remain elevated, including conflict-related disruptions in Libya, and further deterioration in Venezuela. In addition, legislation under consideration in the U.S. congress—the “No Oil Producing and Exporting Cartels Act” or NOPEC—would allow antitrust cases to be brought against countries making it possible to sue OPEC for collectively reducing output.
On the demand side, consumption of oil could be weaker than expected, either because of slower global growth, or greater adoption of environmental policies. In addition, new regulations implemented by the International Maritime Organization will lead to shifts in demand for specific oil products and potentially for different types of crude oil. The regulations restrict emissions of sulfur by marine vessels, and come into force on January 1, 2020. Operators of marine vessels have three main options to comply with the regulations:
•Install scrubbers to remove the sulfur from ships’ exhaust, thereby allowing the continued use of high-sulfur fuels. The sulfur would be collected and either discarded into the sea, or offloaded at ports.
•Switch from using high sulfur fuel to a lower sulfur fuel, such as marine gasoil/diesel.
•Convert vessels to run on alternative fuels, such as liquefied natural gas.
Most ships are expected to switch to using lower sulfur fuel, which will lead to a surge in demand for gasoil/diesel and result in a sharp fall in demand for high-sulfur heavy fuel oil (although some may be used for electricity generation in power plants). However, the magnitude of the impact will depend on the degree of enforcement. Ships currently account for about 4 percent of global demand for oil (the energy equivalent of 15 percent of global gasoil/diesel consumption). The IEA estimates that gasoil/diesel prices could rise 20 percent in 2020 under a scenario with relatively limited enforcement of the new regulations, but prices could double if enforcement is strict. Any increase is expected to be temporary, however, as the market adjusts to the new regulations. In addition, the price premium for Brent and WTI over Dubai could rise, given the lower sulfur content of these grades of oil.