


6
Do Your Peers Matter?
We both have different opinions, and I’m going to do what I want, and she’s going to do what she wants. So I don’t—we don’t—really influence each other so much.
—C-SNIP Focus Group Study participant
he evidence presented in the previous chapter shows that one’s Tpersonal characteristics mediate the effect that civic talk has on civic participation. Specifically, the preponderance of the data shows, perhaps disappointingly to those concerned with civic disengagement, that individuals who are willing and able to participate in civic activities will be more positively affected by engaging in civic talk. This issue, and its normative consequences, will be considered in greater detail in
Chapter 8.
Given that who we are matters, the next question to address is whether the characteristics of our peers matter. The data presented in this chapter show that the relationship between civic talk and civic participation varies based on the characteristics of the people with whom we engage in discussion. In this analysis I examine three types of peer characteristics: social intimacy, disagreement, and civic expertise. With regard to intimacy, the C-SNIP data show that trust between peers enhances the effect of civic talk. The evidence also shows that civic talk is more influential when peers are similar to one another, both in general and with regard to political preferences. Finally, the C-SNIP data show that civic talk has a larger influence on our behavior when we think that the person we are engaged in discussion with is knowledgeable about politics and current events.
92 |
Chapter 6 |
Should the Characteristics of Our Peers Matter?
Social Intimacy
Existing scholarship in political science, sociology, and social psychology shows that for one person to influence another, the two must share a certain level of social connectedness. Moreover, these literatures suggest that the deeper that social connection is, the greater the effect peers will have on an individual’s patterns of behavior.
One reason social influence is enhanced by social intimacy is that individuals are more likely to comply with the preferences of a peer group to continue to be a part of that group (Dawson et al. 1977; Mendelberg 2002; Putnam 2000). For example, in a review of the extant literature on deliberation, Mendelberg (2002) finds that when individuals identify emotionally with the group they are attempting to deliberate with, they are more willing to cooperate and accept the will of the group during the deliberation process. Social intimacy facilitates compliance with the group because the tighter the social bond is between an individual and his or her peer group, the more the individual has to lose from the dissolution of his or her membership in the group. In turn, the more he or she has to lose, the greater the individual’s incentive is to comply with the will of the group. This is especially the case in small groups, such as peer networks, where social bonds are more intimate and individuals have a greater capacity to monitor the actions of their peers to make sure they comply with group norms.
The role of information is another way in which social intimacy might affect the relationship between civic talk and civic participation (Brady et al. 1999; Brehm et al. 2002). For example, in a study of how political parties and interest groups recruit individuals to work on their behalf, Brady and his colleagues (1999) show that individuals are 28 percent more likely to agree to become political activists if they know the person who is attempting to recruit them. In explaining this result, Brady and colleagues contend that the more intimate the social relationship is between two people, the more perfect the information is about one another. For example, if you and I have a close social relationship, I am likely to have a general idea of how likely you are to want to participate in civic activities and what types of activities you might desire to participate in. As such, I have knowledge about how to persuade you to adopt a certain way of behaving.
The extant literature also shows that even simple physical proximity can make social persuasion more effective (Festinger et al. 1950; Kopstein

Do Your Peers Matter? |
93 |
and Reilly 2000). A classic example of this phenomenon is in Festinger and colleagues’ (1950) seminal study of a student dormitory at the Massachusetts Institute of Technology. Among the numerous discoveries made about social interaction and human relations in that study, one of the most interesting was that individuals are friendlier with, and tend to share the preferences and patterns of behavior of, the people to whom they live near. Festinger and colleagues surmised that physical proximity facilitates social influence by facilitating social interaction. Otherwise stated, the more you cross paths with a person, the more likely you are to form a social bond with that person. In turn, that social bond can facilitate social influence over attitudes and behavior.
Homogeneity
The existing literature also suggests that homogeneity in the peer group should have an effect on peers’ influence. The discussion of social intimacy above suggested that, for one person to influence another, the two must have a certain level of social connectedness. The deeper that connection is, the greater the effect of civic talk should be. Not surprisingly, human beings stereotypically prefer to have these types of close social relationships with individuals who are more like them (Alesina and La Ferrara 2002; Brehm et al. 2002; Costa and Kahn 2003). This tendency is reflected in the C-SNIP Panel Survey data. For example, how similar subjects feel they are to their roommates correlates with how much they trust their roommates (r = .49, p < .01). So, assuming that individuals are more likely to heed the words of people they trust, homogeneous peer groups may be more effective at influencing individuals to participate in civil society than heterogeneous ones (Lupia and McCubbins 1998).1
Beyond basic similarities and differences between peers, one specific form of social network homogeneity that is of special interest to this study is (dis)agreement about politics and current events. Some existing works suggest that political disagreement among peers will lead an individual to withdraw from civil society. For example, Mutz (2002, 2006) examined this question through a series of studies on “cross-cutting” peer networks. In the case of these studies, disagreement is operationalized as having electoral preferences that are different from those of your peers. Mutz’s
1As Lupia and McCubbins (1998, 74) put it, “People also use knowledge of others’ backgrounds and knowledge of their circumstances to evaluate their character and incentives. These strategies lead all of us to rely more on the testimony of family, friends, and colleagues and less on the testimony of strangers.”

94 |
Chapter 6 |
analyses suggest that disagreement is relatively infrequent in social networks, presumably because humans tend to associate with people who are similar to them. Moreover, her studies suggest that individuals who disagreed with their peers about who should win the 1992 presidential election were less active in campaign activities during that election. Mutz argues that disagreement suppressed participation because individuals who disagreed with their peers were more likely to have ambivalent political views and subsequently were less interested in participating in the campaign.
In addition to the potentially negative effects of disagreement-driven ambivalence on participatory democracy, Mutz (2002, 2006) suggests that disagreement can lead to conflict in the social network. In turn, this potential for conflict could cause the individual to feel pressure to keep harmony in the social network by not participating in politics. Evidence that supports this assumption can also be found in social psychological studies of attitudes. Studies on cognitive consistency show that when an individual encounters information that goes against his or her own beliefs, a psychological state of negative arousal develops (Fazio et al. 1977; Fink et al. 1983; Fiske and Taylor 1991; Heider 1958; Michener and DeLamater 1999; Petty et al. 1997; Wood 2000). To put an end to these feelings of “cognitive dissonance,” individuals often attempt to minimize the salience of the situation that is causing the negative affect (Fiske and Taylor 1991; Heider 1958; Michener and DeLamater 1999). In other words, individuals who interact with peers who espouse beliefs unlike their own may withdraw from civic activities to reduce their own state of cognitive dissonance and maintain harmony in the peer group.
This said, while a growing body of evidence suggests that disagreeable civic talk suppresses civic participation, not all studies lead to the same conclusion. For example, Huckfeldt and his colleagues (2002, 2004) found that political disagreement is actually quite frequent in social networks. They suggest that disagreement can occur among peers because social groups are not closed systems; even if some of your peers disagree with you about politics and current events, someone else in your social circle is likely to agree with your views. Moreover, in direct contrast to the findings presented by Mutz (2002, 2006), Huckfeldt and colleagues (2002, 2004) found that exposure to disagreement did not have a negative effect on voter turnout in the 1996 and 2000 presidential elections.2
2However, in line with Mutz (2002, 2006), Huckfeldt and colleagues (2002, 2004) show that political ambivalence—in this case, operationalized as having both positive and negative feelings toward candidates running for office—increases when an individual is exposed to disagreement in his or her social network.

Do Your Peers Matter? |
95 |
Ironically, as with the argument put forth by Mutz, the argument forwarded by Huckfeldt and colleagues (2002, 2004) also has a basis in the social psychology literature on cognitive dissonance. In response to disagreement about politics with one’s peers, a person can choose to withdraw from civic activity to reduce dissonance and maintain social harmony in the social network. However, an alternative strategy for soothing dissonance is to remain active in civic activities while simultaneously filtering out, discounting, or avoiding the political views of disagreeable peers (Heider 1958).3 In other words, most of us have friends, colleagues, and relatives with whom we disagree about politics. Rather than withdrawing from civil society, a common response is just to avoid discussing politics with those people to maintain stable social relationships.
Civic Expertise
While there is a great deal of disagreement in the literature on the role of disagreement in social networks, there is consensus on the role of expertise. Specifically, existing research suggests that the more our peers know about politics and current events, the more likely we are to listen to and act on what they say.
To illustrate why civic expertise matters, it is helpful to think about peer groups as a set of interpersonal relationships governed by a system of “social exchange” (Brehm et al. 2002). We enter into and maintain social relationships because our peers supply us with goods that we cannot or do not wish to supply for ourselves. Otherwise stated, in a complex world we cannot be specialists in every aspect of life. Thus, we often defer to the judgments and opinions of experts in our social circles when creating our own judgments and opinions.
Our natural deference to experts is especially acute in the realm of politics and current events (Bar-Tal and Saxe 1990; Beck et al. 2002; Huckfeldt et al. 2000; Lupia and McCubbins 1998; Lake and Huckfeldt 1998; Mendelberg 2002; Popkin 1995). For example, in his oft-cited study of information shortcuts and public opinion, Popkin (1995) shows that the
3Campbell (2006) makes a similar argument in his study of community heterogeneity and voter turnout. This analysis shows a “U”-shaped relationship between community heterogeneity and turnout. Highly homogeneous communities have high levels of turnout because such communities are politically unified and “civically motivated.” Highly heterogeneous communities, by contrast, have high turnout due to political motivations; individuals who disagree with one another are motivated to be active to respond to the political challenges posed by the opposition.
96 |
Chapter 6 |
public is largely inattentive to politics and current events. However, when attention is deemed necessary—say, when the government is about to make a major change in public policy—the public tends to base its opinions on the opinions of political experts (Popkin 1995). In a similar vein, Bar-Tal and Saxe (1990) show that the public pays more attention to, and puts more stock in, the opinions of political experts. So, just as we would go to the expert on poker in our social group to learn what “rivering a belly buster” is (Bellin 2002), we might turn to the resident expert on politics and current events in our social circle for advice on such matters.
Do Your Peers Matter? Survey Evidence
Social Intimacy
Do the characteristics of our peers affect the relationship between civic talk and civic participation? To address this question, I start by examining the role of social intimacy. Specifically, I start by assessing the effect that trust has on the relationship between civic talk and civic participation. Trust is built through repeated interactions between individuals that, if positive, bring those individuals closer to each other. Thus, social trust is a particularly good measure of social intimacy because it indicates how bonded individuals are to each other. Moreover, and of specific interest to the study of civic participation, social trust correlates with higher levels of civic participation (Putnam 2000).
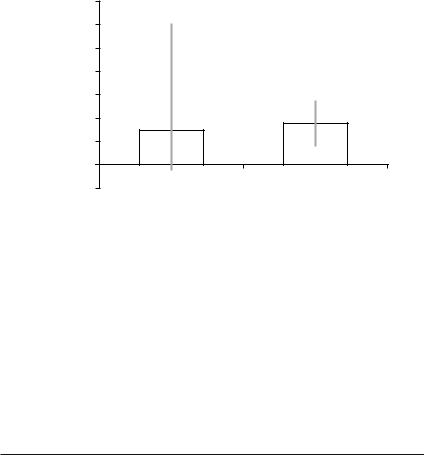
The C-SNIP Panel Survey data show that subjects were relatively trusting of their roommates; on average, subjects trusted their roommates somewhere between “somewhat” and “very much” (a mean of 2.4 on a 0–3 scale ranging from “not at all” to “very much”). The data also show that trust increased the likelihood that roommates would engage in civic talk (t = 6.29, p < .01). Thus, the next logical question to ask is whether this form of social intimacy enhances the influence that peers have over one another. In line with the analyses presented in Chapter 5, C-SNIP Panel Survey participants were split into two groups based on how trusting each respondent was of his or her roommate; specifically, respondents were categorized as either having above average or below average levels of trust in their roommates. The regression analyses in Chapter 3 (see Tables 3.3 and 3.5), which showed the causal effect of civic talk on civic participation for the entire C-SNIP Panel Survey sample, were then conducted separately on the two subsets of subjects. This procedure allows the influence of civic talk to be estimated for roommate pairs with different levels of trust. The results of the analysis are presented in Figure 6.1.
Do Your Peers Matter? |
97 |
Expected Change in Likelihood
Participation |
3.5 |
|
2.0 |
||
|
3.0 |
|
|
2.5 |
|
in |
|
|
Change |
1.5 |
|
1.0 |
||
Expected |
||
0.5 |
||
|
||
|
0 |
|
|
–0.5 |
|
|
0.25 |
|
|
0.20 |
|
Voting |
0.15 |
|
0.10 |
||
|
||
of |
0.05 |
|
|
||
|
0 |
–0.05
–0.10
Voluntary Civic Organizations
Below Average Above Average
Trust in Roommate
Voter Turnout
|
|
|
|
|
|
|
|
|
|
|
|
|
|
|
|
|
|
|
|
|
|
|
|
|
|
|
|
|
|
|
|
|
|
|
|
|
|
|
|
|
|
|
|
|
|
|
|
|
|
|
|
|
|
|
|
|
|
|
|
|
|
|
|
|
|
|
|
|
|
|
|
|
|
|
|
|
|
|
|
|
|
|
|
|
|
|
|
|
|
|
|
|
|
|
|
|
|
|
|
|
|
|
|
|
|
|
|
|
|
|
Below |
Average |
|
Above Average |
|
|||||
|
|
|
|
|
|
|
|
|
|
|
|
|
|
|
|
|
|
|
|
|
|
Trust in Roommate
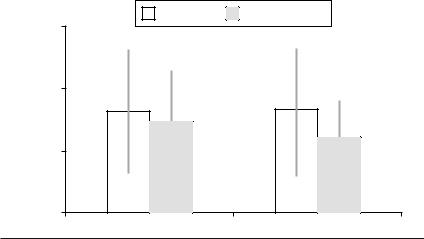
FIGURE 6.1 The intervening effect of trust on the relationship between civic talk and civic participation
Source: C-SNIP Panel Survey
Notes: The line on each bar represents the 95 percent confidence interval about the estimate. The effect of civic talk is calculated as the level of civic participation estimated to have been engaged in by individuals who were exposed to civic talk, minus that of those who were not exposed, all other factors in the model held at their means.
Figure 6.1 shows that social trust enhances the effect of civic talk on civic participation. The civic talk effect for the portion of the sample with above average trust is larger than that for the portion of the sample with below average trust. In fact, the figure shows that only subjects who trusted their roommates experienced a statistically significant increase in civic participation due to engaging in civic talk.

98 |
Chapter 6 |
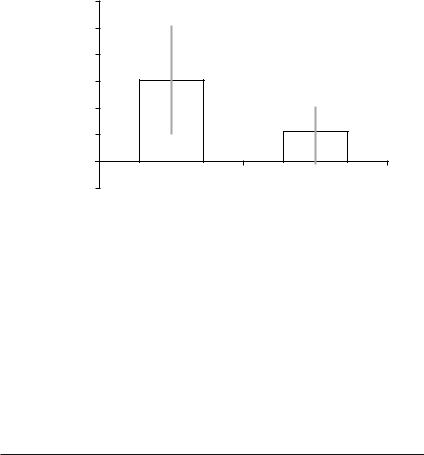
In addition to trust, the C-SNIP Panel Survey contains a measure of how much each subject enjoyed spending time with his or her roommate. On average, subjects “somewhat” enjoyed spending time with their roommates (a mean of 2.0 on a 0–3 scale ranging from “not at all” to “very much”).4 As with social trust, enjoying spending time with one’s roommate correlates with more frequent instances of civic talk discussions between roommates (t = 11.26, p < .01). But does enjoying time with one’s roommate enhance the effect of civic talk the way trust does? Figure 6.2 answers this question using the same method of analysis as that used to produce Figure 6.1.
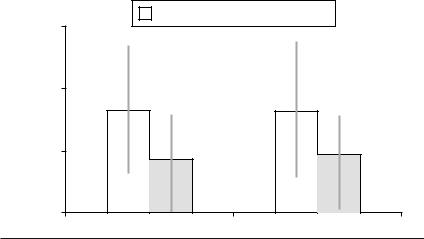
Looking first at the bottom of Figure 6.2, enjoying spending time with one’s roommate enhanced the relationship between civic talk and voter turnout. The increase in turnout due to being exposed to civic talk is much larger in the cohort who reported above average levels of enjoyment. Moreover, the relationship between civic talk and voter turnout is not significant in the cohort with below average levels of enjoyment. The evidence is less clear, however, when we look at the top portion of Figure 6.2. These results show that enjoying the company of one’s roommate does not have an effect on the relationship between civic talk and participation in voluntary civic organizations; both the above average and below average cohorts experienced a significant increase in participation in such groups due to being exposed to civic talk (the regression coefficient for civic talk in the above average cohort is significant at p < .10), and the error about the two estimates overlap.
This said, a looser interpretation of these results suggest a trend whereby those who did not enjoy spending time with their roommates actually participated in more civic organizations due to being exposed to civic talk.5 What explains this anomaly? We might expect trusting and enjoying time with one’s peers to be more or less exchangeable feelings. So why might they function differently when it comes to the relationship between civic talk and participation in voluntary civic organizations? While trust and enjoyment of time spent with one’s roommate are highly correlated
4This figure is roughly in line with national figures. For example, data from the 1992 CrossNational Election Studies (Beck et al. 1995) show that, of the people we choose discuss politics with in our social networks, we consider 92 percent of them to be close friends (see Klofstad et al. 2009, table 2).
5Similar results appear when one examines the overall amount of conversation that the subject had with his or her roommate and how interested the respondent felt the roommate was in his or her life.
Do Your Peers Matter? |
99 |
Expected Change in Likelihood
Participationin |
3.0 |
|
1.5 |
||
|
2.5 |
|
|
2.0 |
|
Change |
1.0 |
|
|
||
Expected |
0.5 |
|
0 |
||
|
||
|
–0.5 |
|
|
0.20 |
|
|
0.15 |
|
Votingof |
0.10 |
|
0.05 |
||
|
0
–0.02
–0.04
Voluntary Civic Organizations
Below Average |
Above Average |
Enjoys Spending Time with Roommate
Voter Turnout
|
|
|
|
|
|
|
|
|
|
|
|
|
|
|
|
|
|
|
|
|
|
|
|
|
|
|
|
|
|
|
|
|
|
|
|
|
|
|
|
|
|
|
|
|
|
|
|
|
|
|
|
|
|
|
|
|
|
|
|
|
|
|
|
|
|
|
|
|
|
|
|
|
|
|
|
|
|
|
|
|
|
|
|
|
|
|
|
|
Below |
Average |
|
Above Average |
|
|||||
|
|
|
|
|
|
|
|
|
|
|
|
|
|
|
|
|
|
|
|
|
|
|
|
|
|
|
|
|
|
|
|
|
Enjoys Spending Time with Roommate
FIGURE 6.2 The intervening effect of enjoying spending time with one’s roommate on the relationship between civic talk and civic participation
Source: C-SNIP Panel Survey
Notes: The line on each bar represents the 95 percent confidence interval about the estimate. The effect of civic talk is calculated as the level of civic participation estimated to have been engaged in by individuals who were exposed to civic talk, minus that of those who were not exposed, all other factors in the model held at their means.
in this sample, they are not perfectly so (r = .66, p < .01). It is therefore possible that, under certain circumstances, these two forms of social intimacy will affect the relationship between civic talk and civic participation in different ways. As such, one way to interpret these results is that individuals who do not enjoy spending time with their roommates have a

100 |
Chapter 6 |
greater incentive to leave their dorm and join voluntary organizations for a social outlet, while those who do enjoy their roommates’ company are happy socializing in the dorm.6 This said, it is important to underscore that the results in the top portion of Figure 6.2 only suggest a trend; the results are not definitive.
Peer Group Homogeneity
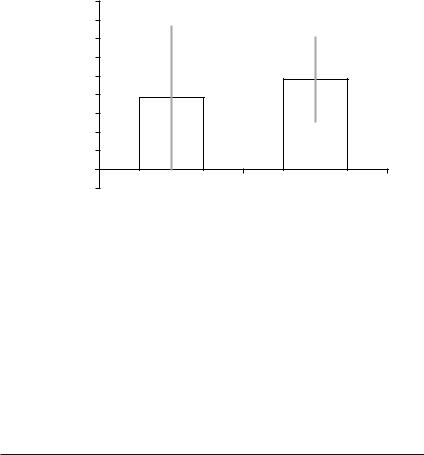
When asked how similar they felt to their roommates, the C-SNIP Panel Survey subjects, on average, felt that they were between “somewhat similar” and “somewhat dissimilar” to their roommate (a mean of 1.6 on a 0–3 scale ranging from “not at all similar” to “very similar”). This relatively low level of homogeneity is not surprising, given that roommate pairings were made at random. As with social intimacy, C-SNIP Panel Survey participants who reported feeling similar to their roommates were more likely to engage in civic talk (t = 7.15, p < .01). The intervening role of this general measure of homogeneity on the relationship between civic talk and civic participation is presented in Figure 6.3. In line with expectations, the effect of civic talk on both measures of civic participation is larger, and more statistically reliable, for individuals who felt that they were similar to their roommates (the effect of civic talk on participation in voluntary civic organizations for the below average cohort comes close to, but does not reach, statistical significance at p = .11).
The results in Figure 6.3 show that a general sense of similarity to one’s peers enhances the effect of civic talk. But what effect do the political attitudes of one’s peers have on the relationship between civic talk and civic participation? On average, the C-SNIP Panel Survey subjects felt that their own views on politics and current events fell somewhere between “somewhat similar” and “somewhat dissimilar” to those of their roommates (a mean of 1.6 on a 0–3 scale ranging from “not at all similar” to “very similar”). Again, this relatively low level of homogeneity is not surprising, given that roommates were paired at random.7 The C-SNIP Panel Survey data also show that roommates who shared similar views about politics and current events engaged in more civic talk (t = 6.16, p < .01).
6In contrast, because voting is an a-social activity, the same logic does not apply to voter turnout.
7This figure is roughly in line with national figures. For example, data from the 1992 CrossNational Election Studies (Beck et al. 1995) show that, of the people we choose discuss politics with in our social networks, about half of them agree with us about politics and current events (see Klofstad et al. 2009, table 3).
Do Your Peers Matter? |
101 |
Expected Change in Likelihood
Participation |
1.8 |
||
1.6 |
|||
|
|
||
|
|
1.4 |
|
|
|
1.2 |
|
in |
1.0 |
||
|
|||
Change |
0.8 |
||
0.6 |
|||
|
|
||
Expected |
0.4 |
||
0.2 |
|||
|
|
||
|
|
0 |
|
|
|
–0.2 |
|
|
|
0.25 |
|
|
|
0.20 |
|
|
|
0.15 |
|
Voting |
|
0.10 |
|
|
0.05 |
||
|
|
||
of |
|
0 |
|
|
|
||
|
–0.05 |
||
|
–0.10 |
||
|
–0.15 |
||
|
–0.20 |
||
Voluntary Civic Organizations
Below Average |
Above Average |
Overall Similarity with Roommate
Voter Turnout
|
|
|
|
|
|
|
|
|
|
|
|
|
|
|
|
|
|
|
|
|
|
|
|
|
|
|
|
|
|
|
|
|
|
|
|
|
|
|
|
|
|
|
|
|
|
|
|
|
|
|
|
|
|
|
|
|
|
|
|
|
|
|
|
|
|
|
|
|
|
|
|
|
|
|
|
|
|
|
|
|
|
|
|
|
|
|
|
|
|
|
|
|
|
|
|
|
|
|
|
Below |
Average |
|
Above Average |
||||||
|
|
|
|
|
|
|
|
|
|
|
|
|
|
|
|
|
|
|
|
|
|
|
|
|
|
|
|
|
|
|
|
|
Overall Similarity with Roommate
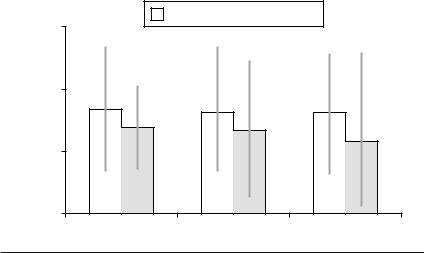
FIGURE 6.3 The intervening effect of overall similarity with one’s roommate on the relationship between civic talk and civic participation
Source: C-SNIP Panel Survey
Notes: The line on each bar represents the 95 percent confidence interval about the estimate. The effect of civic talk is calculated as the level of civic participation estimated to have been engaged in by individuals who were exposed to civic talk, minus that of those who were not exposed, all other factors in the model held at their means.
The results in Figure 6.4 show that the effect of peer group homogeneity on the relationship between civic talk and civic participation is magnified when we move our attention from a general measure of similarity to a more specific measure of political similarity. Relative to the results in Figure 6.3, the gap in the size of the civic talk effect between the above and below average political agreement cohorts is larger.

102 |
Chapter 6 |
Expected Change in Likelihood
Participation |
2.0 |
|
1.5 |
||
|
||
in |
1.0 |
|
|
||
Change |
0.5 |
|
Expected |
0 |
|
|
||
|
–0.5 |
|
|
0.20 |
|
|
0.15 |
|
Votingof |
0.10 |
|
0.05 |
||
|
0
–0.05
–0.10
Voluntary Civic Organizations
|
|
|
|
|
|
|
|
|
|
|
|
|
|
|
|
|
|
|
|
|
|
|
|
|
|
|
|
|
|
|
|
|
|
|
|
|
|
|
|
|
|
|
|
|
|
|
|
|
|
|
|
|
|
|
|
|
|
|
|
|
|
|
|
|
|
|
|
|
|
|
|
|
|
|
|
|
|
Below |
Average |
|
Above Average |
|
|||||
|
|
|
|
|
|
|
|
|
|
|
|
|
|
|
|
|
|
|
|
|
|
Political Similarity with Roommate
Voter Turnout
|
|
|
|
|
|
|
|
|
|
|
|
|
|
|
|
|
|
|
|
|
|
|
|
|
|
|
|
|
|
|
|
|
|
|
|
|
|
|
|
|
|
|
|
|
|
|
|
|
|
|
|
|
|
|
|
Below |
Average |
|
Above Average |
||||||
|
|
|
|
|
|
|
|
|
|
|
|
|
|
|
|
|
|
|
|
|
|
|
|
|
|
|
|
|
|
|
|
|
Political Similarity with Roommate
FIGURE 6.4 The intervening effect of political similarity with one’s roommate on the relationship between civic talk and civic participation
Source: C-SNIP Panel Survey
Notes: The line on each bar represents the 95 percent confidence interval about the estimate. The effect of civic talk is calculated as the level of civic participation estimated to have been engaged in by individuals who were exposed to civic talk, minus that of those who were not exposed, all other factors in the model held at their means.
In summation, the data presented in Figures 6.3 and 6.4 offer a different perspective on political disagreement compared with the extant literature on this subject. Existing research shows that the peer group homogeneity enhances the effect of civic talk, and the C-SNIP data corroborate this. The story becomes more complicated, however, when we

Do Your Peers Matter? |
103 |
shift our attention to heterogeneity. Half of the existing scholarship on this topic suggests that exposure to political disagreement suppresses civic participation (Mutz 2002, 2006), while the other half says that it does not (Huckfeldt et al. 2002, 2004). The C-SNIP Panel Survey data suggest a split of the difference between these two perspectives. These data do not show that exposure to disagreeable peers suppresses civic participation. For this to be the case, the “below average” bars presented in Figures 6.3 and 6.4 would need to be negative and statistically significant. In contrast, the evidence shows that exposure to disagreeable peers had no detectable effect on civic participation.
Civic Expertise
Finally, along with social intimacy and peer group homogeneity, one would expect the civic expertise of our peers to affect how much we act on what they say. One measure of expertise in the C-SNIP Panel Survey was based on how much each subject felt that his or her roommate knew about politics and current events. On average, subjects felt that their roommates were “somewhat” knowledgeable about civic matters (a mean of 1.9 on a 1–3 scale ranging from “not much” to “a great deal”).8 C-SNIP Panel Survey subjects also reported that they were more likely to engage in civic talk when they perceived their roommates to be knowledgeable about politics and current events (t = 8.18, p < .01).
The results in Figure 6.5 conform to the expectation that individuals with greater levels of expertise in politics and current events will have more sway over their peers when engaging in civic talk. Focusing first on the top portion of the figure, the magnitude of the effect of civic talk on participation in voluntary civic organizations is approximately the same regardless of how knowledgeable one’s roommate is about politics and current events. However, the effect of being exposed to civic talk is statistically significant only for the cohort whose roommates had above average political knowledge. Likewise, looking at the bottom portion of the figure, only those subjects in the above average knowledge cohort experienced a significant increase in voter turnout due to being exposed to civic talk (the estimated effect of engaging in civic talk is significant at p < .10 for the above average cohort).
8This figure is roughly in line with national figures. For example, data from the 1992 CrossNational Election Studies (Beck et al. 1995) show that of the people we choose discuss politics with in our social networks, more than half of them are knowledgeable about politics and current events (see Klofstad et al. 2009, table 3).

104 |
Chapter 6 |
Expected Change in Likelihood
Participationin |
2.5 |
|
2.0 |
||
|
||
|
1.5 |
|
Change |
1.0 |
|
0.5 |
||
Expected |
0 |
|
|
||
|
–0.5 |
|
|
0.25 |
|
|
0.20 |
|
|
0.15 |
|
|
0.10 |
|
ofVoting –0.05 |
||
|
0.05 |
|
|
0 |
|
–0.10
–0.15
–0.20
–0.25
Voluntary Civic Organizations
|
|
|
|
|
|
|
|
|
|
|
|
|
|
|
|
|
|
|
|
|
|
|
|
|
|
|
|
|
|
|
|
|
|
|
|
|
|
|
|
|
|
|
|
|
|
|
|
|
|
|
|
|
|
|
|
|
|
|
|
|
|
|
|
|
|
|
|
|
|
|
|
|
|
|
|
|
|
|
|
|
|
|
|
|
|
|
|
|
|
|
|
|
|
|
|
|
Below |
|
Average |
|
Above Average |
|
|||||
|
|||||||||||
|
|
|
|
|
|
|
|
|
|
|
|
Roommate’s Political Knowledge
Voter Turnout
|
|
|
|
|
|
|
|
|
|
|
|
|
|
|
|
|
|
|
|
|
|
|
|
|
|
|
|
|
|
|
|
|
|
|
|
|
|
|
|
|
|
|
|
|
|
|
|
|
|
|
|
|
|
|
|
|
|
|
|
|
|
|
|
|
|
|
|
|
|
|
|
|
|
|
|
|
|
|
Below |
Average |
|
Above Average |
||||||||
|
|
|
|
|
|
|
|
|
|
|
|
|
|
|
|
|
|
|
|
|
|
|
|
|
|
|
|
|
|
|
|
|
|
|
|
|
|
|
|
|
|
|
|
|
|
|
|
|
|
|
|
Roommate’s Political Knowledge
FIGURE 6.5 The intervening effect of roommate’s knowledge about politics and current events on the relationship between civic talk and civic participation
Source: C-SNIP Panel Survey
Notes: The line on each bar represents the 95 percent confidence interval about the estimate. The effect of civic talk is calculated as the level of civic participation estimated to have been engaged in by individuals who were exposed to civic talk, minus that of those who were not exposed, all other factors in the model held at their means.
The C-SNIP Panel Survey also asked subjects how active and interested they thought their roommates were in politics and current events. On average, subjects lived with roommates whom they felt were somewhere between “not very” and “somewhat” active and interested in civic activities (a mean of 1.4 on a 0–3 scale ranging from “not at all” to “very”). As was

Do Your Peers Matter? |
105 |
the case with knowledge, subjects with civically engaged roommates were exposed to more civic talk (t = 10.80, p < .01).9 This result makes sense, given that the focus group results presented in Chapter 3 show that civic talk most often occurs in response to activities, such as consumption of news media content or participation in civic activities, engaged in by peers.
The intervening role of roommates’ civic activity and interest is examined in Figure 6.6. Beginning with the bottom half of the figure, the data show that roommates’ civic engagement enhances the effect of civic talk on voter turnout. In fact, the below average cohort’s pattern of voting does not appear to have been affected at all by being exposed to civic talk. In contrast, the top half of Figure 6.6 shows the opposite result for participation in voluntary civic organizations; only the below average cohort experienced a statistically significant increase in participation in civic organizations due to being exposed to civic talk.
What explains this difference? In line with results presented in Chapter 5, it could be a product of the less political nature of participation in voluntary organizations. The activities included in this measure of participation were civically oriented student groups such as student publications and charitable and community service groups. Although some of these organizations no doubt engage in politically relevant activities, these forms of civic participation are not overtly aimed at affecting the government. In contrast, voting is an explicitly political act. Consequently, civically engaged individuals should be expected to have a positive effect on the voter turnout rates of their roommates but not necessarily on their participation in non-political civic organizations.
But what explains the positive effect that peers with below average levels of civic engagement have on the relationship between civic talk and participation in voluntary civic organizations? Recall that the same phenomenon was found in Figure 6.2, where not enjoying spending time with one’s roommate had a positive effect on the relationship between civic talk and participation in voluntary civic organizations. Also recall that the C-SNIP Panel Survey participants saw great virtue in civic participation: As earlier chapters documented, 91 percent of the respondents reported that civic participation was somewhat or very important. Consequently, perhaps C-SNIP respondents did not enjoy spending time with civically
9Subjects were also marginally more civically active if their roommates were active and interested in politics and current events (voluntary civic organizations: t = 1.92, p = .07; voter turnout: t = 1.94, p = .06), suggesting that some behavioral modeling is occurring between roommates. (See Chapter 4 for a discussion of social norms in the context of civic talk among peers.)
106 |
Chapter 6 |
Expected Change in Likelihood
Participation |
1.8 |
|
1.6 |
||
|
||
|
1.4 |
|
|
1.2 |
|
in |
1.0 |
|
|
||
Change |
0.8 |
|
0.6 |
||
|
||
Expected |
0.4 |
|
0.2 |
||
|
||
|
0 |
|
|
–0.2 |
|
|
0.35 |
|
|
0.30 |
|
|
0.25 |
|
Votingof |
0.20 |
|
0.05 |
||
|
0.15 |
|
|
0.10 |
|
|
0 |
–0.05
–0.10
–0.15
Voluntary Civic Organizations
|
|
|
|
|
|
|
|
|
|
|
|
Below Average |
Above |
|
Average |
||
|
|||||
Roommate’s Civic Interest and Activity
Voter Turnout
|
|
|
|
|
Below |
Average |
Above Average |
||
|
|
|
|
|
Roommate’s Civic Interest and Activity
FIGURE 6.6 The intervening effect of roommate’s civic interest and activity on the relationship between civic talk and civic participation
Source: C-SNIP Panel Survey
Notes: The line on each bar represents the 95 percent confidence interval about the estimate. The effect of civic talk is calculated as the level of civic participation estimated to have been engaged in by individuals who were exposed to civic talk, minus that of those who were not exposed, all other factors in the model held at their means.
disengaged roommates and thus had a greater incentive to leave their dorm rooms and participate in voluntary civic organizations as a social outlet. The C-SNIP Panel Survey data offer evidence in favor of this hypothesis, as respondents with civically disengaged roommates were less likely to say that they enjoyed spending time with their roommates than respondents with engaged roommates (t = −5.65, p < .01).
Do Your Peers Matter? |
107 |
Do Our Peers Matter? Focus Group Evidence
One of the benefits of focus groups is that they are semi-structured. While the moderator has a predefined path of questions to go through during the session, participants are given free rein to weave their way through those questions as they see fit. This method of data collection allows rich qualitative data to be generated on topics of discussion that are the most salient to the focus groups’ participants. The potential cost associated with the freeform nature of focus groups, however, is the prospect that not every subject of interest to the researcher will be addressed by the participants. This ended up being the case with the subject of peer characteristics: The focus group participants did not volunteer much evidence on the impact that their roommates’ characteristics had on the relationship between civic talk and civic participation.
This said, as addressed in Chapter 3, participants in each of the focus groups provided a great deal of insight on the relationship between political disagreement and civic talk. In each of the focus groups, the desire to avoid disagreements or arguments with roommates was a common explanation for why civic talk was infrequent and sometimes even actively avoided. This type of exchange was typical in all four of the focus groups:
PARTICIPANT: I think my roommate has the opposite view that I do. I don’t know, because I don’t really talk to her, but I get that impression. So I figure I will just avoid it just to save time so we don’t fight about it or, like, I don’t know, get in a disagreement.
MODERATOR: That’s interesting. So it’s a way to avoid conflict?
PARTICIPANT: Yeah.
Unlike the C-SNIP Panel Survey data, these types of statements do not give us much insight on how disagreement might directly mitigate or enhance the effect of civic talk. They do show, however, that most individuals feel a desire to avoid civic talk with peers who do not share their political preferences. Consequently, the focus group data show that disagreement has an indirect impact on the civic talk effect by decreasing the amount of civic talk that one chooses to engage in.
Conclusion
Building on the results presented in Chapter 5, the purpose of this chapter was to shift focus from ourselves to the characteristics of our peers. Overall, the results presented in this chapter show that the characteristics of
108 |
Chapter 6 |
our peers matter a great deal. Social intimacy tends to enhance the positive effect of civic talk on civic participation. Peers who are more similar to us, both in general and with specific regard to political preferences, also have more influence over whether civic talk leads us to participate in civic activities. Finally, the data show that civic expertise usually enhances the civic talk effect.
In light of these findings, it is worth commenting on one way the results presented in this chapter might differ from those generated by more naturally occurring social relationships. As discussed in Chapters 1 and 2, when constructing a social network of peers we select the individuals we wish to socialize with from the set of people who are available in our immediate social environment. In contrast to this process of network formation, the peer groups examined in this book were exogenously forced onto the study subjects.
As discussed in Chapter 2, while this process does not perfectly mirror how networks form in nature, it presents a unique way to estimate the impact that peer characteristics have on the civic talk effect. For example, think about the people in your inner circle of friends, loved ones, and colleagues. No doubt you feel a high level of social intimacy with these individuals, which either led you to select them as peers in the first place or developed over time as you forged relationships with them. In more technical terms, there is probably very little variance in the level of social intimacy in your social network. Consequently, without variance on this variable, we cannot get an accurate estimate of how intimacy affects the relationship between civic talk and civic participation. In contrast, by randomly assigning individuals to social networks, the C-SNIP studies created variance on intimacy, as well as the other peer characteristics examined in this chapter, allowing me to more accurately estimate how those characteristics affect the relationship between civic talk and civic participation.
In the next chapter, the focus of this study shifts away from the immediate effect of civic talk on civic participation to address three additional questions. First, given the extant literature’s focus on individual-level antecedents of civic participation, how does the effect of civic talk compare with the effect of one’s individual characteristics? Second, while civic talk has a significant effect on civic participation, does it have an effect on other politically relevant attitudes and behavior? And finally, does the effect of civic talk last beyond the initial point of exposure?

7
The Significant and Lasting
Effect of Civic Talk
n the previous chapters I showed how, why, and under what conditions Icivic talk affects one’s patterns of civic participation. While these findings extend our knowledge on participatory democracy, three important questions have been left unanswered. First, given the extant literature’s focus on individual-level antecedents of civic participation, how does the magnitude of the civic talk effect compare to that of one’s individual characteristics? Second, while civic talk has a significant effect on civic participation, does it have an effect on other politically relevant attitudes and behaviors? Finally, does the relationship between civic talk and civic participation last beyond the initial point of exposure to such conversations? To answer the first two questions, I take a closer look in this chapter at the first two waves of the C-SNIP Panel Survey. With regard to the
relative significance of civic talk, these data show that the effect of civic talk is typically equal to or greater than the effect of individual-level antecedents of civic participation. The C-SNIP data also show that civic talk has a significant effect on other politically relevant attitudes and behaviors, such as political knowledge and civic engagement.
Finally, to assess whether the effect of civic talk lasts beyond the point of initial exposure I examine the third wave of the C-SNIP Panel Survey collected during the study population’s fourth year in college. These data show that the effect of civic talk lasts beyond the initial point of exposure—in this case, three years into the future. Further analysis
110 |
Chapter 7 |
shows that the boost in civic participation initially after engaging in civic talk is the mechanism by which the effect of civic talk lasts into the future— that is, causing an initial increase in civic participation is the mechanism by which the effect of civic talk lasts.
The Effect of Civic Talk Relative to
Other Antecedents of Civic Participation
The main focus of this study has been to show how, why, and under what circumstances civic talk leads individuals to participate in civil society. However, as discussed throughout this book, the preponderance of research on civic participation focuses on individual-level characteristics and largely excludes social-level factors such as civic talk. This begs the question of how the effect of civic talk compares with individual-level antecedents of civic participation.
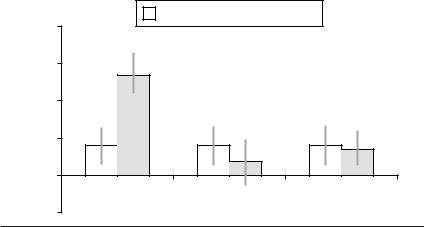
Figure 7.1 presents a first cut at this question by examining the effect of civic talk relative to, and while simultaneously controlling for, a number of different measures of one’s prior experience with civic participation. For the sake of simplicity, the results presented are only for participation in voluntary civic organizations as the dependent variable. The results are similar, however, for voter turnout. As in previous chapters, the effect of civic talk (white bars) is calculated as the level of participation engaged in by individuals who were exposed to civic talk, minus that of those who
Civic Talk |
|
Prior Experience |
|
4 |
|
|
Participation |
3 |
|
|
2 |
|
|
|
in |
|
|
|
|
|
|
|
Change |
1 |
|
|
|
|
|
|
Expected |
0 |
|
|
Past |
Parental |
Civic Talk |
|
Participation |
Activity/Interest |
at Home |
|
|
–1 |
|
|
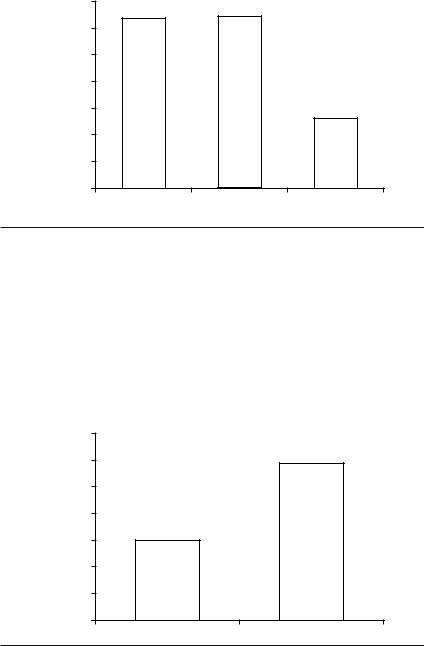
FIGURE 7.1 The effect of civic talk relative to prior experience
Source: C-SNIP Panel Survey
Notes: The line on each bar represents the 95 percent confidence interval about the estimate. Figures are based on regression analyses of matched data (see Appendix C).
The Significant and Lasting Effect of Civic Talk |
111 |
Expected Change in Participation
Civic Talk |
|
Civic Engagement |
1.5
1.0
0.5 |
|
0 |
|
Interest in Politics |
Efficacy |
FIGURE 7.2 The effect of civic talk relative to civic engagement
Source: C-SNIP Panel Survey
Notes: The line on each bar represents the 95 percent confidence interval about the estimate. Figures are based on regression analyses of matched data (see Appendix C).
were not exposed, all other factors in the model held at their means. The effect of prior experience (shaded bars) is calculated between the mean and maximum, all other factors held at their means. The analysis also controls for a lag of the dependent variable (i.e., civic participation in high school) and dormitory fixed effects (none of which were statistically significant).
As shown in Chapter 3 (Figure 3.1), the bars on the far left-hand side of Figure 7.1 show that one’s past experience participating in civic activities has a larger effect on civic participation than civic talk does. This said, the effect of civic talk is still significant, even after controlling for prior participatory experience. The middle of the figure shows that civic talk has a statistically significant effect on civic participation, while the attitudes and behavioral patterns of one’s parents do not. The far right-hand side of the figure shows that the effect of engaging in civic talk with one’s peers is about on par with the effect of engaging in such conversations with one’s parents before leaving home for college; the size of the effects for both factors are roughly equal, and the error about these two estimates overlap.
The results presented in Figure 7.2 extend this analysis to civic engagement, measured as one’s interest in politics and current events and one’s sense of political efficacy. The left-hand side of the figure shows that the effect of civic talk is on par with that of one’s interest in politics, even while simultaneously controlling for interest in politics. The results on the right-hand side of the figure are similar for political efficacy.
112 |
Chapter 7 |
The data presented in Figure 7.3 show the influence of civic talk relative to the strength of one’s political preferences. The C-SNIP data show that individuals with stronger political preferences are significantly more likely to participate in voluntary civic organizations (partisan strength: r =
.14, p < .01; ideological strength: r = .14; p < .01). Nonetheless, the data in Figure 7.3 show that the effect of civic talk on civic participation is on par with the strength of one’s political preferences.
As a final set of analyses, Figure 7.4 presents the effect of engaging in civic talk relative to that of civic expertise, one’s level of preparedness to participate in civic activities. At the far left-hand side of the figure, the data show that civic talk and one’s self-reported level of knowledge about politics and current events have the same effect on civic participation. Focusing on the middle of the figure, the same can be said when we compare the effect of civic talk to how often one watches or reads the news for information about politics and current events. The far right-hand side tells the same story when we examine the educational attainment of respondents’ parents (the proxy for education used in Chapter 5, since each respondent had the same degree of educational attainment when the C-SNIP Panel Survey was conducted).
Expected Change in Participation
Civic Talk |
|
Preference Strength |
1.5
1.0
0.5 |
|
0 |
|
Partisan Strength |
Ideological Strength |
FIGURE 7.3 The effect of civic talk relative to strength of political preferences
Source: C-SNIP Panel Survey
Notes: The line on each bar represents the 95 percent confidence interval about the estimate. Figures are based on regression analyses of matched data (see Appendix C).
The Significant and Lasting Effect of Civic Talk |
113 |
Expected Change in Participation
Civic Talk |
|
Civic Expertise |
1.5
1.0
0.5 |
|
|
0 |
|
|
Knowledge |
Media Use |
Parents’ |
|
|
Education |
FIGURE 7.4 The effect of civic talk relative to civic expertise
Source: C-SNIP Panel Survey
Notes: The line on each bar represents the 95 percent confidence interval about the estimate. Figures are based on regression analyses of matched data (see Appendix C).
The Effect of Civic Talk on
Other Civically Relevant Phenomena
Another way to illustrate the substantive significance of civic talk is to shift the focus away from civic participation to other civically relevant phenomena. I begin this examination by looking at the effect of civic talk on various measures of civic engagement. The data in Figure 7.5 show the percent change in civic engagement as a consequence of engaging in civic talk. In contrast to previous analyses in this book, I examine percent change in various measures of civic engagement instead of change in the raw scale of each factor because the variables are scaled differently. Each of the analyses presented in Figure 7.5 controls for the respondent’s level of civic engagement before being engaging in civic talk (i.e., a lag of the dependent variable) and dormitory fixed effects (none of which were significant). The effect of civic talk is calculated as the level of civic engagement among those who were exposed to civic talk, minus that of those who were not exposed, all other factors held at their means.
The results show that, even after controlling for how civically engaged one was before engaging in civic talk, being exposed to such discourse still increases one’s level of engagement with politics and current events.
114 |
Chapter 7 |
Percentage Change |
Engagement |
Expected |
in |
14
12
10
8
6
4
2
0
Political |
Political |
Efficacy |
Interest |
Involvement |
|
FIGURE 7.5 The effect of civic talk on civic engagement
Source: C-SNIP Panel Survey
Notes: Error bars are not presented because each effect is statistically significant at p ≤ .05. Figures are based on regression analyses of matched data (see Appendix C).
Moving from left to right on the graph, we see that students who engaged in civic talk increased their level of interest in politics and current events by about 13 percent. The middle of the graph shows that civic talk also led subjects to be 13 percent more likely to say that they would engage in political activities, as opposed to community activities, as a way to address
Expected Percentage Change |
in Expertise |
14
12
10
8
6
4
2
0
Political Knowledge |
News Media Use |
FIGURE 7.6 The effect of civic talk on civic expertise
Source: C-SNIP
Notes: Error bars are not presented because each effect is statistically significant at p ≤ .05. Figures are based on regression analyses of matched data (see Appendix C).

The Significant and Lasting Effect of Civic Talk |
115 |
important political issues. Finally, the far right-hand side of the graph shows that civic talk increased one’s sense of political efficacy by close to 6 percent.
The data presented in Figure 7.6 show similar results for civic expertise. Again, even after controlling for past levels of expertise, the left-hand side of the figure shows that civic talk increased one’s self-reported level of knowledge about politics and current events by about 8 percent. The right-hand side of the graph shows that individuals who engaged in civic talk were 12 percent more likely to watch or read the news media for information on politics and current events.
While civic talk has a meaningful effect on a number of civically relevant phenomena, however, it is important to discuss the various factors on which civic talk does not have an effect. Examples of these are presented in Table 7.1. After controlling for one’s attitudes prior to engaging in civic talk (i.e., a lag of the dependent variable), the first two columns of Table 7.1 show that civic talk has no effect on the intensity or direction of this population’s political preferences. The last two columns of the table also show that civic talk had no effect on trust in government or one’s sense that the government is run for the benefits of all citizens as opposed to the benefit of the better heeled and more powerful among us.
TABLE 7.1 Variables on which civic talk has no effect (regression analysis)
|
Partisan |
Partisan- |
Trust in |
Government |
|
strengtha |
shipa |
governmenta |
run for allb |
|
(1) |
(2) |
(3) |
(4) |
|
|
|
|
|
Civic talk among roommates |
.03 |
>−.01 |
−.02 |
.09 |
|
(.06) |
(.05) |
(.05) |
(.17) |
Attitude in high school |
.67*** |
.80*** |
.53*** |
2.15*** |
|
(.23) |
(.03) |
(.03) |
(.19) |
Constant |
1.92 |
1.52** |
.81** |
−2.33 |
|
(.66) |
(.56) |
(.38) |
(3.17) |
Adjusted R2 |
.23 |
.66 |
.30 |
|
Akaike’s information criterion |
|
|
|
1,091 |
(AIC) |
|
|
|
|
Source: C-SNIP Panel Survey.
Model Type: aOrdinary least squares (Imai et al. 2007c). bLogistic regression (Imai et al. 2007d).
Note: The matched data set is used in this analysis (see Appendix C). AIC is twice the number of parameters in the model, minus twice the value of the model’s log-likelihood. Dormitory assignment fixed effects were included in the analysis but are omitted from the table (none of these coefficients were statistically significant). An analysis of ideology and ideological strength shows results that are similar to those for partisanship and partisan strength. Standard errors are in parentheses. N = 1,044.
*p ≤ .10; **p ≤ .05; ***p ≤ .01.
116 |
Chapter 7 |
The Lasting Effect of Civic Talk
The previous two sections illustrate the significant effect that civic talk has on participatory democracy. Not only does the effect of civic talk stack up to individual-level antecedents of civic participation, but it also has a positive effect on other civically relevant attitudes and behavior. All of these findings, however, focused on the initial effect of engaging in civic talk. What about the future? Does the effect of civic talk last beyond the initial moments after such conversations? To address this question, I examine data from the third and final wave of the C-SNIP Panel Survey, collected during this populations’ fourth year in college.
Patterns of Civic Participation over Time
Before examining whether the effect of civic talk lasts beyond the initial point of exposure, it is instructive to look at how and why the patterns of civic participation in the study population changed as the students progressed from high school to their fourth year of college. These trends are listed in Table 7.2.
The first two columns of Table 7.2 show that the participants in the C-SNIP Panel Survey became far less civically active once they arrived at college. As discussed in Chapter 3, one explanation for this decline in civic activity is that, after leaving home for college, civic participation becomes less of a priority as a person spends his or her time and energy learning how to navigate life as an independent adult. Data from the C-SNIP Panel Survey offer evidence that supports this hypothesis. For example, survey respondents felt that they became less informed about politics and current
TABLE 7.2 Patterns of civic participation over time (mean activity levels)
|
|
|
1st year |
|
4th year |
|
High school |
|
of college |
|
of college |
|
(1) |
|
(2) |
|
(3) |
|
|
|
|
|
|
Participation in voluntary |
|
|
|
|
|
civic organizations |
|
|
|
|
|
(0–21 point activity scale) |
6.6 |
> |
2.4 |
< |
3.2 |
Participation in political activities |
|
|
|
|
|
(0–6 point activity scale) |
1.2 |
> |
.6 |
< |
.8 |
Voter turnout (%) |
|
|
51 |
< |
64 |
|
|
|
|
|
|
Source: C-SNIP Panel Survey. |
|
|
|
|
|
> or < indicates a significant paired difference of means at p < .01.

The Significant and Lasting Effect of Civic Talk |
117 |
TABLE 7.3 Changes in civically relevant characteristics during college (means)
|
1st year |
4th year |
|
of college |
of college |
|
|
|
Interest in politics and current events (1–4 point scale) |
2.7 |
3.0 |
Knowledge about politics and current events (1–3 point scale) |
1.9 |
2.0 |
Strength of partisan identity (1–3 point scale) |
2.0 |
2.1 |
Strength of ideology (1–3 point scale) |
2.0 |
2.2 |
Attention to news media (days per week that news |
|
|
is watched or read) |
3.3 |
4.0 |
Source: C-SNIP Panel Survey.
p < .01 for differences in these characteristics between the first and fourth years of college (paired t-tests).
events (t = −7.28, p < .01), and were less likely to consume news about politics and current events (t = −7.36, p < .01) after moving to college. As also discussed in Chapter 3, another explanation for the decline in civic participation between high school and college is the prevalence of service learning opportunities at the time that this cohort of students was progressing through primary and secondary school. Participation in these programs may have led these students to participate in an abnormally high number of civic activities during high school. Data from the C-SNIP Focus Group study corroborate this hypothesis.
In contrast to this trend of decreased civic participation between high school and the first year of college, comparing the second and third columns in Table 7.2 shows that the C-SNIP Panel Survey participants became significantly more civically active between their first and fourth years of college. Table 7.3 offers a suggestion for why these students became more civically active as they progressed through college. During their fourth year of college, study subjects were more interested in and knowledgeable about politics and current events, held stronger partisan and ideological beliefs, and were more likely to use the news media to keep up to date on politics and current events than in their first year of college. These trends documented in Tables 7.2 and 7.3 echo the extant literature on civic participation, which shows that individuals become more civically active and engaged as they age (e.g., Putnam 2000).1
1An additional explanation is that young people have an incentive to be civically active in high school to build their résumé and get into college. This incentive may be weak early in one’s college career but strengthens as one approaches graduation and moving on to graduate school or the workforce.

118 |
Chapter 7 |
Does the Civic Talk Effect Last?
The evidence presented thus far shows that civic talk has a significant effect on civic participation during the initial point of exposure. But what role, if any, did civic talk during the first year of college play in increasing the civic activity of the C-SNIP participants during the remainder of their tenure in college? To address this question, I used a style of regression analysis similar to that used in previous chapters. In the previous analyses, I examined the immediate effect of civic talk on civic participation (civic participation measured during the second wave of the C-SNIP Panel Survey as the dependent variable). In the analyses that follow, I look at the effect of civic talk that occurred during the first year of college on patterns of civic participation during the fourth year of college (civic participation measured during the third wave of the C-SNIP Panel Survey as the dependent variable). I begin the analysis in Figure 7.7 with an examination of the effect of civic talk on participation in voluntary civic organizations. As done previously, the analysis included civic talk, civic participation in high school (i.e., a lag of the dependent variable), and dormitory fixed effects (none of which were significant). The effect of civic talk is calculated as the level of participation engaged in by those who were exposed to civic talk, minus that of those who were not exposed, all other factors in the model held at their means.
Expected Change in Participation
1.4
1.2
1.0
0.8
0.6
0.4
0.2
0
1st Year of College |
4th Year of College |
FIGURE 7.7 The effect of civic talk on participation in voluntary civic organizations over time
Source: C-SNIP Panel Survey
Notes: The line on each bar represents the 95 percent confidence interval about the estimate. Figures are based on regression analyses of matched data (see Appendix C).

The Significant and Lasting Effect of Civic Talk |
119 |
TABLE 7.4 The effect of civic talk on voter turnout and political participation over time (regression analysis)
|
Voter turnout |
Political participation |
||
|
1st year |
4th year |
1st year |
4th year |
|
of college |
of college |
of college |
of college |
|
(1) |
(2) |
(3) |
(4) |
|
|
|
|
|
Civic talk |
.31‡ |
−.25 |
−.02 |
.13† |
|
(.19) |
(.25) |
(.09) |
(.10) |
Participation in political activities |
.14** |
.19*** |
.37*** |
.31*** |
during high school |
(.06) |
(.07) |
(.04) |
(.03) |
Constant |
−2.11 |
2.47 |
.55 |
.33 |
|
(2.20) |
(4.50) |
(.76) |
(.86) |
Akaike’s information criterion |
|
|
|
|
(AIC) |
1,283 |
1,187 |
.24 |
.14 |
Source: C-SNIP.
Model Type: Logistic regression (Imai et al. 2007d).
Note: The matched data set is used in this analysis (see Appendix C). AIC is twice the number of parameters in the model, minus twice the value of the model’s log-likelihood. Dormitory assignment fixed effects were included in the analysis but are omitted from the table (none of the coefficients were statistically significant). Standard errors are in parentheses. N = 1,044.
†p = .19; ‡p = .12; *p ≤ .10; **p ≤ .05; ***p ≤ .01.
The bar at the far left of Figure 7.7 shows the initial effect that civic talk had on civic participation. As documented in Chapter 3, civic talk increased participation in voluntary civic organizations during the first year of college by 38 percent (an increase from 2.1 to 2.9 on the voluntary organization participation scale). The bar on the right-hand side of the graph shows that civic talk caused a 20 percent increase in civic participation three years later (an increase from 3.0 to 3.6 on the voluntary organization participation scale). While these results show that the influence of civic talk is lasting, they suggest that the effect may diminish over time. However, the confidence intervals around the two estimates overlap. This indicates that, on average, the positive effect of civic talk on participation in voluntary civic organizations did not significantly decrease, despite the passage of three years.
Table 7.4 extends this analysis to voter turnout and political participation. The first two columns of the table examine the effect of civic talk on voter turnout. As shown in Chapter 3 (Table 3.5), the first column of Table 7.4 indicates that civic talk has an immediate effect on voter turnout (as shown in Figure 3.2, the expected increase in turnout is estimated to be significant at p < .05). In the second column of the table, however, the civic talk coefficient for voter turnout during one’s fourth year of college

120 |
Chapter 7 |
is not statistically significant. This shows that conversations about politics and current events did not have a lasting effect on voter turnout in this population. The final two columns of Table 7.4 examine the effect of civic talk on political participation. As shown in Chapter 3 (Table 3.4), the third column of the table indicates that the relationship between civic talk and political participation was not significant in the immediate term. The fourth column of Table 7.4 also shows that civic talk did not have a statistically significant effect on political participation in the long run (although the size of the coefficient increases and comes relatively close to a minimal threshold for statistical significance at p = .19).
Why Does the Effect Last?
What explains the lasting effect of civic talk on civic participation? Despite the lack of extant research on this question, the literature on path dependence offers a theoretical framework for why phenomena persist over time. Simply stated, “path dependence” means that the past plays a role in what will happen in the future. More precisely, path dependence is a process of self-reinforcement “in which preceding steps in a particular direction induce further movement in the same direction” (Pierson 2000, 252). Self-reinforcement occurs because of increasing returns: Once a course of action is initiated, it becomes increasingly costly to change its direction over time (Pierson 2000).2 A process of increasing returns such as this one is initiated by a formative moment in time referred to as a “critical juncture” (Collier and Collier 1991; Pierson 2000). These critical moments may seem insignificant when they occur and yet be traced forward to large and significant outcomes in the future (Pierson 2000).3
While the concept of path dependence traditionally has been applied to studies of institutional development and policymaking, one could argue that civic participation is also a self-reinforcing phenomenon. For example, a number of studies show that individuals who have voted in the past are more likely to vote in the future (Fowler 2006; Gerber et al. 2003; Plutzer 2002). Additional research suggests that other forms of civic activity may also be self-reinforcing (see, e.g., Brady et al. 1999; Burns et al. 2001;
2For example, after more than two hundred years of conducting congressional elections in the United States under the system of single-member district plurality, it would be extremely difficult (logistically and politically) to change to a system of proportional representation.
3For example, while Rosa Parks was only one woman on one bus in one Southern city, her act of civil disobedience in 1955 was a catalyst for the rise of the Civil Rights Movement in the United States.

The Significant and Lasting Effect of Civic Talk |
121 |
Putnam 2000; Rosenstone and Hansen 1993; Verba et al. 1995). For example, Verba and his colleagues (1995) found that individuals who participate in civic activities through their church or a voluntary civic organization also tend to be active in other civic activities, such as volunteering for a political campaign. Research on political socialization also shows that past patterns of civic participation, especially the experiences one has during adolescence and young adulthood, are highly influential in determining how civically active a person will be in the future (see, e.g., Campbell 2006; Jennings and Niemi 1981).
Civic participation is self-reinforcing in this way because the more civically active an individual is today, the easier it becomes for him or her to participate in the future.4 One reason that civic participation is subject to such increasing returns is that individuals require resources (such as knowledge about how to participate) and psychological motivations (such as civic engagement) to participate in civic activities. These prerequisites can be obtained by participating in civic activities (Verba et al. 1995). Otherwise said, we take the experiences we acquire through participating in civic activities today and apply them to participation in the future. Civic participation is also self-reinforcing because citizens who are mobilized to participate in civic activities tend to have been civically active in the past. This is the case because agents of civic mobilization, such as political parties and other civic organizations, are “rational prospectors” (Brady et al. 1999) who want their mobilization efforts to be effective. Thus, they target their blandishments at individuals who are already participating in civil society.
Assuming that civic participation is a self-reinforcing behavior, past patterns of participation will help determine future patterns of participation. Consequently, if engaging in civic talk causes an individual to become more active in civil society, that initial effect should be felt after the point of exposure as the individual parlays his or her current participatory experiences into future participation in civic activities. In other words, causing an initial increase in civic participation could be the mechanism by which the positive effect of civic talk lasts into the future. Table 7.5 offers a test of this hypothesis. Since the long-term effect of civic talk was not statistically significant for voter turnout and political participation, I restrict this analysis to participation in voluntary civic organizations.
4To clarify, my use of path dependence theory in this context varies somewhat from traditional use of the theory. Typically, processes are seen as path-dependent if they become more costly to change over time. In contrast, I am suggesting that civic participation is pathdependent because as a person becomes more active in such activities, it because less costly to participate over time.

122 |
Chapter 7 |
TABLE 7.5 Explaining the effect of civic talk during the first year of college on participation in voluntary civic organizations during the fourth year of college (regression analysis)
|
(1) |
(2) |
|
|
|
Civic talk |
.62* |
.33 |
|
(.31) |
(.31) |
Participation in voluntary civic organizations |
.17*** |
.09** |
during high school |
(.03) |
(.04) |
Participation in voluntary civic organizations |
|
.36*** |
during 1st year of college |
|
(.04) |
Constant |
2.50 |
1.88 |
|
(2.16) |
(1.91) |
Adjusted R2 |
.09 |
.24 |
Source: C-SNIP Panel Survey.
Model Type: Ordinary least squares (Imai et al. 2007c).
Columns: (1) Analysis controlling for the amount of civic participation in which each respondent engaged before engaging in civic talk. (2) Analysis as in column 1, with added consideration of the amount of civic activity each subject engaged in immediately after engaging in civic talk.
Note: The matched data set is used in this analysis (see Appendix C). Dormitory assignment fixed effects were included in the analysis but are omitted from the table (none of the coefficients were statistically significant). Standard errors are in parentheses. N = 1,044.
*p ≤ .10; **p ≤ .05; ***p ≤ .01.
The first column of Table 7.5 shows the lasting effect of civic talk on participation in voluntary civic activities while controlling for the amount of civic participation in which each respondent engaged before being exposed to civic talk; this result was presented graphically on the right-hand side of Figure 7.7. In the second column of Table 7.5, however, the analysis accounts for the amount of civic activity each subject engaged in immediately after engaging in civic talk (the dependent variable in previous analyses). As with the analysis of causal mechanisms in Chapter 4, the goal of adding this variable to the analysis is to “explain away” the effect of civic talk. If the initial boost in civic participation caused by civic talk during one’s first year in college explains why the effect of civic talk lasts into one’s fourth year in college, the civic talk coefficient should no longer be statistically significant after a measure of civic participation during one’s first year in college is added to the model. This will occur only if participation during the first year of college accounts for the variance in civic participation during the fourth year of college that was originally accounted for by civic talk. The results in column 2 of Table 7.5 show that this is the

The Significant and Lasting Effect of Civic Talk |
123 |
case. Once participation during one’s first year in college is added to the analysis, the civic talk coefficient is no longer statistically significant. Thus, these results show that causing an initial increase in civic participation is the mechanism by which the effect of civic talk lasts into the future.5
Why Does the Effect Not Last?
If civic talk has a lasting effect on participation in voluntary civic organizations, then why does the effect not last for political participation and voter turnout? With regard to political participation, perhaps the best answer is that this form of civic activity was not very popular in this student population. During these students’ first year of college, 35 percent were not active in voluntary civic organizations, compared with 68 percent who were not active in political activities. During the students’ fourth year of college, the ratio improved a bit; 15 percent of students were not active in civic organizations, compared with 45 percent who were not active in political activities. Nonetheless, the survey participants still were not very active in political activities in their fourth year of college. In line with findings in Chapter 5 that civic talk has an effect only on individuals who are willing and able to become civically active, the lack of a lasting relationship between civic talk and political participation make sense. If a person is unwilling or unable to participate in a specific type of civic activity, no amount of conversation about politics and current events is going to prompt him or her to participate. In other words, because civic talk did not have an initial effect on political participation, the mechanism that allows the effect of civic talk to last over time was not present in the case of political participation.
It is worth noting, however, that while the long-term effect of civic talk on political participation did not reach a recognized level of statistical significance (p = .19), we can at least be 81 percent certain that there was a longer-term effect. This presents a puzzle. Why would civic talk not have an immediate effect on political participation but, perhaps, a marginal effect on such behavior three years later? This type of phenomenon is referred to as a “sleeper effect” (Campbell 2006; Jennings and Stoker 2004), a situation in which a stimulus does not have an immediate effect on behavior but does so later in a person’s life. Tables 7.2 and 7.3 show that the C-SNIP Panel Survey participants became significantly more active in and engaged with politics between their first and final years of college.
5A two-stage model leads to the same conclusion.

124 |
Chapter 7 |
Enhancements in the willingness and desire to participate in politics over time could be driving this sleeper effect. Again, it is necessary to underscore that this result is not statistically significant at an accepted level of confidence. Nonetheless, the data in Table 7.4 suggest a trend that civic talk can sometimes have a delayed effect on an individual’s patterns of political participation.
While a lack of interest in participating in political activities helps explain the lack of a statistically significant long-run relationship between civic talk and political participation, the same cannot be said of voter turnout. As documented in Table 7.2, a majority of the students in the study voted in both 2004 and 2006. While the turnout figures are likely a bit inflated (Faler 2005), it is still safe to say that voting was more popular among these students than was participating in other types of political activities. To explain this result, then, it is useful to ask how voting differs from other forms of civic participation. One key way is that it is far more sporadic. For example, citizens can be active in political activities and voluntary civic organizations at any point in time. One can only vote, however, when an election is held. As a consequence, talking about politics and current events shortly before the 2004 presidential primary encouraged this student population to vote in that election. Since the next election was the 2006 midterm election, however, there was no opportunity to parlay discussion about politics and current events immediately into more voter participation. In other words, the relative infrequency of elections makes initiation of a self-reinforcing pattern of increased voter turnout vis-à-vis civic talk harder to achieve.6
Conclusion
The purpose of this chapter has been to expand the analysis beyond the immediate effect that civic talk has on civic participation. In doing so, I examined three questions that were left unanswered in previous chapters. First, in reference to the extant literature’s focus on individual-level antecedents of civic participation, I showed that the effect of civic talk is typically as large as, if not larger than, that of one’s own characteristics. That is, neither social-level nor individual-level factors on their own sufficiently explains how active a person chooses to be in civil society. Both factors are important.
6Another explanation may be that discussions about politics and current events that occurred around the 2004 presidential primary were not germane to the 2006 midterm elections.
The Significant and Lasting Effect of Civic Talk |
125 |
Second, I examined the effect that civic talk has on other civically relevant phenomena. In switching the focus of this study to additional dependent variables, I found that, along with increasing civic participation, civic talk has a positive effect on how civically engaged and knowledgeable about politics and current events people are. In contrast, however, the analysis shows that civic talk does not have an effect on the strength or direction of one’s political preferences or views on the legitimacy of the government. Taken together, and in line with the focus group data presented in Chapter 3, these results suggest that civic talk is more about relaying information and less about changing minds.
Finally, I examined the potentially lasting effect of civic talk on civic participation. The data show that for certain types of civic activities, the effect of civic talk is lasting. Asking whether the civic talk effect lasts beyond three years is outside the scope of the C-SNIP Panel Survey. It is worth underscoring, however, that the data show that civic talk engaged in by first-year college students had a significant effect on how they behaved when they were fourth-year students (i.e., likely graduating seniors). In other words, as these young adults prepared to leave college and become full-fledged citizens, the civic talk in which they engaged three years earlier still shaped how they choose to participate in the processes of democratic governance. Given that the attitudes and patterns of behavior that we develop during our college years help determine the attitudes and patterns of behavior we carry with us for the rest of our lives, it is likely that the effect of civic talk experienced by the C-SNIP study population will last for many years into the future—and, arguably, over their lifespan.

8
Peers, Politics, and
the Future of Democracy
Man may not be a political animal, but he is certainly a social animal. Voters do respond to the cues of commentators and campaigners, but only when they can match those cues up with the buzz of their own social group. . . . Voters go into the booth carrying the imprint of the hopes and fears, the prejudices and assumptions of their family, their friends, and their neighbors. For most people, voting may be more meaningful and more understandable as a social act than as a political act.
—Louis Menand (2004, 96)
It is time to take the next step and ask some larger questions. When you are socialized by peers what, if anything, does it portend for the performance of a political system?
—Sara Silbiger (1977, 189)
n his assessment of what political scientists know about predicting elec- Itions, the famed cultural historian Louis Menand came to the conclusion that there is much about civic participation that we still do not understand. Of the myriad explanations that exist for why we vote and whom we choose to vote for, no single theory has a monopoly on the truth. However, one thing that is certain is that social context has a place on this list of explanations. We may not be Aristotelian political animals, but we are social animals; we experience politics and current events with and
through our peers.
In this book, I have used two new and innovative data sources to demonstrate empirically what we already know from experience: social context has a significant influence on participatory democracy. Specifically, I have shown that engaging in civic talk—discussing politics and current events with peers—leads people to become more civically active. But, as Sara Silbiger asked more than thirty years ago, what does it matter if civic
128 |
Chapter 8 |
talk has an impact on civil society? The purpose of this chapter is to conclude my argument by presenting answers to this question.
This chapter begins with an overview of the findings presented in this study. I then examine what the civic talk effect might portend for the future of participatory democracy. This discussion shows that civic talk plays a crucial role in maintaining the performance of democratic political systems. Thus, research on this subject needs to continue, and practitioners in civil society need to keep using civic talk and peer networks as resources to strengthen participatory democracy.
Summary of the Results
A great deal of scholarship already exists on civic participation, and the body of political science literature on social networks has been growing over the past twenty years. However, extant scholarship suffers from a critical problem: an inability to show causation. Existing works on civic talk show a strong correlation between how much a person talks with his or her peers about politics and how active that individual is in civic activities (see, e.g., Campbell and Wolbrecht 2006; Huckfeldt et al. 1995; Huckfeldt and Sprague 1991, 1995; Kenny 1992, 1994; Lake and Huckfeldt 1998; McClurg 2003, 2004; Mutz 2002). However, we cannot conclude with this evidence that civic talk is causing individuals to be more civically active. An equally plausible explanation for the relationship between talk and participation is that being civically active causes a person to talk about politics (reciprocal causation). Another problem is that individuals who are active in civic activities might consciously choose to associate with people who are interested in talking about politics (selection bias). Finally, we also need to consider the possibility some factor that has not been accounted for could be causing people to both talk about politics and participate in civic activities (endogeneity or omitted variable bias).
As discussed in Chapters 1 and 2, existing data sets and methods of analysis cannot account for these analytical biases. To address this problem, I collected panel survey data at three separate points in time from a cohort of students at the University of Wisconsin, Madison. As discussed in Chapters 1 and 2, the design of the study allowed me to account for analytical biases by examining change in behavior over time in a population of individuals who were randomly assigned to their peer groups (i.e., their dormitory roommates). In addition, the survey data were run through a matching pre-processing procedure to make the results more like those that would be generated by a controlled laboratory experiment.
Peers, Politics, and the Future of Democracy |
129 |
Four focus groups were also conducted with a separate cohort of students at the University of Wisconsin, Madison, to verify the findings from the C-SNIP Panel Survey.
Chapters 3 and 4 discussed what these two new data sets can tell us about the causal relationship between civic talk and civic participation. Chapter 3 showed that our peers do have influence over how we behave; C-SNIP Panel Survey subjects who engaged in civic talk were 38 percent more active in voluntary civic organizations and 7 percentage points more likely to have voted in the 2004 presidential primary. Chapter 4 showed that the relationship between civic talk and civic participation is a product of four factors. Conversations about politics and current events provide us with informational resources, increase our engagement with politics and current events, subject us to opportunities to be recruited into civic activities, and expose us to civic-minded attitudes and norms of behavior. Of these four factors, recruitment and civic engagement carry the most explanatory weight.
With the causal relationship between civic talk and civic participation quantified and explained, the middle portion of this book assessed how this form of social influence varies under different circumstances. The results presented in these chapters show that the effect of civic talk varies significantly depending on who you are and with whom you associate. With regard to one’s own characteristics, Chapter 5 showed that individuals who are predisposed to participate in civic activities get more of a participatory boost out of engaging in civic talk with their peers. With regard to the characteristics of the members of our social networks, Chapter 6 showed that peers with whom we are socially intimate, peers who have expertise on politics and current events, and peers who are similar to us (in general and specifically with regard to shared political preferences) have more sway over our patterns of civic participation vis-à-vis civic talk.
Chapter 7 answered three additional questions. First, the C-SNIP Panel Survey data show that the effect of civic talk is typically equal to or greater than the effect of individual-level antecedents of civic participation. Consequently, when we study civic participation we need to take more than just individual-level characteristics into consideration; we also need to pay attention to social-level determinants of individual behavior. Second, the C-SNIP Panel Survey data show that civic talk has a significant effect on other civically relevant attitudes and behavior, such as knowledge about and psychological engagement with politics and current events. Finally, to assess whether the effect of civic talk lasts beyond the point of initial exposure, I examined the third and final wave of the C-SNIP
130 |
Chapter 8 |
Panel Survey collected during the study population’s fourth year in college. These data show that the effect of civic talk lasts beyond the initial point of exposure—in this case, three years into the future. Further analysis showed that the boost in civic participation initially after engaging in civic talk is the mechanism by which the effect of civic talk lasts into the future.
Normative Considerations
The evidence presented in this book shows that civic talk has the capacity to significantly influence participatory democracy. However, the normative implications of civic talk have not yet been given due consideration. Civic talk may bring people into civil society, but does it always lead to positive outcomes for participatory democracy?
Deliberation as a Benchmark for Civic Discourse
To gain a better understanding of the normative implications of the civic talk effect, it is useful to examine the literature on deliberation (see, e.g., Barabas 2004; Conover et al. 2002; Delli Carpini et al. 2004; Mendelberg 2002; Page and Shapiro 1992). As discussed in Chapter 2, civic talk is not as purposive or formal as deliberation. However, deliberation scholars have carefully considered the implications of citizens’ discussing politics and current events with one another, making this research agenda a useful lens through which to examine the normative consequences of civic talk.
To use deliberation in this way, it is helpful to begin by reviewing what this form of discourse is. Two relatively recent reviews of the literature on this subject show that consensus is growing on what deliberation entails (Delli Carpini et al. 2004; Mendelberg 2002). Delli Carpini and his colleagues (2004, 319) conclude that deliberation is a form of “discursive” discourse. Discussions are discursive when participants have the opportunity “to develop and express their views, learn the positions of others, identify shared concerns and preferences and come to understand and reach judgments about matters of public concern.” Mendelberg (2002, 153) offers a similar assessment of the literature, concluding that “the promise of deliberation is its ability to foster the egalitarian, reciprocal, reasonable, and open-minded exchange of language.” Theoretically, the value of this form of dialogue is that, by participating in a deliberation, individuals gain a greater appreciation of the needs of others and are subsequently able to formulate public policies that favor the collective good of society over one’s self-interests.

Peers, Politics, and the Future of Democracy |
131 |
How Deliberative Is Civic Talk?
Although discussing politics and current events in informal peer networks is not the same as the formal process of deliberation, does civic talk approximate this benchmark of discursive discourse? To answer this question, it is useful to begin by reviewing how common these types of conversations are. While we are by no means constantly engaged in political discourse, civic talk is pervasive. As discussed in Chapter 2, data from the 2008–2009 American National Election Studies Panel Study show that about 91 percent of the American public engages in civic talk at least once a week. This said, civic talk is not purposively sought out by individuals. Instead, these types of discussions are an unintended byproduct of people going about their normal daily routine (Downs 1957; Klofstad et al. 2009; Walsh 2004). For example, a husband and wife might discuss issues covered in the news over dinner, or a group of friends at a party might end up talking about the current election.
So we engage in at least some amount of civic talk as we go about our daily lives. But what exactly goes on when people talk to one another about politics and current events? One might assume that the level of discourse occurring in peer networks is low in quality because most people are inattentive to, and have low levels of knowledge about, politics and current events. For example, data from the 2008 American National Election Studies Time Series Study show that a striking 55 percent of the American public reported being only “somewhat” or “not much” interested in the 2008 campaigns.1 Nonetheless, the evidence presented in this book shows that civic talk is still a useful way to engage the public with politics and current events. For example, the C-SNIP Focus Group Study data in Chapter 3 show that most of what goes on during civic talk discussions is the relaying of useful information about politics and current events. Moreover, a number of participant-observation studies show that individuals are more willing to discuss politics in a meaningful way when they are in supportive venues such as peer groups that are protected from the scrutiny and normative constraints of wider society (Eliasoph 1998; Harris-Lacewell 2004; Walsh 2004). In short, while the content of civic talk may not always meet our idealized expectations of deliberative discourse, these conversations are an easy way to keep a largely inattentive public engaged with the processes of democratic governance.
If deliberation is our benchmark for quality discourse, it is also necessary to assess how cooperative and egalitarian these informal discussions
1This figure is based on question A1a (variable number V083001a) in the pre-election questionnaire.
132 |
Chapter 8 |
are. Social networks certainly have the potential to meet these two ideals. First, numerous studies show that cooperation is more likely to occur when individuals repeatedly meet face to face, as they do in peer groups (Dawes et al. 1990; Delli Carpini et al. 2004; Mendelberg 2002; Putnam 2000; Sally 1995). For example, in a meta-analysis of more than one hundred experimental studies of the “Prisoners’ Dilemma,” a task that requires individuals to collude with one another to reach an optimal outcome, Sally (1995, 78) found that a “dilemma with discussion before each round would have 40% more cooperation than the same game with no discussion.” Second, since most people have a social circle with which they affiliate, this discussion forum is relatively egalitarian because all but the misanthropes among us have the opportunity to engage in civic talk.
Finally, in comparing civic talk with deliberation, it is necessary to ask whether informal conversations about politics and current events actually have policy implications the way deliberations (in theory) do. Admittedly, it is hard to envision that an informal conversation among peers, no matter how enlightened, egalitarian, and cooperative, will lead directly to the implementation of public policy. As this study has shown, however, civic talk can have a meaningful impact on policy outcomes by leading individuals to articulate their preferences to the government by voting. Moreover, I have shown that civic talk encourages individuals to engage in non-political forms of civic participation. Participation in such activities can also affect public policy. For example, volunteering at a soup kitchen has a direct effect on hunger and homelessness; donating supplies to a local school has a direct effect on education; and organizing an after-school program has a direct effect on juvenile delinquency.
Four Caveats
Civic talk lives up to the ideals of deliberative discourse in many ways. But is civic talk always inherently desirable from a normative standpoint, as has been assumed throughout this book? The answer is “not always.”
First, the central thesis of this book is that civic talk encourages civic participation. To put this phenomenon into a broader normative context, however, it is useful to examine who among us participates in civil society. Unfortunately, in the past half-century, traditionally disadvantaged members of society such as the poor and the undereducated have been withdrawing from public life at higher rates than the more advantaged among us. For example, the data in Figure 8.1 show that, while voter turnout in U.S. presidential elections has remained more or less stable among the
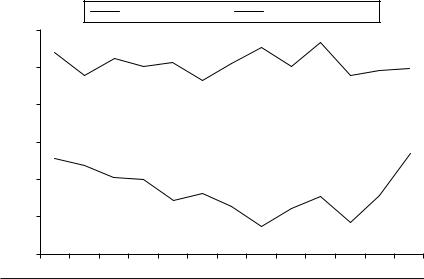
Peers, Politics, and the Future of Democracy |
133 |
0 to 16th percentile 96th to 100th percentile
|
100 |
|
|
|
|
|
|
|
|
|
|
|
|
|
90 |
|
|
|
|
|
|
|
|
|
|
|
|
Percentage |
80 |
|
|
|
|
|
|
|
|
|
|
|
|
70 |
|
|
|
|
|
|
|
|
|
|
|
|
|
Turnout |
60 |
|
|
|
|
|
|
|
|
|
|
|
|
|
|
|
|
|
|
|
|
|
|
|
|
|
|
|
50 |
|
|
|
|
|
|
|
|
|
|
|
|
|
40 |
|
|
|
|
|
|
|
|
|
|
|
|
|
1960 |
1964 |
1968 |
1972 |
1976 |
1980 |
1984 |
1988 |
1992 |
1996 |
2000 |
2004 |
2008 |
FIGURE 8.1 Voter turnout in presidential elections by income
Source: American National Election Studies Time Series Study
richest Americans, it has steadily declined among the poorest (albeit with a rebound in turnout over the past two elections). Declines in civic participation are a threat to popular sovereignty, regardless of the demographics of the individuals who are withdrawing from civil society. However, the class bias in this decline is especially dangerous to participatory democracy, because those with the most acute needs in American society have the weakest civic voice.
Can civic talk solve the problem illustrated in Figure 8.1? Probably not on its own. While civic talk encourages individuals to participate in civic activities, the strength of this relationship varies under different circumstances. Specifically, this study has shown that civic talk pulls the more advantaged among us into civil society; those individuals who are already predisposed to become civically active get the most benefit from engaging in civic talk. In other words, while civic talk has the capacity to pull more of us into civil society, the political interests and preferences of this larger pool of participants may not be representative of the public at large (and of the socioeconomically disadvantaged among us in particular).
Second, while peers groups have the capacity to be egalitarian and cooperative, group discussions can sometimes be dominated by individuals with higher levels of expertise on the issue at hand (Delli Carpini et al.

134 |
Chapter 8 |
2004; Mendelberg 2002). These types of “alpha” individuals tend to have stronger opinions about the issues being discussed and thus may be less willing to engage in compromise or listen to alternative points of view, thereby reducing the value of the discourse. Conversely, peer groups may be overly cooperative. This phenomenon is referred to as “groupthink”— when individuals are so concerned with maintaining the group’s cohesion that they rush to consensus and subsequently fail to assess critically the issues being discussed. As with too little cooperation, too much cooperation reduces the value of discourse because alterative points of view are not articulated or considered by the group. Moreover, groupthink may be a uniquely potent threat to the quality of civic talk discussions that occur in peer networks because the phenomenon is more common in small groups, in which unity and conflict avoidance are essential to maintaining social cohesion (Janis 1972).
Third, in critically assessing the normative consequences of civic talk, it is necessary to consider what these conversations do and do not affect. Again, when a deliberation is run effectively, participants view the outcomes of the discussion as legitimate because they were directly involved in the decision-making process. This sense of legitimacy increases one’s faith in the processes of democratic governance (Delli Carpini et al. 2004; Mendelberg 2002). In contrast to this ideal, the analyses presented in Chapter 7 show that civic talk has no effect on one’s trust in government or sense that the government is run for the benefit of all citizens. One reason this could be the case is that, unlike deliberations, civic talk discussions have no direct link to government institutions and policymaking. Thus, while informal discussions about politics and current events do not erode institutional legitimacy vis-à-vis one’s attitudes toward the government, it is questionable whether such discussions enhance it.
Finally, echoing the discussion of social intimacy in Chapter 6, civic talk discussions in peer groups may be beneficial to the democratic system because the deliberative process works more effectively when the participants share a social bond and have common viewpoints (Delli Carpini et al. 2004; Mendelberg 2002), as the members of most peer groups do. At the same time, however, when individuals are heavily integrated into a social circle, they are less likely to cooperate with or trust those outside the group (Bornstein 1992; Dawes et al. 1990; Delli Carpini et al. 2004; Mendelberg 2002; Putnam 2000; Walsh 2004).2 Thus, discussion of poli-
2For example, through a participant observation study of a small-town coffee klatch, Walsh (2004) shows that interpersonal interactions among peers strengthen a peer group’s identity

Peers, Politics, and the Future of Democracy |
135 |
tics and current events within one’s peer group might work well in addressing small-scale issues but not large-scale issues. For example, in a small-scale environment, such as a neighborhood, individuals are likely to be able to resolve issues by working with people whom they already know and trust and with whom they share preferences. Moreover, the need to engage with unfamiliar outsiders will be less likely due to the smaller scope of the issue at hand. In contrast, small-scale peer group discussions will not be as effective when large-scale issues, such as how to reform the country’s financial sector, are at stake. In such cases, small groups would need to collaborate with one another to devise policy solutions. Such collaboration may not be effective because of the likelihood of intergroup conflict between peer groups.3
Peers, Politics, and the Future of Democracy
Where do we go from here? The evidence presented in this book shows that civic talk has a significant and largely positive effect on the function of participatory democracy. Thus, it is incumbent on academics and practitioners in civil society to incorporate this fact into their agendas.
Changing the Civic Participation Research Agenda
Although the C-SNIP data allowed me to make unprecedented causal inferences about civic talk, and although college students are a crucial case of peer influence (see Chapter 2), the results presented in this book should be tested under other circumstances. Large-scale social surveys are one way we can continue to collect data on the effects of social networks. Without innovations in the way this type of data is collected and analyzed, however, observational studies will continue to be plagued by analytical biases (or, at least, panned as such by critics of this line of research). One such innovation used in this study was the matching data pre-processing procedure (see, e.g., Ho et al. 2007a, 2007b, 2007c). Matching is a powerful
at the cost of generating hostility toward outsiders. In an experimental study, Bornstein (1992, 604) also shows that “efforts to mobilize collective action within the groups are liable to interfere with the resolution of the conflict between them.”
3This said, debate and dissent is necessary for a democratic system to function. Indeed, under the right circumstances, disagreement among citizens can lead to learning and the creation of informed consensus (Barabas 2004; Huckfeldt et al. 2004). The point is that policy solutions are more easily reached when there is some level of agreement and understanding among the decision makers.
136 |
Chapter 8 |
tool for examining complex causal phenomena such as civic talk because it allows researchers to make results generated with observational data more approximate to those generated by a controlled experiment. Moreover, collecting variables before, during, and after individuals are exposed to civic talk, as done in the C-SNIP Panel Survey, allows researchers to maximize the benefits of matching. Specifically, variables that were collected before individuals are exposed to civic talk can be used to match people together who were similar before they did or did not engage in civic talk, and the effect of engaging in civic talk can be measured with variables collected after such conversations have occurred.
The results I have presented in this book also illustrate the utility of using alternative methods of data collection that allow complex causal dynamics to be studied with greater precision. Scholars interested in social networks should make further use of quasi and natural experiments to study peer effects. Ideally, this research agenda should also be pushed to include fully controlled experiments. This ideal type of research design is difficult, although maybe not impossible, to implement. For example, it is hard to envision how a researcher could construct new social networks, force a randomly selected set of those groups to engage in civic talk, and prevent the rest of the groups from engaging in such discussions. Nonetheless, such a study would be a powerful test of the civic talk effect.
In addition to experiments, we should make use of other research designs that are tailored to studying complex causal phenomena. Participant observation and focus group studies are especially powerful in this regard (Eliasoph 1998; Harris-Lacewell 2004; Walsh 2004). Like experiments, these methods come at the cost of reduced ability to draw generalizable conclusions but have the benefit of being able to provide a rich understanding of how citizens interact and influence one another. Recent research also shows that formal models (Siegel 2009) and agent-based models (Johnson and Huckfeldt 2004) can provide valuable predictions about how and why social influence occurs. At their best, these types of studies also use data to test these theoretical predictions empirically.
In addition to thinking about the methods we use to collect and analyze data on civic talk, we need to consider the types of information that we collect. Specifically, future research should give additional consideration to both the content of civic talk discussions and the complex mechanisms that govern the relationship between civic talk and civic participation. For example, we know that one’s social network is an important source of information on politics and current events and that information motivates participation because it increases civic competence and civic engagement.
Peers, Politics, and the Future of Democracy |
137 |
The analysis presented in this book, however, did not account for whether the quantity or quality of information being exchanged during civic talk discussions affects how active one chooses to be in civic activities. For example, is one conversation sufficient to encourage participation, or is more sustained interaction necessary? Does the answer to this question change if we are talking about the long-term effects of civic talk?
In a similar vein, future studies should address the potentially dynamic relationship between civic talk and civic participation. In Chapter 7, I showed that the initial positive effect of civic talk on civic participation is the mechanism that governs the lasting relationship between these two variables—that is, talk today begets participation today, which begets participation in the future. However, it could also be the case that civic talk encourages more civic talk, which in turn encourages civic participation in the future. Data on subsequent civic talk interactions, as well as a more complex modeling approach, would be necessary to test this proposition.
Finally, it is important to reiterate that this book has focused on relationships between college roommates (i.e., “dyads”). While this research design has yielded unprecedented results, most individuals are embedded in larger and more complex social networks. Consequently, future research should add more discussion partners to the research design. Ideally, this would entail mapping out the complete (i.e., “full”) social network of a specific set of individuals who live or congregate in the same place, such as a neighborhood, a church, or a school. This method of collecting data is laborious and expensive because it entails tracing all of the social connections between all of the people in a given social environment. However, sociologists have been using the full network research design with great success for years (see, e.g., Burt 1992) and have developed a number of methods to collect and assess such data (Scott 1991; Wasserman and Faust 1994). Political scientists should learn from their experience and apply this knowledge to the study of politically relevant social networks. Given that this study of roommates has shown that even one person in the social environment can have a significant effect on one’s civically relevant attitudes and behaviors, it will be intriguing to see how larger and more complex discussion networks affect their members.
An Agenda for Practitioners
Over the past half-century, a staggering number of Americans have withdrawn from nearly every form of civic participation, from community voluntarism to voting in presidential elections (Putnam 2000; but see also
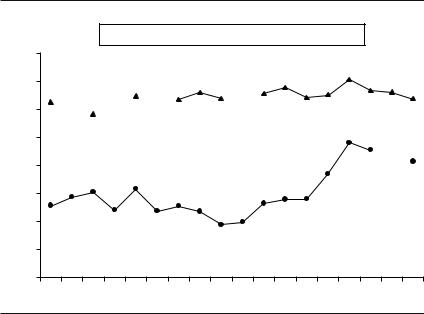
138 Chapter 8
 Party contact
  Socializing with friends
|
80 |
|
|
|
|
|
|
|
|
|
|
|
|
|
|
|
|
|
|
70 |
|
|
|
|
|
|
|
|
|
|
|
|
|
|
|
|
|
|
60 |
|
|
|
|
|
|
|
|
|
|
|
|
|
|
|
|
|
Percentage |
50 |
|
|
|
|
|
|
|
|
|
|
|
|
|
|
|
|
|
40 |
|
|
|
|
|
|
|
|
|
|
|
|
|
|
|
|
|
|
30 |
|
|
|
|
|
|
|
|
|
|
|
|
|
|
|
|
|
|
|
|
|
|
|
|
|
|
|
|
|
|
|
|
|
|
|
|
|
|
20 |
|
|
|
|
|
|
|
|
|
|
|
|
|
|
|
|
|
|
10 |
|
|
|
|
|
|
|
|
|
|
|
|
|
|
|
|
|
|
0 |
|
|
|
|
|
|
|
|
|
|
|
|
|
|
|
|
|
|
1974 |
1976 |
1978 |
1980 |
1982 |
1984 |
1986 |
1988 |
1990 |
1992 |
1994 |
1996 |
1998 |
2000 |
2002 |
2004 |
2006 |
2008 |
FIGURE 8.2 Contact with political parties versus contact with peers
Sources: American National Election Studies (ANES) Time Series Study; General Social Survey (GSS)
Notes: The ANES question asked, “Did anyone from one of the political parties call you up or come around and talk to you about the campaign?” The GSS question asked how often the respondent spent “a social evening with friends who live outside the neighborhood.” Respondents were coded as having socialized with friends if they responded “about once a month” or more frequently.
McDonald and Popkin 2001). This has left nongovernmental organizations, political campaigns, and others who work in civil society worried about the state of participatory democracy and wondering how to go about strengthening it. In response, the results presented in this book show that civic talk can be used as a resource to re-engage the public with civil society.
This said, a fair question to ask is, “Why civic talk?” What is it about this potential lever for strengthening participatory democracy that is unique? To answer this question, recall the results presented in Chapter 7 comparing the effect of engaging in civic talk with other antecedents of civic participation. Overall, civic talk is as effective as, if not more effective than, these other antecedents. But why is this? The data in Figure 8.2 offer a suggestion. These results show that Americans socialize with their peers more often than they interact with representatives of political parties. This result is almost too banal to present; of course we socialize with our friends
Peers, Politics, and the Future of Democracy |
139 |
more frequently than we interact with representatives of political parties! Nonetheless, the data illustrate why peer-based mobilization can be so effective in soliciting civic participation. In contrast with more remote antecedents of civic participation such as agents of political parties, we are in more frequent contact with our social network of peers. This makes peer-based mobilization efforts “cheaper” and often more effective (Klofstad et al. 2009). In other words, civic talk is special because it is not special. The fact that these interactions occur naturally as we go about our normal routines it what makes them powerful.
Political actors are beginning to realize this. Before 2000, political parties and candidates focused most of their resources on the “air war,” using the mass media and direct mail to present their messages to voters. In the past two or three election cycles, however, candidates have realized that they need to put more resources into the “ground war,” or face-to-face mobilization of voters through canvassing. Moreover, candidates have also begun to use social networks as a way to get out the vote. The contrasting campaign tactics of the George W. Bush and John Kerry during the 2004 election illustrate this. Both candidates made heavy use of face-to-face canvassing but took very different approaches to this method of campaigning (Bai 2004). Kerry’s campaign largely used professional canvassing organizations that brought in outsiders (frequently progressive college students and other paid employees) to mobilize voters. In contrast, Bush’s camp recruited local volunteers to canvass in their own communities. Bush’s method—using volunteers people already knew from their communities rather than strangers who were paid for their service—was vastly more effective and helped propel him to a second term as president. Needless to say, his victory in 2004 continues to have widespread effects across the globe.
Although peer-based civic mobilization has been, and can continue to be, used as a powerful resource for practitioners in civil society, it is important to underscore that civic talk is not a panacea. Perhaps the most critical point to remember is that civic talk does not work on everyone. As this study shows, civic talk is the most effective for those who are already predisposed to participate in civic activities. Consequently, practitioners need to make use of civic talk as just one part of a multifaceted strategy to increase the public’s engagement with civil society, especially when they are attempting to mobilize those of us who are less engaged with politics and current events.
Since individuals are more responsive to civic talk when they have the means and wherewithal to participate in civil society, practitioners need
140 |
Chapter 8 |
to engage in activities that help the public develop these skills and motivations to more effectively harness the power of civic talk. Specifically, because civic participation is habitual, a logical suggestion for practitioners is to encourage young people to become civically engaged and active as early in life as possible. Models of such efforts already exist. For example, as discussed in Chapter 3 and Chapter 7, the young people in the C-SNIP Panel Survey were much more civically active in high school than in college. A likely explanation for this participation gap is that these students participated in service learning programs during high school that were no longer available to them during college. This suggests that we need to do a better job of offering opportunities for young people to become civically active after they leave high school.
Data from the C-SNIP studies suggest that such efforts would be welcome on college campuses. As one student commented at the end of the third wave of the C-SNIP Panel Survey: “I think it would benefit the majority of the student population if there were a required course regarding politics and government at some point during undergraduate study.” The focus group sessions made it clear, however, that designing such outreach programs is not a straightforward task. Most of the participants commented that they would like pre-packaged opportunities to participate in civic activities like the ones they had experienced in high school. The students also made the point, however, that they do not want to be over-burdened with requests to participate. As one student said: “I don’t want it to be shoved down my throat. I’d rather say, ‘Oh, look, here’s a list of groups that I think [are] interesting and that I’ll choose to go [to].’” Such statements were typical in each of the focus group sessions, suggesting that college faculty and administrators have to walk a tightrope when attempting to create institutions that promote civic participation. The task they face is how to provide opportunities for students to become civically active without being too forceful.
In thinking about how to increase the civic competence of young people, it is also important for practitioners to consider that this segment of the population is far more interested and active in non-political civic activities, such as community voluntarism and student organizations, than they are in political activities. For example, when asked, “In general, which do you think is the better way to solve important issues facing the country, through political involvement (e.g., voting, working for political candidates, and the like) or through community involvement (e.g., volunteering in the community, and the like)?” C-SNIP respondents vastly preferred community involvement to political involvement during their first year of

Peers, Politics, and the Future of Democracy |
141 |
college (72 percent). Consequently, practitioners need to do a better job of encouraging young people to become engaged with politics. Such efforts can be made in college, when young people become eligible to vote. Additional efforts need to be made earlier in the educational career of the student, as well, to instill a sense of political engagement as soon as possible in the lifecycle.4
Conclusion
This book began with the story of Rex Boyd and the 2008 Democratic Party caucuses in Iowa (Zeleny 2008). Before he went to his local caucus, Rex had intended to support Senator Hillary Clinton. After discussing the merits of each of the candidates with his friends and neighbors, however, he shifted his support to Senator Barack Obama. While neither this one vote nor this one caucus gave Obama the presidency, they were critical to the eventual outcome of the 2008 election. The win in Iowa gave Obama the political momentum he needed to win in future primaries, and the Obama campaign used this momentum to build a grassroots organization that reached out to the entire country—“red” and “blue” states alike. In line with the results presented in this book, this massive organization made extensive use of social networks to spread the message, using tactics as old as face-to-face canvassing and as new as e-mail, text messaging, and social networking websites.
Rex Boyd and Barack Obama’s 2008 presidential campaign are just two examples of how the power of civic talk can be channeled to significantly affect the function of participatory democracy. Countless others certainly exist. The purpose of this book has been to demonstrate this point empirically and to encourage scholars and practitioners to more actively pursue the influence of social networks in their work.
4Kids Voting USA is an example of such a program. Another idea would be to allow students to fulfill service learning requirements by participating in political activities.

APPENDIX A
The Collegiate Social Network
Interaction Project (C-SNIP)
C-SNIP Panel Survey
The population surveyed was all 4,358 first year students at the University of Wisconsin, Madison, living in university housing during the 2003–2004 academic year (82 percent of the 5,322 students who entered the university in 2003). Study participants initially completed two questionnaires over the Internet during the 2003–2004 academic year: one at the beginning of the year (October–November 2003), and a second at the end of the year (March–April 2004). A third questionnaire was administered between April and May 2007. Lack of access to the Internet can bias survey response rates (Best et al. 2001; Couper 2000; Zhang 2000). However, this was not an issue in this study because subjects had free access to the Internet.
During each wave of the study, three attempts were made by e-mail to recruit the sample to fill out a questionnaire. E-mail addresses were obtained from the University of Wisconsin, Madison, Office of the Registrar and from publicly accessible student directories. Unique login names and passwords were assigned to each respondent in these e-mails to prevent subjects from completing more than one questionnaire. To increase participation from a broad cross-section of the population under study, each student who completed a questionnaire was entered into a prize
144 |
Appendix A |
drawing for one of fifty twenty-dollar prizes. (This procedure was used in all three waves of the study.) The recruitment e-mails were also worded to make the prospect of participating in the study appealing to a wide audience.
In total, 23 percent of the study population completed the first two questionnaires (N = 999). Just under 24 percent of the population completed at least some portion of the first two questionnaires (N = 1,044). Of the 1,044 students who at least partially completed both of the first two questionnaires, 53 percent fully completed the 2007 follow-up questionnaire (N = 557), and 57 percent at least partially completed the 2007 questionnaire (N = 598). These response rates exclude subjects who were excluded from the analysis to reduce analytical bias: subjects who moved from the dormitory room to which they were initially assigned (N = 95), subjects who chose their roommates (N = 464), and subjects who had no roommates (N = 11). To account for missing data, the data were preprocessed using the Amelia II multiple imputation package for R (Honaker et al. 2007; see also King et al. 2001). The data set was imputed five times. To aid in the imputation process, the tolerance level was set to
.001, and a ridge prior of 5 percent of the cases in the data set was used. All dichotomous variables were imputed using the nominal transformation; no other transformations were used. Descriptive statistics are listed in Appendix B.
While imputation compensates for missing data, it is still important to address the issue of response rate. Although the recruitment procedures for the C-SNIP study were designed to attract a broad cross-section of participants from the population, it still could be the case that certain types of individuals—say, those who are more interested in the subject of the study—chose to participate at higher rates. For example, after participating in the first survey, each respondent knew that the subsequent two waves of the study would address politics and current events. This might have prompted individuals who were more engaged with and active in these matters to complete the study. If this was the case, the civic talk effects presented in this book could be inflated—that is, those who are participating in the study are more civically active and more likely to engage in civic talk than their non-respondent counterparts.
Table A.1 offers an empirical test of this proposition by examining the characteristics of respondents and non-respondents in each of the three waves of the C-SNIP Panel Survey. The top portion of the table examines basic demographics of respondents and non-respondents. Fortunately, these three measures were available for the entire population surveyed;

TABLE A.1 Characteristics of respondents and non-respondents (means)
|
Wave 1 (high school) |
Wave 2 (1st year of college) |
Wave 3 (4th year of college) |
||||||
|
Respondents |
|
Non-respondents |
Respondents |
|
Non-respondents |
Respondents |
|
Non-respondents |
|
|
|
|
|
|
|
|
|
|
ACT score |
27.76 |
> |
27.18 |
27.91 |
> |
27.29 |
28.12 |
> |
27.21 |
Gender (female) |
.60 |
> |
.44 |
.62 |
> |
.49 |
.60 |
> |
.50 |
Race (non-white) |
.10 |
< |
.13 |
.09 |
< |
.12 |
.07 |
< |
.13 |
Wave 1 civic participation |
|
|
|
|
|
|
|
|
|
Voluntary civic organizations |
|
|
|
6.48 |
= |
6.41 |
6.47 |
= |
6.43 |
Political participation |
|
|
|
1.15 |
= |
1.17 |
1.10 |
< |
1.20 |
Wave 2 civic participation |
|
|
|
|
|
|
|
|
|
Voluntary civic organizations |
|
|
|
|
|
|
2.39 |
= |
2.21 |
Political participation |
|
|
|
|
|
|
.55 |
= |
.53 |
Voter turnout (2004 primary) |
|
|
|
|
|
|
.52 |
< |
.44 |
Source: C-SNIP Panel Survey.
Note: The figures for ACT score, gender, and race are for all first-year students, regardless of whether they lived in university dormitories, as indicated in enrollment files supplied the Department of the Registrar, University of Wisconsin, Madison. Voter turnout was not measured in the wave 1 questionnaire.
> or < indicates a significant difference between means at p ≤ .10; = indicates an insignificant difference between means at p > .10 (two-tailed t-tests).
146 |
Appendix A |
thus, we can use them to assess non-response bias in all three waves of the study. These data show that when compared with non-respondents, respondents scored higher on their American College Testing (ACT) entrance exam, were more likely to be female, and were less likely to belong to a racial or ethnic minority group. Although these differences are statistically significant, in the case of ACT score and race, the substantive difference between respondents and non-respondents is small. Moreover, all three of these demographic characteristics were included in the matching data pre-processing procedure (see Appendix C). Thus, any differences between respondents and non-respondents on these variables are automatically accounted for in the analysis—that is, additional weighting of the data to correct for non-response bias is not required.
The middle portion of Table A.1 uses survey responses provided in the first wave of the C-SNIP study to gauge differences between respondents and non-respondents in the second and third waves of the study. Respondents to wave 3 were more politically active during high school than were non-respondents. While this difference is statistically significant, it is substantively small (only .10 on a six-point activity scale). Moreover, each of the civic participation variables collected during the first wave of the C-SNIP study were included in the matching data preprocessing procedure, and as such any differences between respondents and non-respondents on these variables are accounted for in the analysis (again, see Appendix C).
The bottom portion of Table A.1 examines differences in responses given during the second wave of the C-SNIP study between respondents and non-respondents in the third wave of the study. In this set of results we can now examine voter turnout (since most members of this student population could not vote while they were in high school, the first wave of the C-SNIP study did not collect information about voter participation). With the exception of voter turnout, there are no significant differences between respondents and non-respondents in the final wave of the study. Admittedly, the gap in voter turnout between respondents and non-respondents in 2004 is somewhat high, at 8 percentage points. However, this gap is not worrisome for two reasons. First, as addressed in Appendix C, given that the matching data pre-processing procedure accounted for how civically active subjects were in high school (participation in voluntary organizations and political participation), we can be reasonably confident that the analysis accounts for each subject’s baseline predilection to vote. Second, if this gap in voter turnout between respondents and non-respondents is biasing the results of wave 3, we
The Collegiate Social Network Interaction Project (C-SNIP) |
147 |
would expect a strong relationship between civic talk during one’s first year of college and voter turnout during one’s fourth year of college. However, as documented in Chapter 7, this is not the case.
C-SNIP Focus Group Study
During the second week of April 2008, a series of four focus groups were conducted with 2007–2008 first-year students at the University of Wisconsin, Madison. Each group was composed of eight students. These students, like the 2003–2004 cohort that participated in the C-SNIP Panel Survey, were randomly assigned to their first-year dormitories.
Students were recruited to participate in dormitory cafeterias and lobbies. Potential participants were asked to complete a questionnaire that asked about their patterns of civic participation before coming to college, the amount of civic talk they engaged in with their randomly assigned roommates, times and dates of availability, and contact information. Based on their responses to the recruitment questionnaire, students were assigned to one of the four groups based on two factors: how civically active they had been in high school (“high” or “low”), and how much civic talk with their randomly assigned roommates they were exposed to (“high” or “low”). Selected participants were contacted by phone and mail to remind them of the date and time of their session. When they arrived at the focus group session, the participants completed standard consent forms and were invited to help themselves to refreshments. Each session lasted approximately ninety minutes and was conducted by a trained focus group moderator. The content of the sessions was audiotaped and later transcribed for analysis. At the completion of the focus group, each student was presented with a forty-dollar incentive.
The moderator guided each focus group through the following set of discussion questions:
1.When you hear the words “politics and current events,” what different kinds of things come to mind?
2.Let’s think about the experiences you have had this year living with your roommate at college. We know that roommates talk about a lot of different kinds of things. What are the all of the different sorts of topics do you usually discuss with your roommate? We want to hear about all of the different things you discuss (including, but not only, those related to politics and current events).
148 |
Appendix A |
3.How often do you discuss politics and current events with your roommate?
Follow-Up Question:
•If you don’t typically discuss politics and current events with your roommate, what would you say are the main reasons that you don’t discuss these kinds of issues?
4.Who initiates these conversations between you and your roommate?
5.When you talk about politics and current events with your roommate, what do you talk about? What kinds of topics do you discuss?
Follow-Up Questions:
•Have you been talking about the 2008 elections?
•Do you talk about local, state, national, or world politics?
•Do you talk about what you might have read or heard about in the news?
•Do you share information about how to get involved in a student group or political activities?
•Does your roommate ever explicitly ask you to get involved in civic activities?
6.How much do you typically find that you share the same opinions with your roommates when you discuss politics and current events?
Follow-Up Questions:
•When you have these kinds of conversations with your roommate, how often does one of you try to persuade the other person about political or current events topics?
•Have you ever had what you would consider to be a heated discussion or an argument with your roommate about politics and current events?
7.Think about all of the different topics you discuss with your roommate (and you can reference the list we made together earlier). How frequently would you say that you discuss politics and current events with your roommate compared with the other topics you discuss?
8.There are lots of different kinds of civic activities that students sometimes choose to get involved in on campus. These
The Collegiate Social Network Interaction Project (C-SNIP) |
149 |
include things like participating in student groups, volunteering, working on political campaigns, protesting, and voting. What experiences have you had participating in these types of activities this year at the university?
9.What are some of the reasons that you chose to get involved in these civic activities?
Follow-Up Questions:
•What were some of the factors that caused you to not get involved in civic activities?
•Overall, how much would you say that you take part in these kinds of civic activities compared with last year (your senior year of high school)?
•What are some of the reasons that your involvement in these activities changed from last year to this year?
10.Overall, what effect do you feel discussing politics with your roommate has had on your decision to become active in these types of activities?
Follow-Up Questions:
•What effect did sharing information about politics and current events have on your decision?
•What effect did their asking you to get involved have on your decision?
•What effect would you say that these conversations have had on your interest in politics and current events?
•Do you feel like your roommate might be disappointed in you if you don’t participate in civic activities?
11.Finally, what was this experience like for you tonight? Was this an easy or a difficult topic to discuss?

APPENDIX B
C-SNIP Panel Survey
Questions and Variables
Civic Participation
Participation in Voluntary Civic Organizations (Table B.1)
“How active were you in the following types of organizations [during high school/during your first year here at the University of Wisconsin/at the University of Wisconsin this year]: very active, somewhat active, not very active, or not at all active?”
•“Student government (for example, [student council/ASM], etc.)”1
•“Partisan political groups (e.g., [Young/College] Republicans or Democrats, etc.)”
•“Organizations that take stands on political issues or current events (e.g., a group interested in protecting the environment, etc.)”
•“Charitable or voluntary service organizations (i.e., working in some way to help others without pay and not for course credit)”
•“Leadership training or civic organizations (e.g., community service organizations, etc.)”
•“Student publications (e.g., yearbook, newspaper, etc.)”
•“Forensics, debate, or other speech clubs or teams”
1The Associated Students of Madison (ASM) is the student government body at the University of Wisconsin, Madison.

152 |
Appendix B |
TABLE B.1 Participation in voluntary civic organizations (descriptive statistics)
|
Minimum |
Maximum |
Mean |
SD |
High school |
|
|
|
|
Full participation scale |
−.76 |
19.00 |
6.60 |
3.96 |
Student government |
.00 |
3.00 |
1.14 |
1.19 |
Partisan |
−.46 |
3.00 |
.27 |
.63 |
“Take stands” |
−1.05 |
3.00 |
.65 |
.92 |
Charitable/service |
.00 |
3.51 |
1.97 |
1.02 |
Leadership/civic |
−1.70 |
3.13 |
.89 |
1.15 |
Student publications |
−.63 |
3.29 |
.91 |
1.12 |
Forensics, etc. |
−.91 |
3.00 |
.76 |
1.07 |
1st year of college |
|
|
|
|
Full participation scale |
−6.54 |
21.00 |
2.43 |
2.91 |
Student government |
−.93 |
3.00 |
.24 |
.57 |
Partisan |
−1.48 |
3.00 |
.27 |
.66 |
“Take stands” |
−1.99 |
3.16 |
.41 |
.80 |
Charitable/service |
−1.44 |
3.24 |
.89 |
1.04 |
Leadership/civic |
−1.77 |
3.17 |
.42 |
.84 |
Student publications |
−.80 |
3.00 |
.11 |
.43 |
Forensics, etc. |
−1.16 |
3.28 |
.08 |
.36 |
4th year of college |
|
|
|
|
Full participation scale |
−4.98 |
14.00 |
3.20 |
2.65 |
Student government |
−1.48 |
3.00 |
.25 |
.60 |
Partisan |
−1.40 |
3.00 |
.32 |
.62 |
“Take stands” |
−2.11 |
3.54 |
.65 |
.94 |
Charitable/service |
−1.87 |
4.57 |
1.33 |
1.13 |
Leadership/civic |
−2.34 |
3.20 |
.42 |
.93 |
Student publications |
−1.56 |
3.00 |
.18 |
.58 |
Forensics, etc. |
−.87 |
3.00 |
.05 |
.34 |
Source: C-SNIP Panel Survey.
Note: The values in this table are means calculated from five imputed data sets. The minimums of some variables are negative because the range for ordinal variables (i.e., a “range prior”) was not specified in the imputation algorithm. SD, standard deviation. N = 1,044.
Participation in Political Activities (Table B.2)
“How many times did you contact an elected official about a problem or issue that you were concerned about [during high school/during your first year here at the University of Wisconsin/at the University of Wisconsin this year]: never, once, or more than once?”
“How many times did you participate in a protest, march, or demonstration [during high school/during your first year here at the University of Wisconsin/at the University of Wisconsin this year]: never, once, or more than once?”

C-SNIP Panel Survey Questions and Variables |
153 |
TABLE B.2 Participation in political activities (descriptive statistics)
|
Minimum |
Maximum |
Mean |
SD |
High school |
|
|
|
|
Full participation scale |
−.49 |
6.00 |
1.16 |
1.41 |
Contacting |
−.14 |
2.00 |
.51 |
.72 |
Protesting |
−.56 |
2.00 |
.40 |
.70 |
Campaign work |
−.10 |
2.00 |
.25 |
.58 |
1st year of college |
|
|
|
|
Full participation scale |
−2.06 |
6.00 |
.56 |
1.13 |
Contacting |
−1.17 |
2.02 |
.24 |
.57 |
Protesting |
.97 |
2.00 |
.20 |
.50 |
Campaign work |
−.82 |
2.01 |
.12 |
.40 |
4th year of college |
|
|
|
|
Full participation scale |
−2.69 |
6.00 |
.81 |
1.28 |
Contacting |
−1.73 |
2.91 |
.43 |
.73 |
Protesting |
−1.52 |
2.09 |
.25 |
.56 |
Campaign work |
−1.13 |
2.00 |
.13 |
.45 |
Source: C-SNIP Panel Survey.
Note: The values in this table are means calculated from five imputed data sets. The minimums of some variables are negative because the range for ordinal variables (i.e., a “range prior”) was not specified in the imputation algorithm. SD, standard deviation. N = 1,044.
“How many times did you work as a volunteer for a candidate running in a national, state, local, or school election [during high school/during your first year here at the University of Wisconsin/at the University of Wisconsin this year]: never, once or more than once?”
Voter Turnout (Table B.3)
“Did you vote in the Wisconsin Democratic Presidential Primary that was held on Tuesday, February 17, 2004: yes or no?”
“Did you vote in the 2006 midterm congressional election?”
TABLE B.3 Voter turnout (descriptive statistics)
|
Minimum |
Maximum |
Mean |
SD |
1st year of college (2004 primary) |
0 |
1 |
.51 |
.50 |
4th year of college (2006 midterm |
|
|
|
|
election) |
0 |
1 |
.64 |
.48 |
Source: C-SNIP Panel Survey.
Note: The values in this table are means calculated from five imputed data sets. SD, standard deviation. N = 1,044.

154 |
Appendix B |
TABLE B.4 Civic talk among roommates (descriptive statistics)
|
Minimum |
Maximum |
Mean |
SD |
Full scale |
−.55 |
4.26 |
1.40 |
.89 |
Dichotomous treatment coding |
.00 |
1.00 |
.47 |
.50 |
Source: C-SNIP Panel Survey.
Note: The values in this table are means calculated from five imputed data sets. The minimums of some variables are negative because the range for ordinal variables (i.e., a “range prior”) was not specified in the imputation algorithm. SD, standard deviation. N = 1,044.
Civic Talk (Table B.4)
“When you talk with your roommate, how often do you discuss politics and current events: often, sometimes, rarely, or never?”
Causal Mechanisms (Table B.5)
Resources
“How many times have your roommates given you any information about how to become active in politics and current events: often, sometimes, rarely, or never?”
Engagement
“Thinking about how interested you were in politics and current events before you came to the University of Wisconsin, Madison, has talking with your roommates increased your interest in politics and current events: very much, somewhat, not that much, or not at all?”
TABLE B.5 Causal mechanisms (descriptive statistics)
|
Minimum |
Maximum |
Mean |
SD |
Resources |
−1.38 |
3.00 |
.44 |
.72 |
Engagement |
|
|
|
|
Interest in politics and current events |
−1.75 |
3.14 |
.68 |
.85 |
Political efficacy |
.65 |
6.47 |
3.38 |
1.10 |
Recruitment |
−1.27 |
3.00 |
.25 |
.56 |
Norms |
|
|
|
|
Perceived activity level of roommate |
−.73 |
4.27 |
1.36 |
.85 |
Perceived importance of civic participation |
.00 |
3.87 |
2.32 |
.63 |
Source: C-SNIP Panel Survey.
Note: The values in this table are means calculated from five imputed data sets. The minimums of some variables are negative because the range for ordinal variables (i.e., a “range prior”) was not specified in the imputation algorithm. SD, standard deviation. N = 1,044.
C-SNIP Panel Survey Questions and Variables |
155 |
“How much would you agree or disagree with this statement: ‘People like me don’t have any say about what the government does’: strongly agree, somewhat agree, neither agree nor disagree, somewhat disagree, or strongly disagree?”
Recruitment
“How many times have your roommates asked you to participate in an event or organization related to politics and current events: often, sometimes, rarely, or never?”
Norms
“How active and interested do you think your roommates are in politics and current events: very, somewhat, not very, or not at all?”
“How important do you think it is for people like you to be active and interested in politics and current events: very important, somewhat important, not very important, or not at all important?”
Individual-Level Characteristics
Used in Chapter 5 (Table B.6)
Parental Civic Interest and Activity
“How active and interested would you say your [mother/father] is in politics and community affairs: very active and interested, somewhat active and interested, not very active and interested, or not at all active and interested?”
Interest in Politics and Current Events
“How interested were you in politics and current events during high school: very interested, somewhat interested, not very interested, or not at all interested?”
Political Efficacy
“How much would you agree or disagree with this statement, ‘People like me don’t have any say about what the government does:’ strongly agree, somewhat agree, neither agree nor disagree, somewhat disagree, or strongly disagree?”
156 Appendix B
TABLE B.6 Individual-level pre-treatment (high school) intervening variables (descriptive statistics)
|
Minimum |
Maximum |
Mean |
SD |
Parents’ civic interest/activity |
|
|
|
|
Full scale (mother + father) |
2.00 |
8.65 |
5.42 |
1.38 |
Mother |
.94 |
4.42 |
2.60 |
.79 |
Father |
.86 |
4.57 |
2.82 |
.83 |
Interest in politics and current events |
1.00 |
4.00 |
2.69 |
.91 |
Political efficacy |
1.00 |
5.00 |
3.28 |
1.12 |
Ideology |
|
|
|
|
Strength |
1.00 |
3.00 |
1.90 |
.75 |
Directional scale (conservative–liberal) |
1.00 |
5.08 |
3.36 |
1.11 |
Knowledge about politics and current events |
.99 |
3.00 |
2.08 |
.70 |
ACT score |
17.00 |
36.33 |
28.14 |
2.88 |
Parents’ education |
|
|
|
|
Full scale (mother + father) |
2.00 |
12.32 |
7.56 |
1.87 |
Mother |
1.00 |
6.16 |
3.72 |
1.04 |
Father |
.98 |
6.21 |
3.84 |
1.10 |
Source: C-SNIP Panel Survey.
Note: The values in this table are means calculated from five imputed data sets. SD, standard deviation. N = 1,044.
Ideology
“We also hear a lot about conservatives and liberals in politics these days. What were you during high school: very conservative, somewhat conservative, moderate, somewhat liberal, or very liberal?”
Knowledge about Politics and Current Events
“Generally speaking, how much would you say you knew about politics and current events during high school: a good deal, some, or not that much?”
ACT Score
Each respondent’s test score was provided by the University of Wisconsin, Madison, Office of the Registrar.
Parents’ Education
“What is the highest academic degree held by your [mother/father]: less than high school, high school diploma or general equivalency diploma, some college, college undergraduate degree, or postgraduate degree?”

C-SNIP Panel Survey Questions and Variables |
157 |
Peer Characteristics Used in Chapter 6 (Table B.7)
Trust between Roommates
“How much do you feel you can trust your roommate: very much, somewhat, not that much, or not at all?”
Subject Enjoys Spending Time with Roommate
“How much do you enjoy spending time with your roommate: very much, somewhat, not that much, or not at all?”
Roommate’s Knowledge about Politics and Current Events
“Generally speaking, how much do you think your roommate knows about politics and current events: a great deal, some, or not much?”
Roommate’s Civic Interest/Activity
“How active and interested do you think your roommate is in politics and current events: very, somewhat, not very, or not at all?”
Overall Similarity between Subject and Roommate
“Overall, how similar would you say your roommate is to you: very similar, somewhat similar, somewhat dissimilar, or very dissimilar?”
Political Similarity between Subject and Roommate
“Thinking about your own beliefs about politics and current events, how similar would you say your roommate is to you: very similar, somewhat similar, somewhat dissimilar, or very dissimilar?”
TABLE B.7 Peer characteristics (descriptive statistics)
|
Minimum |
Maximum |
Mean |
SD |
Trust between roommates |
−.43 |
4.22 |
2.41 |
.82 |
Subject enjoys spending time with roommate |
−.85 |
4.08 |
1.96 |
1.00 |
Overall similarity with roommate |
−.82 |
3.71 |
1.56 |
.96 |
Political similarity with roommate |
−.99 |
3.44 |
1.60 |
.91 |
Roommate’s civic knowledge |
−.07 |
3.79 |
1.93 |
.61 |
Roommate’s civic interest/activity |
−.73 |
4.27 |
1.36 |
.85 |
Source: C-SNIP Panel Survey.
Note: The values in this table are means calculated from five imputed data sets. The minimums of some variables are negative because the range for ordinal variables (i.e., a “range prior”) was not specified in the imputation algorithm. SD, standard deviation. N = 1,044.

158 |
Appendix B |
Other Variables (Table B.8)
Political versus Community Involvement
“In general, which do you think is the better way to solve important issues facing the country: through political involvement (e.g., voting, working for political candidates and the like) or through community involvement (e.g., volunteering in the community and the like)?”
Perceived Importance of Civic Participation
“How important do you think it is for people like you to be active and interested in politics and current events: very important, somewhat important, not very important, or not at all important?”
Available Free Time
“How much free time [did you have/have you had] during the average week to participate in the types of organizations you answered questions about at the beginning of this survey: a lot of time, a moderate amount of time, very little time, or no time at all?”
TABLE B.8 Other variables (descriptive statistics)
|
Minimum |
Maximum |
Mean |
SD |
Political versus community involvement |
|
|
|
|
High school |
.00 |
1.00 |
.23 |
.42 |
1st year of college |
.00 |
1.00 |
.28 |
.45 |
4th year of college |
.00 |
1.00 |
.23 |
.42 |
Perceived importance of civic participation |
|
|
|
|
1st year of college |
.00 |
3.87 |
2.32 |
.63 |
4th year of college |
−.03 |
4.09 |
2.30 |
.64 |
Free time |
|
|
|
|
High school |
1.00 |
4.00 |
3.00 |
.59 |
1st year of college |
.67 |
4.30 |
2.53 |
.66 |
4th year of college |
.47 |
4.54 |
2.45 |
.66 |
Knowledge about politics and current events |
|
|
|
|
High school |
.99 |
3.00 |
2.08 |
.70 |
1st year of college |
.45 |
3.70 |
1.94 |
.65 |
4th year of college |
.16 |
3.88 |
2.02 |
.61 |
News media usage |
|
|
|
|
High school |
.97 |
7.00 |
3.71 |
1.98 |
1st year of college |
−2.16 |
8.17 |
3.25 |
1.99 |
4th year of college |
−1.39 |
9.65 |
3.95 |
2.00 |
Source: C-SNIP Panel Survey.
Note: The values in this table are means calculated from five imputed data sets. The minimums of some variables are negative because the range for ordinal variables (i.e., a “range prior”) was not specified in the imputation algorithm. SD, standard deviation. N = 1,044.
C-SNIP Panel Survey Questions and Variables |
159 |
Knowledge about Politics and Current Events
“Generally speaking, how much would you say you knew about politics and current events [during high school/during your first year here at the University of Wisconsin/during this last year at the University of Wisconsin]: a good deal, some, or not that much?”
News Media Use
“How many days per week, on average, did you read or watch the news to learn about politics and current events [during high school/during your first year here at the University of Wisconsin/during this last year at the University of Wisconsin]?”

APPENDIX C
Matching Data Pre-processing
or this analysis I used a “full matching” procedure (Gu and Rosenbaum F1993; Hansen 2004; Ho et al. 2007a, 2007b, 2007c; Rosenbaum 1991; Stuart and Green 2008). The procedure was conducted using the using the MatchIt package for R (Ho et al. 2007a, 2007b), which makes use of the Optmatch package (Hansen 2004). The C-SNIP Panel Survey data set is tailor-made for matching because subjects were surveyed about their characteristics before they engaged in civic talk with their college roommates (i.e., before they were exposed to the civic talk “treatment”). As listed in Table C.1, 109 pre-treatment variables were used in the matching procedure. Matching on a large number of pre-treatment covariates increases the validity of the final analysis, because it is likely that more alternative explanations of the civic talk effect are accounted for (Ho et al. 2007b). This set of variables included measures of civic participation in high school, measures of why each student ranked the dormitories in the way that they did, indicators of which dorm each subject was eventually placed into, information on the subject’s roommate and dormitory, demographics, measures of home life before coming to college,
and civically relevant attitudes and characteristics.
The full matching procedure involved three steps. First, study subjects were classified as having been “treated” or “untreated” with civic talk. Subjects who engaged in an above-average amount of civic talk with their

162 Appendix C
TABLE C.1 Summary of pre-treatment covariates included in matching procedure
Type |
Examples |
Past patterns of civic participation |
Participation in voluntary civic organizations; |
|
political participation |
Reasons for dormitory ranking |
Subject reported seeking a social environment, |
|
academic environment, location, amenities, and |
|
the like |
Dormitory placement |
Indicator variables for placement in each of the |
|
fifteen dormitories |
Information on roommates and |
Familiarity with roommates and dorm mates |
dorm mates |
before coming to college |
Demographics |
Race; gender; composite ACT score; citizenship; |
|
favorite subject of study in high school; state of |
|
residence |
Home life before college |
Civic talk with parents; parents’ civic interest/ |
|
activity; parents’ partisanship; parents’ household |
|
income; size of hometown |
Relevant attitudes/characteristics |
Ideology; partisanship; interests in politics and |
|
current events; 2000 election candidate |
|
preferences; social gregariousness |
|
|
Source: C-SNIP Panel Survey. |
|
roommates were classified as having been treated (N = 495), while those who engaged in a below-average amount of civic talk were classified as untreated (N = 549). Second, the variables included in the matching procedure were used to estimate a score of one’s propensity to engage in civic talk (Hansen 2004; Ho et al. 2007a, 2007b). Third, at least one untreated subject was matched to at least one treated subject based on how close the propensity scores were between treated and untreated subjects (a process that creates “subclasses” in which more than one treated subject can be matched to an untreated subject, and vice versa). Each untreated subject was only matched to one treated subject, and vice versa (matching without replacement). Also, after a subject was initially matched, he or she could have been moved and matched to a different subject before the procedure concluded to improve the overall similarity between treated and untreated subjects in the data set—that is, the process is “optimal,” not “greedy.” Unlike other forms of matching (e.g., “exact matching”), each case in the original data set is included in the matched data set (i.e., cases are not discarded).
The results of the matching procedure were incorporated into the analysis by weighting the regression models. All treated subjects were

Matching Data Pre-processing |
163 |
TABLE C.2 Improvement in balance between treated and untreated cases
Overall |
99.70% |
QQ plot summary statistics |
|
Median |
94.10% |
Mean |
93.42% |
Maximum |
89.53% |
Source: C-SNIP Panel Survey.
given a weight of 1. Untreated subjects were assigned a weight equal to the number of treated subjects in the subclass to which they were assigned, divided by the number of untreated subjects in the subclass to which they were assigned. For example, an untreated subject who was assigned to a subclass with ten treated subjects and one untreated subject was assigned a weight of ten, while an untreated subject who was assigned to a subclass with one treated subject and ten untreated subject was assigned a weight of .10. Consequently, applying this weight caused the regression model to pay more attention to untreated subjects who were similar to treated subjects and less attention to untreated subjects who were dissimilar to treated subjects, making the analysis a better comparison between the treated and untreated subjects than if the data had not been weighted.
The results presented in Table C.2 illustrate how the matching procedure increased the similarity, or “balance” (Ho et al. 2007a, 2007b), between subjects who did and did not engage in civic talk. The first row in the table shows the overall improvement in similarity between treated and untreated subjects, as measured by the subject’s estimated propensity to engage in civic talk (i.e., the propensity score created by the matching procedure). Overall, the similarity in the propensity to engage in civic talk between subjects who did and did not engage in civic talk increased by nearly 100 percent as a result of matching. The remaining rows of the table show the summary statistics from QQ plots, which are two-dimensional graphs that plot the empirical distribution of a variable among treated subjects on one axis against the empirical distribution of that same variable among untreated subjects on the other axis. The closer this plotted line is to the forty-five-degree line on the graph, the closer treated and untreated subjects are to being perfectly balanced on that variable. The results in Table C.2 show that the median, mean, and maximum distance of the propensity-score QQ plot from the forty-five-degree line were all greatly improved due to the matching procedure.