

FAO/WHO expert consultation on carbohydrates in human nutrition |
23 |
CHAPTER 4
THE ROLE OF THE GLYCEMIC INDEX IN FOOD CHOICE
Carbohydrate foods often contain vitamins and minerals plus other compounds, such as phytochemicals and antioxidants, which may have health implications. Consuming a wide variety of carbohydrate foods is therefore recommended as this is more likely to be a nutritionally adequate diet with the health benefits commonly ascribed to carbohydrate foods (83).
Food choice depends not only on nutrition and health considerations but also on factors such as local availability, cultural acceptability and individual likes and needs. There is no one measure which can be used to guide food choices in all cases. The chemical composition of foods (e.g. fat, sugars, dietary fibre content) should be an important factor influencing food choice. However, simply knowing the chemical nature of the carbohydrates in foods, for example, does not reliably indicate their actual physiologic effects. Foods which are good choices in some situations may not be the best choices in others. Likewise, foods which are poor choices in some situations may be good choices in others.
Two indices of carbohydrate foods based on their physiologic functions have been proposed. A recently suggested satiety index (84) measures the satiety value of equal energy portions of foods relative to a standard, which is white bread. The factors which control food intake are complex and satiety needs to be distinguished from satiation. Nevertheless, investigation of satiety indices of foods is considered an interesting area of future research, which, if validated, may aid in the selection of appropriate carbohydrate foods to promote energy balance. A more established index is the glycemic index which can be used to classify foods based on their blood glucose raising potential.
Definition of glycemic index (GI)
The glycemic index is defined as the incremental area under the blood glucose response curve of a 50g carbohydrate portion of a test food expressed as a percent of the response to the same amount of carbohydrate from a standard food taken by the same subject. The italicized terms are discussed below because the methods used to determine the glycemic index of foods and to apply the information to diets may profoundly affect the results obtained.
Incremental area under the curve
A number of different methods have been used to calculate the area under the curve. For most glycemic index data, the area under the curve has been calculated as the incremental area under the blood glucose response curve (IAUC), ignoring the area beneath the fasting concentration. This can be calculated geometrically by applying the trapezoid rule. When a blood glucose value falls below the baseline, only the area above the fasting level is included. Sample data are shown in Table 1. The data for Standard #1 are used in the diagram in Figure 2 to illustrate the details of the actual calculation.
24 |
Chapter 4 The role of the glycemic index in food choice |
TABLE 1
Sample blood glucose responses to the ingestion of 50g carbohydrate
Minutes |
|
0 |
|
15 |
|
30 |
|
45 |
|
60 |
|
90 |
|
120 |
|
|
IAUC |
|||||||
Standard #1 |
4.3 |
6.3 |
7.9 |
5.3 |
4.1 |
4.6 |
4.9 |
114 |
||||||||||||||||
Standard #2 |
4.0 |
6.0 |
6.7 |
5.5 |
5.3 |
5.0 |
4.2 |
155 |
||||||||||||||||
Standard #3 |
4.1 |
5.8 |
8.0 |
6.5 |
5.9 |
4.8 |
3.9 |
179 |
||||||||||||||||
Test Food |
4.0 |
5.0 |
5.8 |
5.4 |
4.8 |
4.2 |
4.4 |
93 |
||||||||||||||||
|
|
|
|
|
|
|
|
|
|
|
|
|
|
|
|
|
|
|
|
|
|
|
|
|
50g carbohydrate portion:
The portion of food tested should contain 50g of glycemic (available) carbohydrate. In practice, glycemic carbohydrate is often measured as total carbohydrate minus dietary fibre, as determined by the AOAC method. Since this method does not include RS1 and RS2 when they are present, they will be mistakenly included as glycemic carbohydrate.
Blood glucose response
This is normally measured in capillary whole blood. Plasma glucose can be used to determine the glycemic index and gives similar values. However, capillary blood is preferred because it is easier to obtain, the rise in blood glucose is greater than in venous plasma and the results for capillary blood glucose are less variable than those for venous plasma glucose. Thus, differences between foods are larger and easier to detect statistically using capillary blood glucose (85). An illustration of the difference between glucose as measured in simultaneouslyobtained venous plasma and capillary whole blood is shown in Table 2.
TABLE 2
Glucose response from capillary blood and venous plasma
|
|
0min |
|
15min |
|
30min |
|
45min |
|
60min |
|
90min |
|
120min |
|
IAUC |
Capillary |
4.1 |
6.3 |
9.0 |
8.7 |
6.7 |
5.7 |
3.9 |
279 |
||||||||
blood |
|
|
|
|
|
|
|
|
|
|
|
|
|
|
|
|
Venous |
5.0 |
7.1 |
8.8 |
8.0 |
5.6 |
5.4 |
4.2 |
155 |
||||||||
plasma |
|
|
|
|
|
|
|
|
|
|
|
|
|
|
|
|
|
|
|
|
|
|
|
|
|
|
|
|
|
|
|
|
|
Standard food
Either white bread or glucose can be used as the standard food. The GI values obtained if white bread is used are about 1.4 times those obtained if glucose is the standard food. Other standard foods could be used, but to enable comparison with data in the literature, the GI of the new standard food relative to standardized white bread or glucose should be established.
Same subject
Blood glucose responses vary considerably from day-to-day within subjects. Thus, to obtain a representative mean response to the standard food, it is recommended that the standard food be repeated at least three times in each subject. This is illustrated by the data in Table 1, which
FAO/WHO expert consultation on carbohydrates in human nutrition |
25 |
is typical for normal subjects. The standard food was repeated three times giving IAUCs of: 114, 155 and 179. The mean±SD IAUC is 149±33 and the coefficient of variation (100×SD/mean) is 22%. For this subject, the GI of the test food = 100×93/149 = 62.
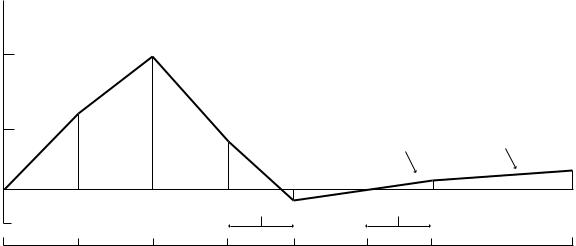
Figure 2
Sample calculations of incremental area under the curve (IAUC)
mmol/L |
8.0 |
3.6 |
|
|
|
|
|
|
|
||
|
|
|
|
|
|
glucose |
2.0 |
|
|
|
|
|
|
|
|
|
|
Blood |
6.0 |
1.0 |
|
|
F |
B |
C |
|
E |
||
|
|
|
|
||
|
A |
D |
0.2 |
0.3 |
|
|
|
|
|||
|
0.6 |
t' |
|
t" |
|
|
|
|
|
||
|
4.0 |
|
|
|
|
|
0 |
30 |
60 |
90 |
120 |
Time (min)
The IAUC for the data illustrated above (Standard #1, Table 3) equals the sum of the areas of the triangles and trapezoids: A+B+C+D+F
The area of triangle A = 2.0 x 15/2 = 15.0
The area of trapezoid B = (2.0 + 3.6) x 15/2 = 42.0
The area of trapezoid C = (3.6 + 1.0) x 15/2 = 34.5
The area of triangle D = 1.0 x t'/2
since: |
t'/15 = 1.0/(1.0 + 0.2) |
therefore: |
t' = 15 x 1.0/1.2 = 12.5 |
therefore the area of triangle D = 1.0 x 12.5/2 = 6.25 |
|
The area of triangle E = 0.3 x t"/2 |
|
since: |
t"/30 = 0.3/(0.3 + 0.2) |
therefore: |
t" = 30 x 0.3/0.5 = 18 |
therefore the area of triangle D = 0.3 x 18/2 = 2.7 The area of trapezoid F = (0.3 + 0.6) x 30/2 = 13.5
Therefore, IAUC = 15.0 + 42.0 + 34.5 + 6.25 + 2.7 +13.5 = 114 mmol.min/L
Protocol
To determine the GI of the food, the tests illustrated in Table 1 would be repeated in six or more subjects and the resulting GI values averaged. Normally, the GI for more than one food would be determined in one series of tests, for example, each subject might test four foods once each and the standard food three times for a total of seven tests in random order on

26 |
Chapter 4 The role of the glycemic index in food choice |
separate days. Subjects are studied on separate days in the morning after a 10-12 hour overnight fast. A standard drink of water, tea or coffee should be given with each test meal.
Factors influencing the blood glucose responses of foods
Starchy foods with a low GI are digested and absorbed more slowly than foods with a high GI. Some factors that influence glycemic properties of foods are listed in Table 3.
TABLE 3
Food factors influencing glycemic responses
Amount of carbohydrate
Nature of the monosaccharide components
Glucose
Fructose
Galactose
Nature of the starch
Amylose
Amylopectin
Starch-nutrient interaction
Resistant starch
Cooking/food processing
Degree of starch gelatinization
Particle size
Food form
Cellular structure
Other food components
Fat and protein
Dietary fibre
Antinutrients
Organic acids
Calculation of glycemic index of meals or diets
The GI can be applied in a detailed fashion to mixed meals or whole diets by calculating the weighted GI value of the meal or diet. For example, the way to calculate the GI of a meal containing bread, cereal, sucrose, milk and orange juice is shown in Table 4.