


27.Engel AF, Kamm MA, Bartram CI, Nicholls RJ. Relationship of symptoms in faecal incontinence to specific sphincter abnormalities. Int J Colorectal Disease 1995;10:152–155.
28.Felt-Bersma RJ, Klinkenberg-Knol EC, Meuwissen SG. Anorectal function investigations in incontinent and continent patients. Differences and discriminatory value. Dis Colon Rectum 1990;33:479–485; discussion 485–486.
29.Sun WM, Donnelly TC, Read NW. Utility of a combined test of anorectal manometry, electromyography, and sensation in determining the mechanism of ‘idiopathic’ faecal incontinence. Gut 1992;33:807–813.
30.Sun WM, et al. Anorectal function in patients with complete spinal transection before and after sacral posterior rhizotomy. Gastroenterology 1995;108:990–998.
31.Caruana BJ, Wald A, Hinds JP, Eidelman BH. Anorectal sensory and motor function in neurogenic fecal incontinence. Comparison between multiple sclerosis and diabetes mellitus. Gastroenterology 1991;100:465–470.
32.Tjandra JJ, et al. Anorectal physiological testing in defecatory disorders: a prospective study. Aust N Z J Surg 1994;64: 322–326.
33.Rao SS, Welcher KD, Leistikow JS. Obstructive defecation: a failure of rectoanal coordination. Am J Gastroenterol 1998;93: 1042–1050.
34.Read NW, et al. Anorectal function in elderly patients with fecal impaction. Gastroenterology 1985;89:959–966.
35.Kumar D, et al. Prolonged anorectal manometry and external anal sphincter electromyography in ambulant human subjects. Dig Dis Sci 1990;35:641–648.
36.Rao SS, Patel RS. How useful are manometric tests of anorectal function in the management of defecation disorders? Am J Gastroenterol 1997;92:469–475.
37.Vaizey CJ, Kamm MA. Prospective assessment of the clinical value of anorectal investigations. Digestion 2000;61:207–214.
See also BIOFEEDBACK; ESOPHAGEAL MANOMETRY; GASTROINTESTINAL HEMORRHAGE.
ANTIBODIES, MONOCLONAL. See MONOCLONAL
ANTIBODIES.
APNEA DETECTION. See VENTILATORY MONITORING.
ARRHYTHMIA, TREATMENT. See DEFIBRILLATORS;
PACEMAKERS.
ARRHYTHMIA ANALYSIS, AUTOMATED
STEPHANIE A. C. SCHUCKERS
Clarkson University
Potsdam, New York
INTRODUCTION
Sudden cardiac death is estimated to affect 400,000 people annually (1). Most of these cases are precipitated by ventricular fibrillation (VF), a chaotic abnormal electrical activation of the heart. Ventricular fibrillation disturbs systemic blood circulation and causes immediate death if therapy in the form of an electrical shock is not immediately applied. In fact, survival depends dramatically on the time it takes for therapy to arrive (2). Automated arrhyth-
ARRHYTHMIA ANALYSIS, AUTOMATED |
69 |
mia detection is a key component for speeding up defibrillation therapy through medical devices that detect arrhythmia and provide treatment automatically without human oversight. Examples of devices include implantable defibrillators, public access automated external defibrillators, and more.
Arrhythmias generally are an abnormal electrical activation of the heart. These abnormalities can occur in the atrial chambers, ventricular chambers, or both. Since the ventricles are the chambers responsible for providing blood to the body and lungs, disruptions in the electrical system that stimulates the mechanical contraction of the heart can be life threatening. Examples of ventricular arrhythmias include VF and ventricular tachycardia (VT), as seen in Fig. 1. Atrial arrhythmias including atrial fibrillation (AF), atrial flutter (AFl), and supraventricular tachycardia (SVT) are not immediately life threatening, but can cause uncomfortable symptoms and complications over the long term.
Automated arrhythmia analysis is the detection of arrhythmias through the use of a computer. This article focuses on arrhythmia detection performed without human oversight. The primary focus will be algorithms developed for the implantable cardioverter defibrillator (ICD). An implantable cardioverter defibrillator is a device that provides an electrical shock to ventricular fibrillation and tachycardia to terminate it and restart NSR. The implantable cardioverter defibrillator was developed in the late 1970s and FDA-approved in the mid-1980s (4–7). A
Figure 1. Unipolar electrograms (measurements of the electrical activity from inside the heart) for normal sinus rhythm (NSR), ventricular tachycardia (VT), and VF [10 s of the passage are shown (AAEL234) (3)].

70 ARRHYTHMIA ANALYSIS, AUTOMATED
Table 1. Truth Table Used to Determine Sensitivity and Specificity, Measurements of Automated Algorithm Performance
Device/Truth-> |
VT/VF |
All Others |
|
|
|
VT/VF |
True positive |
False positive |
All others |
False negative |
True negative |
|
|
|
catheter placed in the right ventricle is used for both sensing and therapy. This device has a long history of arrhythmia detection algorithms developed in research laboratories and brought to the marketplace. Other medical devices that use purely automated arrhythmia detection include the automatic external defibrillator and the implantable atrial defibrillator. Semiautomated arrhythmia detection is used in ambulatory and bedside monitoring. These topics will be touched on briefly.
It is important to consider the measurements used to assess the performance of automated arrhythmia analysis. Sensitivity is defined as the percent correct detection of disease, while specificity is the percent correct detection of not disease. Take the case of an implantable defibrillator that detects ventricular tachycardia and ventricular fibrillation. Consider the truth table in Table 1.
True Positives
Sensitivity ¼ True Positives þ False Negatives
True Negatives
Specificity ¼ True Negatives þ False Positives
A false positive is one minus the specificity, while a false negative is one minus the sensitivity.
Early Work
The earliest examples of computer-based arrhythmia analysis are semiautomated approaches for bedside and ambulatory monitoring. Ambulatory monitoring typically uses a 24 or 48 h, three-lead, portable electrocardiogram (ECG) recorder that the patient wears to diagnosis arrhythmias. Arrhythmia analysis is done in an off-line fashion with technician oversight, such that it is not purely automated
(8). Other ambulatory monitors include loop recorders or implanted monitors like Medtronic Reveal Insertable Loop Recorder that permanently records with patient interaction. Clinical bedside monitors typically are also not fully automated, but are used as initial alarms, which is then over read by clinical staff.
In ambulatory monitoring, in addition to detection of arrhythmias, it is typical to also detect premature ventricular contractions (PVCs). These PVCs are beats that form ectopically in the ventricle and result in an early, wide ECG beat and occur alone or in small groups of two or more. They are considered a potential sign of susceptibility to arrhythmias.
Use of correlation is a common tool in surface arrhythmia analysis (9–18). Correlation waveform analysis (CWA) uses the correlation coefficient between a previously stored template of sinus rhythm and the unknown cycle under analysis. The correlation coefficient, used by CWA, is
computed as |
|
|
Pi¼¼1 |
ðti t¯Þðsi s¯Þ |
|
|||||||||||||
r |
|
|
|
|||||||||||||||
|
|
|
|
i |
N |
|
|
|
|
|
|
|
|
|
|
|||
|
¼ |
q i |
||||||||||||||||
|
|
P |
i¼N |
ð |
t |
|
|
t¯ |
Þ |
2 |
i¼N |
ð |
s |
|
s¯ 2 |
|||
|
|
¼ |
1 |
|
i |
|
|
P |
¼ |
1 |
|
i |
Þ |
|||||
|
|
|
|
|
|
|
|
|
|
i |
|
|
|
|
||||
where r ¼ the correlation coefficient, N ¼ the number of template points, ti ¼ the template points, si ¼ the signal points under analysis, t¯ ¼ the average of the template points, and s¯ ¼ the average of the signal points. The correlation coefficient falls within a range 1 < r < þ 1, where þ 1 indicates a perfectly matched signal and template.
To compute CWA, a beat detector (described in more detail in the section implantable cardioverter defibrillators) finds the location of each beat. From the location of each beat, the template is aligned with the beat under analysis, typically using the peak, and the correlation coefficient is calculated. Often, the template is shifted and the procedure is repeated to determine the best alignment indicated by the highest correlation coefficient. An example of CWA is shown in Fig. 2. Sustained high correlation indicates normal sinus rhythm and low indicates an arrhythmia.
Examples of other features used in PVC and arrhythmia detection include timing, width, height, area, offset, first spectral moment (5–25 Hz), T-wave slope, and others (9,13,14,17,20–24). Another early approach was to develop a database of electrocardiogram templates grouping similar shaped complexes based on shape, width, and prematurity (17,25–28).
Some of the earliest algorithms for purely automated arrhythmia detection involved algorithms for newly developing implantable devices for SVT termination and the developing implantable defibrillator (29,30). With problems of inducing ventricular arrhythmias in the devices for SVT termination, focus shifted to the implantable
Template |
Sinus |
Ventricular |
|
rhythm |
tachycardia |
x1 x2 x3 |
y1 y2 y3 |
r = 0.999 |
r = 0.535 |
Figure 2. Example of use of correlation waveform analysis. The first electrogram is the stored normal sinus rhythm template, the second is a NSR beat with correlation equal to 0.999 and the third is a ventricular tachycardia with correlation equal to 0.535. (Used with permission from Ref. 19.)
defibrillator (31,32). In the early 1980s, Furman (29) proposed that two sensors (atrial and ventricular) be required for automatic diagnosis of tachycardia (with even a possible refinement of a third sensor for hestidine (His) bundle detection). He also suggested examining the QRS configuration for a match with sinus rhythm as a schema for diagnosing supraventricular tachycardia. Other early work included the development of algorithms for surface electrocardiography that used an esophogeal electrode for analysis of atrial information (33,34).
The original detection mechanism in the first implantable defibrillator, the AICD, was the probability density function (PDF). This algorithm utilized the derivative of the signal to define the duration of time that the signal departed from baseline (31,32) and was empirically based upon the observation that the ventricular fibrillation signal spends the majority of its time away from the electrocardiographic isoelectric baseline when compared to sinus rhythm or supraventricular rhythms (Fig. 1). The PDF was supplanted at a veryearly stagebyintrinsic heart ratemeasures.
The need to identify and cardiovert ventricular tachycardia in addition to detecting and defibrillating ventricular fibrillation, and the recognition that sufficiently slow VT might have rates similar to those that may occur during sinus rhythm or supraventricular tachycardias resulted in several changes being incorporated into the second generation of devices. An alternative time-domain method called temporal electrogram analysis was incorporated into some second-generation devices (35). This algorithm employed positive and negative thresholds, or rails, placed upon electrograms sensed during sinus rhythm. A change in electrogram morphology was identified when the order of the excursion of future electrograms crossed the predetermined thresholds established during sinus rhythm. The combination of this morphologic method with ventricular rate was intended to differentiate ventricular tachycardia from other supraventricular tachycardias including sinus tachycardia.
Experience with probability density function and temporal electrogram analysis in firstand second-generation devices was disappointing. Probability density function was found to be unable to differentiate sinus tachycardia, supraventricular tachycardia, ventricular tachycardia, and ventricular fibrillation whose respective rates exceeded programmed device thresholds for tachycardia identification (36). A similar experience was encountered with temporal electrogram analysis. As a result, these criteria were utilized less and less frequently as increasing numbers of second-generation devices were implanted. By 1992, < 15% of all ICDs implanted worldwide utilized either algorithm for tachycardia discrimination (37).
IMPLANTABLE CARDIOVERTER DEFIBRILLATORS
Over time, the implantable cardioverter defibrillator added capabilities to pace terminate and cardiovert ventricular tachycardia and provide pacemaker functions, single and dual chamber. Early reviews of automated algorithms particularly for implantable defibrillators are given in Refs. 38–40. More recent reviews of automated arrhythmia
ARRHYTHMIA ANALYSIS, AUTOMATED |
71 |
detection algorithms include a thorough review by Jenkins and the author in 1996 (41) and reviews incorporating recent developments in dual chamber algorithms in 1998 and 2004 (42,43).
Rate-Based Analysis
The main method for detection of arrhythmias after initial use of PDA and TEA was the use of intrinsic heart rate for detection of ventricular tachycardia and ventricular fibrillation. To this day, all algorithms in ICDs have rate as a fundamental component for detection of arrhythmias. Since implantable defibrillators have a stable catheter screwed in the apex of right ventricle, the rate of the ventricles can be determined with little of the noise that is present at the surface of the body, like motion artifact and electromyogram noise. Ventricular tachycardia and ventricular fibrillation have rates of 120–240 beats per minute and > 240 beats per minute, respectively.
Many approaches abound for arrhythmia detection using rate, but the general procedure is the same (Fig. 3). First, each ECG beat must be detected. Second, the time between beats (or the cycle length) is determined. Most algorithms rely on cycle length (CL) values over beats per minute. The value of the CL determines the zone it falls into: Normal, VT, or VF. In some cases, zones may be further divided depending on the device and therapy options. The thresholds that define the zones are programmable. Each zone has a programmable counter that will determine when therapy will need to be considered. In addition, each zone has a reset mechanism that may be different depending on the zone. For example, typical VT zones require X consecutive beats within the zone or the counter is reset. While VF often has an X of Y criteria, for example, 12 of 16 beats. This flexibility is due to the fact that VF is of varying amplitude, morphology, and rate, such that each beat may not be detected reliably and/or may not be in the VF zone. The CL thresholds, counters, and associated therapies are all programmable.
The fundamental basis of automated rate algorithms is the detection of each beat. Many approaches have been suggested and utilized including fixed thresholds, exponentially varying thresholds, amplitude gain control, and
Deliver therapy
Sense cycle; |
|
|
SR |
|
|
|
|
|
|
|
Calculate |
|
|
|
|
|
|
|
|
|
|
cycle length |
|
|
1 |
|
|
|
|
|
|
|
(CL) |
|
|
|
|
|
|
|
|
|
|
|
Divide into |
|
|
Count # |
|
|
Determine |
|
||
|
|
|
|
|
|
|||||
|
|
|
|
|
|
|||||
|
|
|
|
|
|
|
||||
|
|
zones based |
|
|
|
|
|
|||
|
|
2 |
|
of cycles in |
|
|
therapy based |
|
||
|
|
|
|
|
||||||
|
|
CL or |
|
|
|
|
||||
|
|
|
each zone |
|
|
on zone |
|
|||
|
|
|
|
|
|
|
||||
|
|
CL derivative |
3 |
|
|
|
|
|||
|
|
|
|
|
|
|
|
|
||
|
|
|
|
|
|
|
|
|
|
|
|
|
|
|
|
|
|
|
|
|
|
|
|
|
|
|
|
|
|
|
|
|
|
|
|
|
|
|
|
|
|
|
|
|
|
|
|
|
|
|
|
|
|
|
Figure 3. Typical rate-based arrhythmia detection scheme for implantable cardioverter defibrillators. First, each beat is detected and the cycle length between beats determined. A counter is incremented in the zone that the CL falls and therapy is delivered when the counter reaches a programmed threshold.

72 ARRHYTHMIA ANALYSIS, AUTOMATED
Auto-adjusting Gain Trigger with Slew-rate Window Termination
|
1500 |
|
|
|
value of data |
1000 |
|
|
|
500 |
|
|
|
|
ASCII |
|
|
|
|
|
|
|
|
|
|
0 |
|
|
|
|
−500 |
|
|
|
|
2500 |
3000 |
3500 |
4000 |
|
|
|
Sample points (2 ms each) |
|
Figure 4. Example of beat detector that utilizes an exponentially decaying threshold. After a beat is detected, a blanking period prevents detection of the same beat twice. Then, the threshold (dotted line) for determination of the next beat is calculated as a percentage of the peak amplitude of the previous beat. This threshold exponentially decays, such that beats that are smaller than the currently detected beat will be not be missed (47).
others (9,44–46). In implantable devices, most are hard- ware-based and beyond the scope of this article. For example, one software method relies on an exponentially varying threshold (Fig. 4) (47). After a beat is detected, there is first a blanking period to prevent a beat from being detected more than once. After the blanking period, the threshold for detection of the next beat is set as a percentage of the previous beat. This threshold then decays exponentially such that subsequent beats that have a smaller peak amplitude will be detected. Most beat detectors also have a floor for the threshold, that is, the smallest amplitude by which a beat can be detected to prevent detection of noise as a beat.
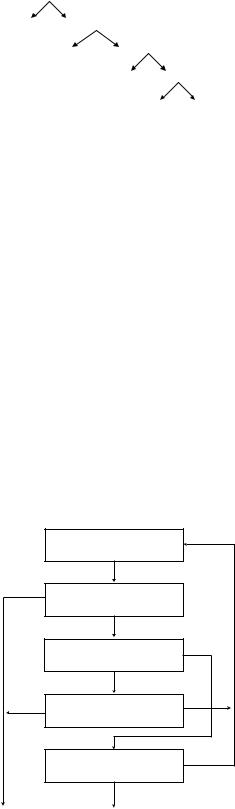
An example of one rate-based algorithm is given in Fig. 5 (40). This algorithm uses three CL thresholds, fibrillation detection interval (FDI), fast tachycardia interval (FTI), and tachycardia detection interval (TDI), and two counters, VF counter (VFCNT) and VT counter (VTCNT). These are combined to result in three zones, VF, fast VT, and slow VT, which can have different therapeutic settings, utilizing defibrillation shock, cardioversion, and antitachycardia pacing. Therapy for ventricular fibrillation is given when 18 of 24 beats are shorter than the FDI. Therapy for slow ventricular tachycardia is delivered when 16 beats counted by the VTCNT are between the FDI and TDI thresholds. The VTCNT will be reset by one long CL greater than TDI. The fast VT zone is a combination of these techniques.
A thorough description of the rate-based algorithms is given in Ref. 40. While many additional features have been added to refine the decision, the main structure of auto-
mated arrhythmia detection algorithms still rely on this fundamental approach (42).
As can be see from Fig. 1, heart rate in VT and VF increase substantially over normal sinus rhythm. This is a reliable means of detecting VT and VF for implantable devices, resulting in high sensitivity. Unfortunately, while providing high sensitivity, heart rate also increases for normal reasons, exercise, stress, resulting in sinus tachycardia or for nonventricular-based arrhythmias like atrial fibrillation, supraventricular tachycardia, atrial flutter, and so on, which do not require therapy from the ICD. Thus, rate-based algorithms have low specificity. False therapies have been estimated in as much as 10–40% in the early devices (48–50). Morphology and other extended algorithmic approaches have long been suggested as a means to increase specificity.
Early rate-based algorithms to prevent false therapies, due to sinus tachycardia, atrial fibrillation, and so on, include onset and rate stability. Rate-based methods were chosen initially over morphology due to the simplicity of calculations in battery operated devices.
Onset is the difference between the rate changes during the onset of sinus tachycardia compared to those of VT, since the onset of VT is typically sudden compared to sinus tachycardia. False therapies due to sinus tachycardia are determined by onset. Figure 6a shows the sudden onset of ventricular tachycardia.
Rate stability is used to prevent false therapies due to AF. In AF, it is common for the ventricle to respond to the atrium at a fast rate. This response is typically irregular since atrial fibrillation, by definition has an irregular rate,

|
|
|
|
|
|
|
|
|
|
|
|
|
|
|
|
|
|
|
|
|
|
|
|
ARRHYTHMIA ANALYSIS, AUTOMATED |
73 |
|||||
|
|
|
|
|
|
|
|
|
|
|
|
|
|
|
|
|
|
|
|
|
|
|
|
|
|
|
|
|
|
|
Wait for a |
|
|
|
Decrement VFCNT |
|
|
|
Increment VFCNT; |
|
|
|
|
Detection |
|
|
|
|
|||||||||||||
new cycle |
|
|
|
if CL-24 < FDI; |
|
|
|
|
|
|
|
|
|
|
|
|
||||||||||||||
|
|
|
|
|
|
|
VFCNT = 18? |
|
|
|
|
of VF |
|
|
|
|
||||||||||||||
length, CL |
|
|
|
|
CL < FDI? |
|
|
|
|
|
|
|
|
|
|
|
|
|||||||||||||
|
|
|
|
|
|
|
|
|
|
|
|
|
|
|
|
|
|
|
|
|
|
|
||||||||
|
|
|
|
|
|
|
|
|
|
|
|
|
|
|
|
|
|
|
|
|
|
|||||||||
|
|
|
|
|
|
|
|
N |
|
|
|
|
|
N |
Y |
|
N |
|
|
|
|
|
||||||||
|
|
|
|
|
|
|
|
|
|
|
|
|
|
|
|
|
|
|
|
|
|
|
|
|
|
|
|
|||
|
|
|
|
|
|
|
|
|
|
|
|
|
|
|
|
|
|
|
|
|
|
|
|
|
|
|
|
|
|
|
|
|
|
|
|
|
|
|
|
|
|
|
|
|
|
|
|
|
All Last 8 |
|
Y |
Detection of |
|
|
|
|
|||||
|
|
|
|
|
|
|
|
N |
|
|
|
|
|
|
|
|
|
CL ≥ FTI? |
|
|
|
fast VT via VF |
|
|
|
|
||||
|
|
|
|
|
|
|
|
VTCNT + VFCNT = 21 |
Y |
|
|
|
|
|
|
|
|
|
|
|
|
|
||||||||
|
|
|
|
|
|
|
|
|
|
|
|
|
|
|
|
|
|
|
||||||||||||
|
|
|
|
|
|
|
|
|
|
N |
|
|
|
|
|
|
|
|
||||||||||||
|
|
|
|
|
|
|
|
|
and VFCNT ≥ 6? |
|
|
|
|
|
|
|
|
|
|
|
|
|||||||||
|
|
|
|
|
|
|
|
|
|
|
|
|
|
|
|
|
|
|
|
|
|
|
||||||||
|
|
|
|
|
|
|
|
|
|
|
|
|
|
|
|
|
|
All Last 8 |
|
Y |
|
|
|
|
|
|||||
|
|
|
|
|
|
|
|
|
|
|
|
|
|
|
|
|
|
|
|
|
|
|
|
|
|
|||||
|
|
|
|
|
|
|
|
|
|
|
|
|
|
|
|
|
|
CL ≥ FDI? |
|
|
|
|
|
|
|
|
||||
|
|
|
|
|
|
|
|
|
|
|
|
|
|
|
|
|
|
|
|
|
|
|
|
|
|
|
|
|
|
|
|
|
|
|
|
|
|
|
|
|
|
|
|
|
|
|
|
N |
|
|
|
|
|
|
|
|
|
|
|
|
|
|
|
|
|
|
|
|
|
|
|
|
|
|
|
|
|
|
|
|
|
|
|
|
|
|
|
|
|
|
|
|
|
|
|
FDI ≤ CL < TDI? |
Y |
|
|
|
Increment VTCNT; |
|
|
Y |
|
|
|
Detection of |
|
|
|
|
|||||||||||
|
|
|
|
|
|
|
|
|
|
|
|
slow VT |
|
|
|
|
||||||||||||||
|
|
|
|
|
|
|
|
|
|
|
|
|
|
|
|
VTCNT = 16; |
|
|
|
|
|
|
|
|
|
|
|
|||
|
|
|
|
|
|
|
|
N |
|
|
|
|
|
|
|
|
|
|
|
|
|
|
|
|
|
|
|
|
|
|
|
|
|
|
|
|
|
|
|
|
|
|
|
|
|
|
|
|
|
|
|
To |
|
||||||||
|
|
|
|
|
|
|
|
|
|
|
|
|
|
|
|
|
|
|
|
|
|
|
|
|
|
|
||||
|
|
|
|
|
|
|
|
|
|
|
|
|
|
|
|
|
|
|
|
|
|
|
|
|
|
|
||||
|
|
|
|
If CL ≥ TDI, then |
|
|
|
|
|
|
|
|
|
|
|
|
|
|
|
therapies |
|
|||||||||
|
|
|
|
|
|
|
|
|
|
|
|
|
|
|
|
|
|
|
|
|
|
|
|
|||||||
|
|
|
|
|
VTCNT = 0 |
|
|
|
|
|
|
|
|
|
|
|
|
|
|
|
|
|
|
|
|
|||||
|
|
|
|
|
|
|
|
|
|
|
|
Medtronic, Inc. PCD JewelTM |
|
|
|
|
|
|
|
|
||||||||||
|
|
|
|
|
|
|
|
|
|
|
|
|
|
|
|
|
|
|
|
|||||||||||
|
|
|
|
|
|
|
|
|
|
|
|
|
|
|
|
|
|
|
|
|
|
|
|
|
|
|
|
|
|
|
Figure 5. Exampleofrate-based algorithm fortheMedtronicPCDJewel. TheVFCNT istheVFcounter, FDI is the fibrillation detection interval, FTI is the fast tachycardia interval, VTCNT is the VT counter, and TDI is the tachycardia detection interval. This algorithm has three zones that has associated programmable therapies including defibrillation shock, cardioversion, and antitachycardia pacing (40).
and since not every beat is conducted from the atrium to the ventricle. Rate stability considers the stability of the ventricular rate, since VT typically has a stable rate compared to the ventricular response to atrial fibrillation. Figure 6b shows an irregular ventricular response to atrial flutter.
Rate and rate-derived measures that measure onset and stability (based on cycle-by-cycle interval measurements) include average or median cycle length, rapid deviation in cycle length (onset), minimal deviation of cycle length (stability), and relative timing measures in one or both chambers or from multiple electrodes within one or more chambers. Among the methods most widely used for detection of VT in commercially available single chamber antitachycardia devices have been combinations of rate, rate stability, and sudden onset (51–56). Pless and Sweeney published an algorithm for (1) sudden onset, (2) rate stability, and (3) sustained high rate (57). This schema among others (58,59) was a forerunner of many
of the methods introduced into tachycardia detection by ICDs (60).
Morphological Pattern Recognition
Instead of relying purely on rate, it has been suggested that morphology may provide the means for automated arrhythmia detection to separate VT and VF from rhythms with fast rates that do not need therapy. Morphology in this context refers to characteristics of the electrogram waveform itself, which are easily identifiable and measurable. Such features might include peak-to-peak amplitude, slew rate (a measure of waveform), sequence of slope patterns, sequence of amplitude threshold crossings, statistical pattern recognition of total waveform shape by correlation coefficient measures, and others (61,62). Figure 1 shows an example of distinctly different waveforms recorded from the right ventricular apex during SR, VT, and VF (3). Furthermore, morphology in the ventricle appears normal
Figure 6. Atrial (top) and ventricular (bottom) electrograms. (a) Sudden onset of VT with normal atrial electrogram, (b) irregular response of ventricular to atrial flutter, (c) simultaneous atrial flutter and ventricular tachycardia, and (d) sudden onset of supraventricular tachycardia with ventricular response.
74 ARRHYTHMIA ANALYSIS, AUTOMATED
even during supraventricular arrhythmias since the rhythm typically is conducted normally in the ventricles.
The ICDs often have two channels of electrograms. The first channel is typically bipolar, which is associated with two electrodes on the lead, or an electrode–coil combination, both located within the ventricle. This channel provides a near-field electrical view of the ventricle and is usually used for beat detection because the electrogram typically has a narrow QRS (the main depolarization of the electrogram). The second electrode configuration is farfield which, for example, may use an electrode in the ventricle versus the implantable device casing. The farfield electrode combination is used primarily for giving the electrical shock. However, this far-field view typically has a more global perspective of the electrogram depolarization and is helpful in differentiating the morphology changes between normal beats and ventricular abnormalities.
Template-Based Algorithms
Correlation Waveform Analysis. Lin et al. (19,62,63) investigated three techniques for morphologic analysis of VT: correlation waveform analysis, amplitude distribution analysis, and spectral analysis. Correlation waveform analysis (CWA) is a classic method of pattern recognition applied to the surface electrocardiogram, described earlier, but was first applied to intracardiac signals in this study. Correlation waveform analysis was shown to be superior and has the advantage of being independent of amplitude and baseline fluctuations. However, it requires heavy computational demands. Less computationally demanding algorithms based on the same principle have been developed and are described in the next section.
Less Computationally Demanding Template-Based Algorithms. Another template matching algorithm based on raw signal analysis measured the area of difference between electrograms, that is, adding absolute values of the algebraic differences between each point on the electrogram and corresponding point on the SR template (64,65). The area of difference was expressed as a percentage of the total area of the template. The measurement of an area of difference is simple computationally, but has the disadvantage of producing erroneous results in the face of baseline and amplitude fluctuations, and this method fails to produce a bounded measure. An improvement on this technique by signal normalization and scaling to create a metric bounded by 1 was utilized by Throne et al. (66).
Steinhaus et al. (67) modified correlation analysis of electrograms to address computational demand by applying data compression to filtered data (1–11 Hz) by retaining only samples with maximum excursion from the last saved sample. The average squared correlation coefficient (r2) was used for separation of SR and VT. Comparison with noncompressed correlations demonstrated that data compression had negligible effects on the results.
Throne et al. (66) designed four fast algorithms and compared discrimination results to CWA performance. These morphological methods were the bin area method (BAM); derivative area method (DAM); accumulated difference of slopes (ADIOS); and normalized area of difference (NAD). All four techniques are independent of ampli-
tude fluctuations and three of the four are independent of baseline changes.
The bin area method is a template matching algorithm that compares corresponding area segments or bins of the template with the signal to be analyzed. Each bin (average of three consecutive points) is adjusted for baseline fluctuations by subtracting the average of the bins over one cycle and normalized to eliminate amplitude variations. This BAM equation is given in the following equation:
|
|
|
|
|
|
|
|
|
|
|
|
|
|
|
|
|
|
|
|
|
|
|
|
||
r |
1 |
i |
¼ |
M |
|
|
|
|
|
|
|
|
|
|
|
|
|
|
|
|
|||||
|
|
|
|
|
|
|
|
|
|
|
|
|
|||||||||||||
|
|
|
|
Ti |
|
T |
|
|
|
Si |
S |
|
|||||||||||||
|
|
|
|
|
|
|
|
|
|
|
|
|
|||||||||||||
|
|
X |
|
|
|
|
|
|
|
|
|
|
|
|
|
|
|
|
|
|
|||||
|
|
k M |
|
|
|
|
|
|
|
|
k M |
|
|
|
|
|
|
|
|||||||
¼ |
|
i |
|
|
1 |
|
¼ |
Tk |
|
|
|
|
|
|
¼ |
Sk |
|
|
|
|
|
||||
|
¼ |
|
|
|
T |
|
|
|
|
||||||||||||||||
|
|
|
|
|
|
|
|
|
X |
|
S |
||||||||||||||
|
|
|
|
|
|
|
X |
|
|
|
|
|
|
|
|||||||||||
|
|
|
|
|
|
|
k 1 |
|
|
|
|
|
|
|
k 1 |
|
|
|
|
|
|
||||
|
|
|
|
|
|
|
|
¼ |
|
|
|
|
|
|
|
¼ |
|
|
|
|
|
|
|||
where the bins are S1 ¼ s1 þ s2 þ s3, S2 ¼ s4 þ s5 þ s6; , SM ¼ sN 2 þ sN 1 þ sN and the average of M bins is S ¼
ð1=MÞSkk¼¼M1 Sk. The bins and average of the bins is calculated similarly for the template. The BAM metric falls between 1 and þ 1, allowing a comparison to CWA.
Normalized area of difference is identical to BAM except that the average bin value is not removed. By not removing the average value the algorithm avoids one division that would otherwise increase computational demand each time the BAM algorithm is applied. The NAD is independent of amplitude changes.
The DAM uses the first derivative of the template and the signal under analysis. The method creates segments from zero crossings of the derivative of the template. It imposes the same segmentation for analysis of the derivative of the signal to be compared. The segments are normalized, but are not adjusted for baseline variations since derivatives are by their nature baseline independent.
The DAM metric is calculated as follows: |
|
||||||||||||||
|
|
|
|
|
|
|
|
|
|
|
|
|
|
||
r |
1 |
i |
¼ |
M |
T˙i |
|
|
S˙i |
|
||||||
|
|
|
|
|
|||||||||||
|
|
|
|
|
|
|
|||||||||
¼ |
|
X |
|
|
|
|
|
|
|
|
|
|
|||
|
k M |
|
|
|
k M |
|
|
|
|||||||
|
i |
|
1 |
¼ |
|
|
|
¼ |
|
|
|
||||
|
|
|
|
|
X |
T˙k |
|
X |
S˙k |
|
|||||
|
|
|
|
|
k 1 |
|
|
|
k 1 |
|
|
||||
|
|
|
|
¼ |
¼ |
|
|
¼ |
|
|
|||||
|
|
|
|
|
|
|
|
|
|
||||||
where ˙k represents the th bin of the first derivative of the
T k
template. The DAM metric falls between 1 and þ 1. The ADIOS is similar to DAM in that it also employs the
first derivative of the waveforms. A template is constructed of the sign of the derivative of the ventricular depolarization template. This template of signs is then compared to the signs of the derivative for subsequent depolarizations. The total number of sign differences between the template and the current ventricular depolarization is then computed as
iX¼N
r ¼ signðt˙iÞ signðs˙iÞ
i¼1
where is the exclusive or operator. The number of sign changes is bounded by 0 and the maximum number of points in the template (N), that is, r 2 f0; . . . ; Ng.
Evaluation of these four algorithms was performed on 19 patients with 31 distinct ventricular tachycardia morphologies. Three of the algorithms (BAM, DAM, and

NAD) performed as well or better than correlation waveform analysis, but with one-half to one-tenth the computational demands.
A morphological scheme for analysis of ventricular electrograms (SIG) was devised for minimal computation (68) and compared to NAD. The SIG is a template-based method that creates a boundary window enclosing all template points that form a signature of the waveform to be compared. Equivalent results of VT separation were seen in the two techniques at two thresholds, but at an increased safety margin of separation SIG outperformed NAD and yielded a fourfold reduction in computation.
Another simplified correlation-type algorithm has been designed using electrogram vector timing and correlation, developed for the Guidant ICD (69). In this algorithm, the rate (near-field) channel is used for determining the location of each beat. The peak of the near-field electrogram or fiducial point is used for alignment of the template with the beat under analysis. From this fiducial point, eight specific points are chosen on the shock (far-field) electrogram. The amplitude of the shock channel at the rate-channel fiducial point is one point. In addition, amplitudes at the turning point, intermediate, and baseline values on the shock channel are selected as shown in Fig. 7. This provides an eight-point template that is compared to subsequent beats using the square of the correlation coefficient, as follows:
FCC |
¼ |
ð8 Ptisi ðPtiÞðPsiÞÞ2 |
|
ð8 Pti2 ðPtiÞ2Þð8 Psi2 ðPsiÞ2Þ |
where each summation is i ¼ 1–8.
When an unknown beat is analyzed, the exact same timing relative to the fiducial point as the template is used for selecting the amplitudes of the unknown beat. For beats that have a different morphology, those points will not be associated with the same amplitudes as the normal template beat and, thus, the correlation coefficient will be low. To incorporate this into an overall scheme to detect
ARRHYTHMIA ANALYSIS, AUTOMATED |
75 |
an arrhythmia, morphology was calculated for a sliding window of 10 beats. If 8 or more beats were detected as abnormal, a VT was detected.
Another algorithm that reduces computational complexity of the standard correlation algorithm uses the wavelet transform of the sinus beat for the template (70). Wavelets can reduce the number of coefficients needed to characterize a beat while still retaining the important morphologic information. The sinus electrogram is transformed using the Haar (square) wavelet, considering a family of 48 wavelets over 187.5 ms window aligned by the fiducial point of the QRS. The wavelet transform is simplified by removing the standard factor of square root of 2. In addition, wavelet coefficients that do not carry much information, defined by a threshold, are set to zero. The remaining coefficients are normalized. This gives a variable template size, depending on the electrogram, but typically between 8 and 20 coefficients. To analyze an unknown electrogram, the electrogram is aligned using the peak (negative or positive) point. The wavelet transform is computed for the unknown electrogram and each coefficient is compared using the absolute difference in wavelet coefficients (ci) between the template and unknown beat. A match is determined by the following equation:
|
|
P |
citemplate |
|
ciunknown |
|
|
|||
Match% |
1 |
|
|
|
|
|
|
100 |
||
|
P |
i |
|
|
|
|
||||
|
|
|
|
|
|
|||||
|
|
|
ctemplate |
|
|
|
||||
|
¼ |
|
|
|
|
|||||
The nominal threshold used in this study is 70%. This morphology algorithm is incorporated into an overall rate scheme by remaining inactive until a ventricular tachycardia has been detected by the rate algorithm. Then, the morphology is calculated for the preceding eight beats. A VT is detected if six or more beats are detected as abnormal.
A novel way of testing this algorithm was used. Instead of, as in most tests, using data prerecorded in laboratory conditions, this algorithm was downloaded to the Medtronic clinical ICDs and tested off-line, while the device functioned with its regular algorithm.
Figure 7. Example for vector timing and correlation algorithm. Alignment of the template is based on the peak of the rate electrogram channel. From the peak, eight specific points on the shock channel are automatically selected for the template (left). These exact points in time relative to the fiducial point selected from the template are applied to the ‘‘unknown’’ beat (right). (Used with permission from Ref. 69.)
76 ARRHYTHMIA ANALYSIS, AUTOMATED
Another algorithm that utilizes morphology is termed morphology discrimination (MD) in St. Jude implantable cardioverter defibrillators (71,72). This algorithm uses an area-based approach. First, the template is defined based on the three consecutive peaks with the largest area. The area under each peak is normalized by the maximum peak area. When analyzing an unknown beat, the beat is aligned with the template using the dominant peak of the unknown beat. If this peak does not have same polarity, the second largest peak is used. If this also does not have the same polarity, a nonmatch is declared. Once the unknown beat and template are aligned, the morphology score is deter-
mined by the following: |
|
þ |
|
|
|||||
|
¼ ð |
|
j |
|
|
||||
Score |
|
1 |
|
NAreaA |
|
NAreaA0 |
NAreaB |
|
NAreaB0 |
þNAreaC NArea PeakC0j Þ 100
where NArea stands for the normalized area of the three corresponding peaks of the template (A, B, C) and test complexes (A0, B0, C0). For arrhythmia diagnosis, once the rate criteria is met, the algorithm determines the number of matching complexes in the morphology window. If the number of matching complexes equals or exceeds a programmed number of matching complexes, VT is not confirmed and therapy is not delivered. This is repeated for as long as the rate criteria has been met or VT is confirmed.
Template matching by CWA was further examined for distinction of multiple VTs of unique morphologies in the same patient (73,74). It was hypothesized that, in addition to a SR template, a second template acquired from the clinical VT could provide confirmation of a later recurrence of the same VT. The recognition of two or more different VTs within the same patient could play an important role in future devices in the selection of therapy to be delivered to hemodynamically stable versus unstable VTs.
Considerations for Template Analysis. While templatebased algorithms appear the most promising, several issues need to be addressed. The first is that it is necessary that the normal sinus rhythm beat or template remain stable, that is, does not change over time or due to position or activity. Several studies using temporary electrodes saw changes in the morphology of normal rhythm due to increase in rate or positional changes (75–78) but further studies with fixed electrodes showed no changes in morphology due to heart rate or position, with some changes in amplitude (76,79). A second consideration is that paroxysmal (sudden) bundle branch block (BBB) may be misdiagnosed as ventricular tachycardia (80). While this may result in a false therapy, it does not result in withholding of therapy during life-threatening arrhythmias (the more critical mistake).
Feature-Based Algorithms
Depolarization Width for Detection of Ventricular Tachycardia. Depolarization width (i.e., duration) in ventricular electrograms has been used as a discriminant of supraventricular rhythm (SR) from VT (81,82). Electrogram width is available in the Medtronic single chamber ICDs. This criterion uses a slew threshold to find the
beginning and end of the QRS. Analysis of electrogram width compared to a patient-specific width threshold is performed using the previous eight beats after a VT detected by the rate component of the algorithm. If a minimum of six complexes are greater than the width, then a VT is detected. Otherwise, the counter is reset. This algorithm is not appropriate in patients with BBB that have a wider width for normal beats. Exercise induced variation should be considered in programming (83). Electrogram width has been shown to be sensitive to body position and changes over longer periods of time (6 months in this study) (84).
Amplitude and Frequency Analysis. Amplitude and frequency are distinguishing characteristics of arrhythmia. Amplitude during ventricular tachycardia is typically higher and during ventricular fibrillation is lower than normal sinus rhythm (85,86). These differences have not been considered pronounced and consistent enough, such that a classifier could be based on them.
Frequency-domain analysis is often proposed for classification of rhythms (87) but little success has been solidly demonstrated for the recognition of VT (63). Distinctly different morphological waveforms (SR vs VT), which are easily classified in the time domain, can exhibit similar or identical frequency components if one focuses on the depolarization component alone. Examination of longer segments of 1000–15,000 ms yields the same phenomenon because the power present in small visually distinctive high frequency notches is insignificant compared to the remainder of the signal, and changes in polarity of the waveform, easily recognized in the time domain, are simply not revealed by frequency analysis (63). Frequency-domain recognition of AF (88) and VF (89,90) is perhaps more promising. However, frequency has not been applied in commercial applications given the success of rate and timedomain morphology approaches.
Other Morphologic Approaches. Other approaches that have been suggested in the literature include use of neural networks (91–97). Neural network approaches utilize either features, the time-series, or frequency components as inputs to the neural network. The network is trained on one dataset and tested on a second. Limitations with the approaches developed thus far are related to the fact that there is only limited data for development of the neural network. One problem is that in some studies the training set and test set both include samples from the same patient. Thus, these networks cannot be considered a general classifier for all patients, since it did not have a valid test set for assessing results on unseen patients. Ideally, three sets should be utilized: training, validation, and testing. The purpose of the validation set is to test the generalization of the network, such that it is not overtrained. Plus, it is typical practice to retrain neural networks until good results are achieved on the validation set. A separate testing set verifies that success on the validation set was not just by chance. Until large datasets are available for development of the algorithms, neural networks will not be considered for clinical use. Furthermore, neural networks generally have not achieved much
ARRHYTHMIA ANALYSIS, AUTOMATED |
77 |
acceptance by the clinical community who prefer methods that are tied to underlying physiologic understanding.
Dual-Chamber Arrhythmia Detection
Since dual-chamber pacemakers have been combined into ICDs, the possibility of the use of information from the atrial electrogram for arrhythmia diagnosis has opened up. The most prevalent cause of delivery of false therapy is AF, which accounts for > 60% of all false shocks according to the literature. The simple addition of an atrial sensing lead can dramatically change the false detection statistics.
The first two-channel algorithm for intracardiac analysis incorporated timing of atrial activation as well as ventricular into the diagnostic logic of arrhythmia classification (98,99). This scheme was based on earlier work in which an esophageal pill electrode (33) provided P-wave identification as an adjunct to surface leads in coronary care and Holter monitoring (34). The early argument for adding atrial sensing for improvement of ICD tachycardia detection was advanced conceptually by Furman in 1982 (29), was demonstrated algorithmically by Arzbaecher et al. in 1984 (58), and was further confirmed by Schuger (100). This simple two-channel analysis offers a first-pass method for confirming a VT diagnosis when the ventricular rate exceeds the atrial (Fig. 8). Recognition of a run of short intervals was followed by a comparison of atrial versus ventricular rate. With both chambers (atrial and ventricular) under analysis, most supraventricular arrhythmias could be detected by an N : 1 (A : V) relationship, and most ventricular arrhythmias could be detected by a 1 : N (A : V) relationship. Ambiguity occurred in tachycardias characterized by a 1 : 1 relationship, where SVT with 1 : 1 ventricular conduction could be confounded with ventricular tachycardia with retrograde 1 : 1 atrial conduction. In addition, an N : 1 (A : V) relationship should not be an automatic detection of atrial arrhythmia, since a concurrent ventricular arrhythmia could be masked by a faster atrial arrhythmia, as seen in Fig. 6c. Thus the limitations of two-channel timing analysis, although powerful, needs to be addressed by more advanced logical relationships.
A system designed for two-channel analysis using rate in both chambers plus three supplemental time features (onset derived by median filtering, regularity, and multiplicity) was designed for real-time diagnosis (101) of spontaneous rhythms. This system was an integration of previously tested stand-alone timing schemes (102,103). The combined system is able to recognize competing atrial and ventricular tachycardias and produces joint diagnoses of the concurrent rhythms. Simultaneous VT and atrial flutter is classified via atrial rate, ventricular rate, and a lack of multiplicity. Fast ventricular response in AF is detected via the regularity criterion. Onset (employed in 1:1 tachycardias) utilizes a median filter technique (102).
Commercially, each manufacturer now has available algorithms that utilize information from both chambers for making the diagnosis, particularly for improving specificity. These algorithms are implemented in commercial devices and continually updated and improved. Examples of the algorithms are in the following paragraphs. Reviews are given in Refs. 42,43 along with a thorough comparison of clinical results of the various commercial dual-chamber algorithms (43). Other comparisons include Refs. 104,105.
The first actual realization of a two-channel ICD appeared with the introduction into clinical trials (1995) of the ELA Defender, a dual chamber sensing and pacing ICD that uses both atrial and ventricular signals for its tachycardia diagnoses (106) (Fig. 9). The first step after a fast rate is detected is to consider stability of the ventricular rate. If the rhythm is not stable, atrial fibrillation is detected and no therapy delivered. The next consideration is the association between the A and V. For A : V association of 1 : N or no association, a VT is detected. For N : 1 association, atrial arrhythmia is detected and no therapy delivered. For 1:1 association, the last step is consideration of chamber of onset, ventricular acceleration will result in VT therapy, while no acceleration or atrial acceleration will result in no therapy. An example of a sudden onset in the atrium due to SVT is seen in Fig. 6d. The most recent algorithm, PARADþ incorporates additional features after the association criteria (second step) (107). If there is no PR association, a second criteria is considered where a single
Examine sequence of
recent intervals
< 240 |
|
|
|
|
|
|
A > > V |
V > > A |
|
|
|
< 240 |
|
|
Figure 8. Basic dual chamber arrhythmia |
||||||||||||
Compute |
|
Compute |
|
|
|||||||||||||||||||||||
|
|
|
|
|
|
|
# of |
|
|
|
|
|
|||||||||||||||
|
|
|
|
|
|
|
|
|
|
|
|
detection algorithm. For a sequence of |
|||||||||||||||
|
|
|
|
atrial |
|
|
|
|
|
|
|
A&V |
|
|
|
ventr. |
|
|
|
|
|
||||||
|
|
|
|
|
|
|
|
|
|
|
|
|
|
||||||||||||||
|
|
|
|
|
|
|
|
|
|
|
|
|
|
|
|
|
|
|
|
|
|
|
|
|
|
|
intervals, the number of atrial (A) |
|
|
|
|
|
|
> 330 |
|
|
|
|
|
|
|
|
|
|
|
|
|
|
|
|
|
||||
|
|
|
|
|
|
1:1 |
|
> 330 |
|
|
|
|
|
|
|
|
intervals is compared to the number of |
||||||||||
|
|
|
|
|
|
|
|
|
|
|
|
|
|
|
|
|
|||||||||||
|
|
|
|
|
|
|
|
|
|
|
|
|
|
|
|
|
|
|
|
|
|
|
|
|
|
|
ventricular (V) intervals. If there are |
|
|
|
|
|
|
|
|
|
|
|
|
|
|
|
|
|
|
|
|
|
|
|
|
|
|
|
more V than A, a diagnosis of ventricular |
|
|
|
|
|
|
|
|
|
|
|
|
|
Unknown |
|
|
|
|
|
|
|
|
|
|
|
|
|
fibrillation (VF), ventricular flutter (VFl), |
|
|
|
|
|
|
|
|
|
|
|
|
|
|
|
|
|
|
|
|
|
|
|
|
|
|
|
or ventricular tachycardia (VT) is made |
|
|
|
|
|
|
|
|
|
|
|
|
|
|
|
|
|
|
|
|
|
|
|
|
|
|
|
based on the rate. If there are more V than |
|
|
|
|
|
|
|
|
|
|
|
|
|
|
|
|
|
|
|
|
|
|
|
|
|
|
|
|
|
|
|
|
|
|
|
|
|
|
|
|
|
|
|
|
|
|
|
|
|
|
|
|
|
|
|
A beats, a diagnosis of atrial fibrillation (AF), |
|
|
|
|
|
|
|
|
|
|
|
|
|
|
|
|
|
|
|
|
|
|
|
|
|
|
|
|
|
|
|
|
|
|
|
|
|
|
|
|
|
|
|
|
|
|
|
|
|
|
|
|
|
|
|
atrial flutter (AFl), or atrial tachycardia is |
|
AT |
|
AFl |
|
|
|
AF |
|
|
|
|
|
|
|
VF |
|
|
VFl |
|
VT |
|||||||
|
|
|
|
|
|
|
|
|
|
|
|
|
|
made (AT) (58). |
|||||||||||||
|
|
|
|
|
|
|
|
|
|
|
|
|
|
|
|
|
|
|
|
|
|
|
|
|
|
|
|
78 ARRHYTHMIA ANALYSIS, AUTOMATED
Stable RR |
|
|
No association |
Association |
|
VT |
|
|
N:1 |
1:1 |
|
Afl |
|
|
|
No accel |
Accel |
|
ST |
|
|
Vaccel |
Aaccel |
|
VT |
SVT |
Figure 9. Flowchart of dual-chamber arrhythmia detection algorithm using simple rate-based features. For unstable RR interval (time between beats), atrial fibrillation is detected. For stable RR and no association between the atrium (A)and ventricle (V), ventricular tachycardia (VT) is detected. For N : 1 (A : V) association, atrial flutter (AFl) is detected. For 1 : 1 (A : V) association with no acceleration (Accel), sinus tachycardia (ST) is detected. Last, with a ventricular acceleration, VT is detected and with atrial acceleration (Aaccel) supraventricular tachycardia (SVT) is detected (106).
long ventricular cycle will result in the diagnosis of atrial fibrillation (for the next 24 consecutive cycles) while no long ventricular cycles will result in VT detection.
The Guidant Ventak AV III DR algorithm uses the following scheme, shown in Fig. 10 (104). First, it checks if the ventricular rate is greater than the atrial rate (by 10 bpm). If yes, then VT is detected. If no, then more analysis is performed. If the atrial rate is greater than the atrial fibrillation threshold and the RR intervals are not stable, then supraventricular rhythm is classified. If the RR intervals are stable, VT is detected. If the atrial rate is not greater than the atrial fibrillation threshold, then ventricular tachycardia is detected if the RR intervals are stable and there is a sudden onset of ventricular rate. An updated algorithm from Guidant is described in the next section.
|
Fast ventricular |
|
|
rate |
|
yes |
Ventricular rate > Atrial rate |
|
|
|
|
|
by >= 10 bpm |
|
|
no |
|
|
Atrial rate > Atrial fibrillation |
yes |
|
threshold |
|
|
no |
|
yes |
Stable R-R intervals and |
no |
|
sudden onset of ventricular rate |
|
|
Stable R-R intervals |
no |
|
|
|
|
yes |
|
Detection of ventricular tachycardia |
|
|
Figure 10. Algorithm for Guidant Ventak AV III DR, using comparison of the rate of A and V, stability and onset. (Used with permission from Ref. 104.)
Perhaps the most complex of the dual chamber algorithms rests with the PR Logic algorithm, by Medtronic (42). This algorithm uses a series of measurements from the timing of the atrial ventricular depolarizations to create a code (1 of 19 possible). These codes are then used for ultimate diagnosis. The main component of the algorithm is the timing between the atrial and ventricular beat to determine if the conduction was antegrade or retrograde. For a given ventricular RR interval, if the atrial beat falls 80 ms before or 50 ms after the ventricular beat, the rhythm is considered junctional. Outside of this, if the atrial beat (P-wave) falls within the first one-half of the RR interval, it is considered retrograde conduction. If the atrial beat falls in the second half of the RR interval it is considered antegrade. This is performed for the previous two beats and incorporated in the code. There are only a few programmable components in the algorithm. The first is the type of SVT for which rejection rules apply (AF/AFL, ST, SVT). The second is the SVT limit. The rest are not programmable.
Dual-Chamber with Ventricular Morphological Analysis
The Photon DR from St. Jude incorporates morphology in its dual chamber defibrillator algorithm. The MD in the ventricular chamber described earlier is incorporated in the full algorithm as follows (108). For V > A, ventricular tachycardia is detected. For V < A, a combination of morphology discrimination and interval stability is used to inhibit therapy for atrial fibrillation/flutter and SVT. For the branch V ¼ A, morphology discrimination and sudden onset is used to inhibit therapy for ST and SVT. This algorithm has an automatic template feature update (ATU) for real-time calibration of the sinus template.
A new dual chamber algorithm from Guidant uses the vector timing and correlation (VTC) algorithm, described earlier (69). If the V rate exceeds A rate by > 10 bpm, a VT is detected. Otherwise, VTC algorithm is implemented. If the atrial rate does not exceed the AF threshold, then VTC will be used for diagnosis. Otherwise, stability will be used for diagnosis. Therapy would be inhibited for an unstable ventricular rhythm.
Two-Channel Morphological Analysis. An early algorithm that uses morphological analysis of both the intraatrial signal and the intraventricular signal (109,110) is based on strategy developed previously for surface and esophageal signals (111). A five-feature vector was derived for each cycle containing an atrial and a ventricular waveform metric (ra, rv), where r is the correlation coefficient for each depolarization, and AA, AV, and VV interval classifiers (short, normal, and long). Single-cycle codes were mapped to 122 diagnostic statements. The eight most current cycles were employed for a contextual interpretation of the underlying rhythm. This addition of morphological analysis of both atrial and ventricular channels combined with rate determination in each channel on a cycle-by-cycle basis, dramatically demonstrated the power of modern signal processing in the interpretation of arrhythmias.
One aspect in which analysis of the atrial morphology would be very useful in ICDs is the separation of antegrade versus retrograde atrial conduction. During a 1:1 tachycardia, it is difficult to separate an SVT with 1:1

anterograde conduction (forward conduction from the sinus node through the atrium and AV node to the ventricle) versus a ventricular arrhythmia with retrograde conduction (retrograde conduction from the ventricle through the AV node to the atrium). To differentiate these cases, morphology differences in the atrial electrogram could be utilized, where abnormal morphology would indicate retrograde conduction. Various methods have been described in the literature which use similar approaches as ventricular morphology (112–118).
Distinction of Ventricular Tachycardia and Ventricular
Fibrillation
Discriminating between VT and VF might be useful to allow unique zone settings for choice of therapy. Antitachycardia pacing is a lower energy therapy used to treat VT, which is not painful to the patient. Currently, there is difficulty in detecting each VF cycle, leading to electrogram dropout, which leads physicians to expand the VF detection zone to eliminate the possibility of misdiagnosing VF (119,120). Therefore, many VTs are detected as VF and given shock therapy directly. While these are typically fast VTs, there is a possibility that fast VTs can be terminated using anti-tachycardia pacing protocols, with only limited delay of shock therapy, if fast VTs and VF could be differentiated (121). In one study, 76% of fast VTs would have received shock therapy if programmed traditionally (121). However, by expanding the fast VT zone, 81% diagnosed as fast VT were effectively pace-terminated. More sophisticated digital signal processing techniques could be applied to ensure proper separation of VT and VF by methods more intelligent than counting alone.
For separation of VT and VF, CWA using a sinus rhythm template was tested on a passage of monomorphic ventricular tachycardia and a subsequent passage of ventricular fibrillation in each patient (122–124). The standard deviation of the correlation coefficient (r) of each class (VT and VF) was used as a discriminant function. This scheme was based upon the empiric knowledge that correlation values are more tightly clustered in the cycle-by-cycle analysis of monomorphic VT and more broadly distributed in the dissimilar waveforms in VF. Results showed easy separation of sinus rhythm from VT and VF; however in the VT/ VF separation, standard deviation only achieved limited success Standard deviation requires patient-specific thresholds, may not hold for all template-based algorithms, and adds further computational requirements to the algorithm; therefore, it is not a promising algorithm in its present form for discrimination of VT from VF.
Throne et al. (125) addressed the problem of separating monomorphic and polymorphic VT/VF by using scatter diagram analysis. A moving average filter was applied to rate and morphology channels and plotted as corresponding pairs of points on a scatter diagram with a 15 15 grid. The percentage of grid blocks occupied by at least one sample point was determined. Investigators found that monomorphic VTs trace nearly the same path in twodimensional space and occupy a smaller percentage of the graph than nonregular rhythms such as polymorphic VT or VF.
|
|
|
|
ARRHYTHMIA ANALYSIS, AUTOMATED |
79 |
|||||||||||
|
|
|
|
|
|
|
|
|
|
|
|
|
|
|
|
|
|
|
Fast |
|
|
|
|
|
|
|
|
|
|
|
|
|
|
|
|
rate? |
|
|
|
|
|
|
|
|
|
|
|
|
|
|
|
|
|
|
|
|
|
|
|
|
|
|
|
|
|
||
|
|
|
|
|
Slow |
|
|
|
|
|
|
|
|
|
||
|
|
|
|
|
VT? |
|
|
|
|
|
|
|
|
|
||
|
|
|
|
|
|
Very |
|
|
|
|
|
|
||||
|
|
|
|
|
|
|
|
|
|
|
|
|
|
|
||
|
|
|
|
|
VT |
|
fast? |
|
|
|
|
|
|
|||
|
|
|
|
|
|
|
|
|
IQR> |
|
|
VT |
||||
|
|
|
|
|
|
|
|
|||||||||
|
|
|
|
|
|
|
|
|
VF |
Thresh |
|
|
||||
|
|
|
|
|
|
|
|
|
|
|
|
|||||
|
|
|
|
|
|
|
|
|
|
|
|
|
|
|||
|
|
|
|
|
|
|
|
|
|
|
|
|
|
|
|
|
|
|
|
|
|
|
|
|
|
|
|
|
VF |
|
|||
Figure 11. Basic algorithm for separation of VT and VF using PSC. Once a fast rate is detected, VT and VF are detected for slow fast rates and very fast rates, respectively. Only in the overlap between fast VT and VF rates, is the morphology algorithm implemented. Interquartile range (IQR) of the paired signal concordance over a passage is used.
A magnitude-squared coherence function was developed by Ropella et al. (126), which utilizes filtering and Fourier transformation of intraventricular electrograms derived from two leads with a sliding window to distinguish monomorphic ventricular tachycardia from polymorphic ventricular tachycardia and ventricular fibrillation. This method, while elegant, requires multiple electrode sites and is at present too computationally demanding for consideration in battery operated devices. As technology advances, the possibility of hardware implementation of frequency-based methods such as magnitude-squared coherence and time-domain CWA may become feasible.
A similar algorithm uses two ‘‘unipolar’’ ventricular electrograms, 1 cm apart, to compare the paired signal concordance (PSC) between the electrograms using correlation analysis (127). During normal rhythms and VT, the two closely spaced electrograms will exhibit high correlation, while during VT, the two electrogram will experience low correlation. Considering only rhythms that have a fast rate in the overlap between fast VT and VF rates, the variability of the correlation, measured by interquartile range, over a passage distinguishes VT from VF (Fig. 11).
Complexity measurements have also been utilized for distinction of ventricular tachycardia and fibrillation, including approximate entropy (128), Lempil–Ziv complexity (129), least-squares prony modeling algorithm (130).
OTHER DEVICES THAT USE AUTOMATED ARRHYTHMIA DETECTION
Other commercially available devices that use automated arrhythmia detection algorithms include the automatic external defibrillator and the implantable atrial defibrillator.
Automatic External Defibrillators
Recently, automatic external defibrillators (AEDs) have become widespread and available. The AED is able to determine if the rhythm for an unresponsive, pulseless patients is shockable or unshockable and is able to apply therapy automatically or to inform the user to deliver the

80 ARRHYTHMIA ANALYSIS, AUTOMATED
therapy (131–133). The AEDs are available on location for large organizations, such as airports, airplanes, businesses, sporting events, schools, and malls (134). This expanded availability dramatically increases the possibility that victims of ventricular fibrillation could receive defibrillation in a timely manner, thus, improving survival rates (135).
The AEDs, operating in a truly automated mode, must be exquisitely accurate in their interpretation of the ECG signal (136,137). In an AED, shockable rhythms are rhythms that will result in death if not treated immediately and include coarse ventricular fibrillation and ventricular tachycardia. Nonshockable rhythms are rhythms where no benefit and even possible harm may result from therapy and include supraventricular tachycardia, atrial fibrillation normal sinus rhythm, and asystole. Asystole is not considered shockable for these devices since the leads may be misplaced and no signal captured. Intermediate rhythms are rhythms that may or may not receive benefit from therapy and include fine VF and VT. Ventricular tachycardia is an intermediate rhythm because often it is hemodynamically tolerated in the patient. A rate threshold is usually programmed in the device (even though there is still no universally accepted or obvious delineation in rate for hemodynamic tolerance in the literature).
Contrary to the ICD, AEDs have an extremely necessary requirement for accurate specificity (shocks when not needed) since these devices are expected to be used by untrained personnel. Algorithms must consider large variations in cardiac rhythms and artifact from CPR or patient movement. The risk to the patient and the technician is too great to allow public use for devices with decreased specificity. Given that a bystander is on the scene and that trained help may soon be available, specificity is more important for the first, or immediate response. However, sensitivity must be considered to ensure the AEDs potential to save lives is maximized. In the AED, more battery power can be utilized (since the device is not implanted), and therefore more sophisticated schemes borrowed from ICD technology have been considered.
Current devices use numerous schemes for determining if the patient is in ventricular fibrillation. Common components include isoelectric content (like PDF algorithm of the ICD), zero crossings, rate, variability, slope, amplitude and frequency (138), all similar techniques to those described in the ICD literature. A review of AED algorithms is given in Ref. 138.
One example of a recent algorithm described in the literature is for a programmable automatic external defibrillator designed to be used in the hospital setting for monitoring and automatic defibrillation, if needed (139). This device uses a programmable rate criterion to detect shockable rhythms. In addition, the device has an algorithm which distinguishes VT and SVT rhythms below a SVT threshold. The algorithm uses three features to discriminate between SVT and VT. The first is the modulation domain function that uses amplitude and frequency characteristics. The second, called waveform factor (WF), provides a running average of the electrocardio-
gram signal amplitude normalized by the R-wave amplitude. The WF for one beat is as follows:
|
N |
|
100 XabsðAnÞ |
WFi ¼ |
1 |
N absðArÞ |
where N is the total number of samples between the previous and current beat, An is the nth amplitude of the signal, and Ar is the peak. The algorithm uses an eight beat running average. The SVT rhythms would have a small WF value, while VT (which has a wide QRS complex on the surface of the body) would have a high WF value. This algorithm should not be used with patients who have bundle branch block, chronic or paroxysmal. The third feature is called amplitude variability analysis factor, which uses distribution of the average derivative. The measurement is found by calculating the number of derivatives which fall into the baseline bin as a percentage of the total number of sample points. Amplitude variability analysis (AVA) is calculated as follows:
P
AVA |
¼ |
|
100 nðiÞ |
|
N |
||||
|
|
where the summation is performed across the baseline bins and n(i) is the number of samples for the ith bin. The baseline bins are defined as 25% of the total bins centered
at n(i)max. Exact use of these features in the AED algorithm are not described.
Implantable Atrial Defibrillators
Implantable atrial defibrillators are used in patients with paroxysmal or persistent atrial fibrillation, particularly those which are symptomatic and drug refractory (140,141). Goals in atrial defibrillators are different than ICDs since atrial tachyarrhythmias are typically hemodynamically tolerable, therefore, more time and care can be used to make the decision. The challenge is that the device must sense low, variable amplitude atrial signals, while not sensing far-field ventricular waves. Furthermore, there are also multiple therapies available, antitachycardia pacing for atrial tachycardia, and cardioversion for atrial fibrillation. Lastly, some atrial defibrillators have been combined with ICDs such that back-up ventricular defibrillation therapy is available in this susceptible population (140,142).
A review of algorithms used in atrial defibrillators in given in Ref. 143. For example, Medtronic has a dualchamber defibrillator that has both atrial and ventricular therapies (140,142). The algorithm for detection uses the same algorithm as the dual-chamber ventricular (only) defibrillator, PR Logic. In addition to this algorithm, there are two zones used for detection of atrial tachycardia and of atrial fibrillation. If the zones overlap, AT is detected if it is regular and AF if it is irregular. The purpose of multiple zones is similar to ventricular devices, in that a variety of therapies can be selected and utilized for each zone. For this device, this includes pacing algorithms for prevention, pacing therapies for termination, and high voltage shocks.
CONCLUSION
This article focuses on the overall approaches used for automated arrhythmia detection. However, this review did not delve into the specifics of comparisons of sensitivity and specificity results for the various algorithms. While, each paper referenced gives performance for a specific test database, it is difficult to compare the results from one study to another. There have been some attempts to develop standardized datasets, including surface electrocardiograms from Physionet (including the MIT-BIH databases) (144) and American Heart Association (145), and intracardiac electrograms, in addition to surface, from Ann Arbor Electrogram Libraries (3). Use of these datasets allows for comparisons, but does not address the differences between performance at the system level that incorporates the hardware components of the specific device. A comprehensive description of the pitfalls in comparing results from one study to another is given in (43). These include limitations of (1) benchtesting that does not incorporate specific ICD-system differences and spontaneous arrhythmias, (2) limited storage in the ICD making gold standard clinical diagnosis difficult, (3) great variations in settings of rate based thresholds and zones, (4) variability of types of rhythms included in the study, among others.
In conclusion, examples from the long history of automated arrhythmia detection for implantable cardioverter defibrillators is given with a brief mention of automated external defibrillators and implantable atrial defibrillators. The ICDs are beginning to reach maturity in terms of addressing both sensitivity and specificity in performance of the algorithms to achieve close to perfect detection of life-threatening arrhythmias, with greatly reduced false therapies. In the meantime, automated external defibrillators and implantable atrial defibrillators have learned many lessons from the ICD experience to provide accurate arrhythmia diagnosis. Devices on the horizon incorporating automated arrhythmia detection may include wearable external defibrillators (146,147), wearable wireless monitors, and beyond. This rich area of devices that detect and treat life-threatening arrhythmias shall reduce the risk of sudden cardiac death.
BIBLIOGRAPHY
Cited References
1.American Heart Association. Heart Disease and Stroke Sta- tistics—2005 Update. American Heart Association. Available at http://www.americanheart.org. Accessed 2005.
2.Vilke GM, et al. The three-phase model of cardiac arrest as applied to ventricular fibrillation in a large, urban emergency medical services system. Resuscitation 2005;64:341–346.
3.Jenkins JM, Jenkins RE. Arrhythmia database for algorithm testing: surface leads plus intracardiac leads for validation. J Electrocardiol 2003;36(Suppl):157–1610. Available at http:// www.electrogram.com.
4.Nisam S, Barold S. Historical evolution of the automatic implantable cardioverter defibrillator in the treatment of malignant ventricular tachyarrhythmias. In: Alt E, Klein H,
ARRHYTHMIA ANALYSIS, AUTOMATED |
81 |
Griffin JC, editors. The implantable cardioverter/defibrillator. Berlin: Springer-Verlag; 1992. pt. 1, p 3–23.
5.Mower MM, Reid PR. Historical development of automatic implantable cardioverter-defibrillator. In: Naccarelli GV, Veltri EP, editors. Implantable Cardioverter-Defibrillators, Boston: Scientific Publications; 1993. Chapt. 2. p 15–25.
6.Mower MJ. Clinical and historical perspective. In: Singer I, editor. Implantable Cardioverter Defibrillator. Armonk (NY): Futura; 1994, Chapt. 1. p 3–12.
7.Bach SM, Shapland JE. Engineering aspects of implantable defibrillators. In: Saksena S, Goldschlager N, editors. Electrical Therapy for Cardiac Arrhythmias. Philadelphia: Saunders; 1990. Chapt. 18. p 371–383.
8.Kennedy HL. Ambulatory (Holter) Electrocardiography Technology. Cardiol Clin 1992;10:341–359.
9.Feldman CL, Amazeen PG, Klein MD, Lown B. Computer detection of ventricular ectopic beats. Comput Biomed Res 1970 Dec; 3(6):666–674.
10.Thomas LJ, et al. Automated Cardiac Dysrhythmia Analysis. Proc IEEE Sept 1979;67(9):1322–1337.
11.Collins SM, Arzbaecher RC. An efficient algorithm for waveform analysis using the correlation coefficient. Comput Biomed Res 1981 Aug; 14(4):381–389.
12.Hulting J, Nygards ME. Evaluation of a computer-based system for detecting ventricular arrhythmias. Acta Med Scand 1976;199(12):53–60.
13.Thakor NV. From Holter monitors to automatic defibrillators: developments in ambulatory arrhythmia monitoring. IEEE Trans Biomed Eng 1984 Dec; 31(12):770–778.
14.Feldman CL, Hubelbank M. Cardiovascular Monitoring in the Coronary Care Unit. Med Instrum 1977;11:288–292.
15.Hubelbank M, Feldman CL. A 60x computer-based Holter tape processing system. Med Instrum 1978;Nov–Dec; 12(6):324–326.
16.Govrin O, Sadeh D, Akselrod S, Abboud S. Cross-correlation technique for arrhythmia detection using PR and PP intervals. Comput Biomed Res 1985 Feb; 18(1):37–45.
17.Shah PM, et al. Automatic real time arrhythmia monitoring in the intensive coronary care unit. Am J Cardiol 1977 May 4; 39(5):701–708.
18.Lipschultz A. Computerized arrhythmia monitoring systems: a review. J Clin Eng 1982 Jul–Sep; 7(3):229–234.
19.Lin D, et al. Analysis of time and frequency domain patterns of endocardial electrograms to distinguish ventricular tachycardia from sinus rhythm. Comp Cardiol 1987; 171–174.
20.Knoebel SB, Lovelace DE, Rasmussen S, Wash SE. Computer detection of premature ventricular complexes: a modified approach. Am J Cardiol 1976 Oct; 38(4):440–447.
21.Yanowitz F, Kinias P, Rawling D, Fozzard HA. Accuracy of a continuous real-time ECG dysrhythmia monitoring system. Circulation. 1974 July; 50(1):65–72.
22.Mead CN, et al. A detection algorithm for multiform premature ventricular contractions. Med Instrum 1978;12:337–339.
23.Knoebel SB, Lovelace DE. A two-dimensional clustering technique for identification of multiform ventricular complexes. Med Instrum 1978;12:332–333.
24.Cheng QL, Lee HS, Thakor NV. ECG waveform analysis by significant point extraction. II. Pattern matching. Comput Biomed Res 1987 Oct; 20(5):428–442.
25.Spitz AL, Harrison DC. Automated family classification in ambulatory arrhythmia monitoring. Med Instrum 1978 Nov–Dec; 12(6):322–323.
26.Oliver GC, et al. Detection of premature ventricular contractions with a clinical system for monitoring electrocardiographic rhythms. Comput Biomed Res 1971 Oct; 4(5): 523–541.
27.Yanowitz F, Kinias P, Rawling D, Fozzard HA. Accuracy of a continuous real-time ECG dysrhythmia monitoring system. Circulation 1974 July; 50(1):65–72.
82ARRHYTHMIA ANALYSIS, AUTOMATED
28.Cooper DH, Kennedy HL, Lyyski DS, Sprague MK. Holter triage ambulatory ECG analysis. Accuracy and time efficiency. J Electrocardiol. 1996 Jan; 29(1):33–38.
29.Furman S, Fisher JK, Panizzo F. Necessity of signal processing in tachycardia detection. In: Barold SS, Mugica J, editors. The Third Decade of Cardiac Pacing: Advances in Technology and Clinical Applications. Mt Kisco (NY): Futura; 1982. Pt. 3, Chapt. 1. p 265–274.
30.Jenkins J, et al. Present state of industrial development of devices. PACE May–June 1984;7(II):557–568.
31.Mirowski M, Mower MM, Reid PR. The automatic implantable defibrillator. Am Heart J 1980;100:1089–1092.
32.Langer A, Heilman MS, Mower MM, Mirowski M. Considerations in the development of the automatic implantable defibrillator. Med Instrum May–June 1976;10:163–167.
33.Arzbaecher R. A pill electrode for the study of cardiac dysrhythmia. Med Instrum 1978;12:277–281.
34.Jenkins JM, Wu D, Arzbaecher R. Computer diagnosis of supraventricular and ventricular arrhythmias. Circulation 1979;60:977–987.
35.Paul VE, O’Nunain S, Malik M. Temporal electrogram analysis: algorithm development. PACE Dec. 1990;13:1943–1947.
36.Toivonen L, Viitasalo M, Jarvinen A. The performance of the probability density function in differentiating supraventricular from ventricular rhythms. PACE May 1992;15: 726–730.
37.DiCarlo L, et al. Tachycardia detection by antitachycardia devices: present limitations and future strategies. J Interven Cardiol 1994;7:459–472.
38.Pannizzo F, Mercando AD, Fisher JD, Furman S. Automatic methods for detection of tachyarrhythmias by antitachycardia devices. PACE Feb. 1988;11:308–316.
39.Lang DJ, Bach SM. Algorithms for fibrillation and tachyarrhythmia detection. J Electrocardiol 1990;23(Suppl):46– 50.
40.Olson WH. Tachyarrhythmia sensing and detection. In: Singer I, editor. Implantable Cardioverter Defibrillator. Armonk (NY): Futura; 1994. Chapt. 4. p 71–107.
41.Jenkins JM, Caswell SA. Detection algorithms in implantable defibrillators. Proc IEEE 1996;84:428–445.
42.Olson WH. Dual chamber sensing and detection for implantable cardioverter-defibrillators. In: Singer I, Barold SS, Camm AJ, editors. Nonpharmacological Therapy of Arrhythmias for the 21st century. Armonk (NY): Futura; 1998. p 385–421.
43.Aliot E, Mitzsche R, Ribart A. Arrhythmia detection by dualchamber implantable cardioverter defibrillators: a review of current algorithms. Europace 2004;6:273–286.
44.Thakor NV, Webster JG. Design and evaluation of QRS and noise detectors for ambulatory ECG monitors. Med Biol Eng Comput 1982;20:709–714.
45.Jalaleddine S, Hutchens C. Ambulatory ECG wave detection for automated analysis: a review. ISA Trans 1987;26(4): 33–43.
46.Warren JA, et al. Implantable cardioverter defibrillators. Proc IEEE 1996;84:468–479.
47.MacDonald R, Jenkins J, Arzbaecher R, Throne R. A software trigger for intracardiac waveform detection with automatic threshold adjustment. Proc Computers Cardiol IEEE 302766574 1990; 167–170.
48.Winkle RA, et al. Long-term outcome with the automatic implantable cardioverter-defibrillator. J Am Coll Cardiol May 1989;13:1353–1361.
49.Grimm W, Flores BF, Marchlinski FE. Electrocardiographically documented unnecessary, spontaneous shocks in 241 patients with implantable cardioverter defibrillators. PACE Nov. 1992;15:670–669.
50.Nunain SO, et al. Limitations and late complications of thirdgeneration automatic cardioverter-defibrillators. Circulation April 15 1995;91:2204–2213.
51.Warren J, Martin RO. Clinical evaluation of automatic tachycardia diagnosis by an implanted device. PACE 1986; 9:16.
52.Nathan AW, Creamer JE, Davies DW. Clinical experience with a new versatile, software based, tachycardia reversion pacemaker. J Am Coll Cardiol 1987;7:184A.
53.Olson W, Bardy G, Mehra R. Onset and stability for ventricular tachycardia detection in an implantable pacer-cardio- verter-defibrillator. Comp Cardiol 1987;34:167–170.
54.Tomaselli G, Scheinman M, Griffin J. The utility of timing algorithms for distinguishing ventricular from supraventricular tachycardias. PACE March–April 1987;10:415.
55.Geibel A, Zehender M, Brugada P. Changes in cycle length at the onset of sustained tachycardias-importance for antitachycardia pacing. Am Heart J March 1988;115:588– 592.
56.Ripley KL, Bump TE, Arzbaecher RC. Evaluation of techniques for recognition of ventricular arrhythmias by implanted devices. IEEE Trans Biomed Eng June 1989;36:618–624.
57.Pless BD, Sweeney MB. Discrimination of supraventricular tachycardia from sinus tachycardia of overlapping cycle length. PACE Nov–Dec 1984;7:1318–1324.
58.Arzbaecher R, et al. Automatic tachycardia recognition. PACE May–June 1984;7:541–547.
59.Jenkins JM, et al. Tachycardia detection in implantable antitachycardia devices. PACE Nov–Dec 1984;7:1273–1277.
60.Swerdlow CD, et al. Discrimination of ventricular tachycardia from sinus tachycardia and atrial fibrillation in a tieredtherapy cardioverter. J Am Coll Cardiol 1994;23:1342–1355.
61.Pannizzo F, Furman S. Pattern recognition for tachycardia detection: a comparison of methods. PACE July 1987;10:999.
62.Santel D, Mehra R, Olson W. Integrative algorithm for detection of ventricular tachyarrhythmias from the intracardiac electrogram. Comp Cardiol 1987; 175–177.
63.Lin D, DiCarlo LA, Jenkins JM. Identification of ventricular tachycardia using intracavity ventricular electrograms: analysis of time and frequency domain patterns. PACE Nov. 1988;1592–1606.
64.Tomaselli GF, et al. Morphologic differences of the endocardial electrogram in beats of sinus and ventricular origin. PACE Mar. 1988;11:254–262.
65.Langberg JL, Gibb WJ, Auslander DM, Griffin JC. Identification of ventricular tachycardia with use of the morphology of the endocardial electrogram. Circulation June 1988;77: 1363–1369.
66.Throne RD, Jenkins JM, Winston SA, DiCarlo LA. A comparison of four new time domain methods for discriminating monomorphic ventricular tachycardia from sinus rhythm using ventricular waveform morphology. IEEE Trans Biomed Eng June 1991;38:561–570. (U. S. Pat. No. 5,000,189 Mar. 19, 1991).
67.Steinhaus BM, et al. Detection of ventricular tachycardia using scanning correlation analysis. PACE Dec. 1990;13: 1930–1936.
68.Greenhut SE, et al. Separation of ventricular tachycardia from sinus rhythm using a practical, real-time template matching computer system. PACE Nov. 1992;15:2146–2153.
69.Gold MR, et al. Advanced rhythm discrimination for implantable cardioverter defibrillators using electrogram vector timing and correlation. J Cardiovasc Electrophysiol 2002; 13:1092–1097.
70.Swerdlow CD, et al. Discrimination of ventricular tachycardia from supraventricular tachycardia by a downloaded wavelet transform morphology algorithm. J Cardiovasc Electrophysiol 2002;13:432–441.
71.Duru F, et al. Morphology discriminator feature for enhanced ventricular tachycardia discrimination in implantable cardioverter defibrillators. PACE 2000;23:1365–1374.
72.Boriani G, et al. Clinical evaluation of morphology discrimination: an algorithm for rhythm discrimination in cardioverter defibrillators. PACE 2001;24:994–1001.
73.Throne RD, Jenkins JM, Winston SA, DiCarlo LA. Use of tachycardia templates for recognition of recurrent monomorphic ventricular tachycardia. Comp Cardiol 1989;171– 174.
74.Stevenson SA, Jenkins JM, DiCarlo LA. Analysis of the intraventricular electrogram for differentiation of distinct monomorphic ventricular arrhythmias. J Am Coll Cardiol (submitted June 1995;).
75.Paul VE, et al. Variability of the intracardiac electrogram: effect on specificity of tachycardia detection. PACE Dec. 1990;13:1925–1829.
76.Finelli CJ, et al. Intraventraventricular electrogram morphology: effect of increased heart rate with and without accompanying changes in sympathetic tone. Comp Cardiol 1990; 115–118.
77.Rosenheck S, Schmaltz S, Kadish AH, Morady F. Effect of rate augmentation and isoproterenol on the amplitude of atrial and ventricular electrograms. Am J Cardiol July 1 1990;66:101–102.
78.Belz MK, et al. The effect of left ventricular intracavitary volume on the unipolar electrogram. PACE Sept. 1993;16: 1842–1852.
79.Caswell SA, et al. Chronic bipolar electrograms are stable during changes in body position and activity: implications for antitachycardia devices. PACE April 1995;18:871.
80.Throne RD, Jenkins JM, Winston SA, DiCarlo LA. Paroxysmal bundle branch block of supraventricular origin: a possible source of misdiagnosis in detecting ventricular tachycardia using ventricular electrogram morphology. PACE April 1990;13:453–458.
81.Gilberg JM, Olson WH, Bardy GH, Mader SJ. Electrogram width algorithms for discrimination of supraventricular rhythm from ventricular tachycardia. PACE April 1994;17:866.
82.Unterberg C, et al. Long-term clinical experience with the EGM width detection criteria for differentiation of supraventricular and ventricular tachycardia in patients with implantable cardioverter defibrillators. PACE 2000;23: 1611–1617.
83.Kingenheben T, Sticherling C, Skupin M, Hohnloser SH. Intracardiac QRS electrogram width—an arrhythmia detection feature for implantable cardioverter defibrillators: exercise induced variation as a base for device programming. PACE 1998;21:1609–1617.
84.Favale S, et al. Electrogram width parameter analysis in implantable cardioverter defibrillators: influence of body position and electrode configuration. PACE 2001;24:1732–1738.
85.Leitch JW, et al. Correlation between the ventricular electrogram amplitude in sinus rhythm and in ventricular fibrillation. PACE Sept. 1990;13:1105–1109.
86.Ellenbogen KA, et al. Measurement of ventricular electrogram amplitude during intraoperative induction of ventricular tachyarrhythmias. Am J Cardiol Oct. 15 1992;70:1017–1022.
87.Pannizzo F, Furman S. Frequency spectra of ventricular tachycardia and sinus rhythm in human intracardiac electrograms: application to tachycardia detection for cardiac pacemakers. IEEE Trans Biomed Eng June 1988; 421–425.
88.Slocum J, Sahakian A, Swiryn S. Computer discrimination of atrial fibrillation and regular atrial rhythms from intra-atrial electrograms. PACE May 1988;11:610–621.
89.Aubert AE, et al. Frequency analysis of VF episodes during AICD implantation. PACE June 1988;11(Suppl):891.
ARRHYTHMIA ANALYSIS, AUTOMATED |
83 |
90.Lovett EG, Ropella KM. Autoregressive spread-spectral analysis of intracardiac electrograms: comparison of Fourier analysis. Comp Cardiol 1992; 503–506.
91.Minami K, Nakajima H, Toyoshima T. Real-time discrimination of ventricular tachyarrhythmia with Fourier-transform neural network. IEEE Trans Biomed Eng 1999;46:179– 185.
92.Yan MC, Jenkins JM, DiCarlo LA. Feasibility of arrhythmia recognition by antitachycardia devices using time-frequency analysis with neural network classification. PACE 1995;18: 871.
93.Farrugia S, Yee H, Nickolls P. Implantable cardioverter defibrillator electrogram recognition with a multilayer perceptron. PACE Jan. 1993;16:228–234.
94.Leong PH, Jabri MA. MATIC-An intracardiac tachycardia classification system. PACE Sept. 1982;15:1317–1331.
95.Rojo-Alvarez JL, et al. Automatic discrimination between supraventricular and ventricular tachycardia using a multilayer perceptron in implantable cardioverter defibrillators. PACE 2002;25:1599–1604.
96.Wang Y, et al. A short-time multifractal approach for arrhythmia detection based on fuzzy neural network. IEEE Trans Biomed Eng 2001;48:989–995.
97.Al-Fahoum AS, Howitt I. Combined wavelet transformation and radial basis neural networks for classifying life-threatening cardiac arrhythmias. Med Biol Eng Comp 1999;27: 566–573.
98.Arzbaecher R, et al. Automatic tachycardia recognition. PACE May–June 1984;7:541–547.
99.Jenkins JM, et al. Tachycardia detection in implantable antitachycardia devices. PACE Nov–Dec 1984;7:1273– 1277.
100.Schuger CD, Jackson K, Steinman RT, Lehmann MH. Atrial sensing to augment ventricular tachycardia detection by the automatic implantable cardioverter defibrillator: a utility study. PACE Oct. 1988;11:1456–1463.
101.Caswell SA, DiCarlo LA, Chiang CJ, Jenkins JM. Automated analysis of spontaneously occurring arrhythmias by implantable devices: limitation of using rate and timing features alone. J Electrocardiol 1994;27(Suppl):151–156.
102.Chiang CJ, Jenkins JM, DiCarlo LA. Discrimination of ventricular tachycardia from sinus tachycardia by antitachycardia devices: value of median filtering. Med Engr Phys Nov. 1994;16:513–517.
103.Chiang CJ, Jenkins JM, DiCarlo LA. The value of rate regularity and multiplicity measures to detect ventricular tachycardia in atrial fibrillation of flutter with a fast ventricular response. PACE Sept. 1994;17:1503–1508.
104.Hintringer F, Schwarzacher S, Eibl G, Pachinger O. Inappropriate detection of supraventricular arrhythmias by implantable dual chamber defibrillators: a comparison of four different algorithms. PACE 2001;24:835–841.
105.Hintringer F, et al. Comparison of the specificity of implantable dual chamber defibrillator detection algorithms. PACE 2004;27:976–982.
106.Lavergne T, et al. Preliminary clinical experience with the first dual chamber pacemaker defibrillator. PACE 1997;20: 182–188.
107.Mletzko R, et al. Enhanced specificity of a dual chamber ICD arrhythmia detection algorithm by rate stability criteria. PACE 2004;27:1113–1119.
108.Bailin SJ, et al. Clinical investigation of a new dual-chamber implantable cardioverter defibrillator with improved rhythm discrimination capabilities. J Cardiovasc Electrophysiol 2003;14:144–149.
109.Chiang CJ, et al. Real-time arrhythmia identification from automated analysis of intraatrial and intraventricular electrograms. PACE Jan. 1993;16:223–227.
84 ARRHYTHMIA ANALYSIS, AUTOMATED
110.Caswell SA, et al. Pattern recognition of cardiac arrhythmias using two intracardiac channels. Comp Cardiol 1993; 181–184.
111.DiCarlo LA, Lin D, Jenkins JM. Automated interpretation of cardiac arrhythmias. J Electrocardiol Jan. 1993;26:53–67.
112.Amikan S, Furman S. A comparison of antegrade and retrograde atrial depolarization in the electrogram. PACE May 1983;6:A111.
113.Wainwright R, Davies W, Tooley M. Ideal atrial lead positioning to detect retrograde atrial depolarization by digitization and slope analysis of the atrial electrogram. PACE Nov–Dec. 1984;7:1152–1157.
114.Davies DW, Wainwright RJ, Tooley MA. Detection of pathological tachycardia by analysis of electrogram morphology. PACE March–April 1986;9:200–208.
115.McAlister HF, et al. Atrial electrogram analysis: antegrade versus retrograde. PACE Nov. 1988;11:1703–1707.
116.Throne RD, et al. Discrimination of retrograde from anterograde atrial activation using intracardiac electrogram waveform analysis. PACE Oct. 1989;12:1622–1630.
117.Saba S, et al. Use of correlation waveform analysis in discrmination between anterograde and retrograde atrial electrograms during ventricular tachycardia. J Cardiovasc Electrophysiol 2001;12:145–149.
118.Strauss D, Jung J, Rieder A, Manoli Y. Classification of endocardial electrograms using adapted wavelet packets and neural networks. Ann Biomed Eng 2001;29:483–492.
119.DiCarlo LA, et al. Impact of varying electrogram amplitude sensing threshold upon the performance of rate algorithms for ventricular fibrillation detection. Circulation Oct. 1994;90:I–176.
120.Caswell SA, et al. Ventricular tachycardia versus ventricular fibrillation: Discrimination by antitachycardia devices. J Electrocardiol 1996;28:29.
121.Wathen MS, et al. PainFREE Rx II Investigators. Prospective randomized multicenter trial of empirical antitachycardia pacing versus shocks for spontaneous rapid ventricular tachycardia in patients with implantable cardioverterdefibrillators: Pacing Fast Ventricular Tachycardia Reduces Shock Therapies (PainFREE Rx II) trial results. Circulation 2004;110:2591–2596.
122.Jenkins JM, Kriegler C, DiCarlo LA. Discrimination of ventricular tachycardia from ventricular fibrillation using intracardiac electrogram analysis. PACE April 1991;14:718.
123.DiCarlo LA, Jenkins JM, Winston SA, Kriegler C. Differentiaion of ventricular tachycardia from ventricular fibrillation using intraventricular electrogram morphology. Am J Cardiol Sept. 15 1992;70:820–822.
124.Jenkins JM, Caswell SA, Yan MC, DiCarlo LA. Is waveform analysis a viable consideration for implantable devices given its computational demand? Comp Cardiol 1993; 839–842.
125.Throne RD, et al. Scatter diagram analysis: a new technique for discriminating ventricular tachyarrhythmias. PACE July 1994;17:1267–1275.
126.Ropella KM, Baerman JM, Sahakian AV, Swiryn S. Differentiation of ventricular tachyarrhythmias. Circulation Dec. 1990;82:2035–2043.
127.Caswell SA, Jenkins JM, DiCarlo LA. Comprehensive scheme for detection of ventricular fibrillation for implantable cardioverter defibrillators. J Electrocardiol 1998;30: 131–136.
128.Schuckers SA. Use of approximate entropy measurements to classify ventricular tachycardia and fibrillation. J Electrocardiol 1998;31(Suppl):101–105.
129.Zhang HX, Zhu YX, Wang ZM. Complexity measure and complexity rate information based detection of ventricular tachycardia and fibrillation. Med Biol Eng Comp 2000;38: 553–557.
130.Chen SW. A two-stage discrmination of cardiac arrhythmias using a total least squares-based prony modeling algorithm. IEEE Trans Biomed Eng 2000;47:1317–1327.
131.American Heart Assocation. Emergency Cardiac Care Committee and Subcommittees. Guidelines for cardiopulmonary resuscitation and emergency cardiac care. JAMA 1992;268: 2171–2302.
132.Aronson AL, Haggar B. The automatic external defibrillatorpacemaker: clinical rationale and engineering design. Med Instrum 1986;20:27–35.
133.Charbonnier FM. External defibrillators and emergency external pacemekers. Proc IEEE 1996;84:487–499.
134.Weisfeldt ML, et al. American Heart Association Report on the Public Access Defibrillation Conference December 8–10, 1994. Automatic External Defibrillation Task Force. Circulation 1995;92:2740–2747.
135.Dimmit MA, Griffiths SE. What’s new in prehospital care? Nursing 1992;22:58–61.
136.Association for the Advancement of Medical Instrumentation. Automatic external defibrillators and remote-control defibrillators [American National Standard]. AAMI 1993; ANSI/AAMI DF39-1993.
137.American Heart Association. AED Task Force, Subcommittee on Safety and Efficacy. Automatic External Defibrillators for Public Access Use: Recommendations for Specifying and Reporting Arrhythmia Analysis Algorithm Performance, Incorporating new Waveforms, and Enhancing Safety. AHA 1996.
138.Charbonnier FM. Algorithms for arrhythmia analysis in AEDs. In: Tacker WA Jr, editor. Defibrillation of the Heart: ICDs, AEDs and Manual. St Louis (MO): Mosby/Yearbook; 1994.
139.Mattioni T, et al. Performance of an automatic external cardioverter-defibrillator algorithm in discrimination of supraventricular from ventricular tachycardia. Am J Cardiol 2003;91:1323–1326.
140.Sopher SM, Camm AJ. Atrial defibrillators. In: Singer I,
Barold SS, Camm AJ, editors. Nonpharmacological Therapy of Arrhythmias for the 21st century. Armonk (NY): Futura; 1998. p 473–489.
141.Gold MR, et al. Clinical experience with a dual-chamber implantable cardioverter defibrillator to treat atrial tachyarrhythmias. J Cardiovasc Electrophysiol 2001;12: 1247–1253.
142.Swerdlow CD, et al. Detection of atrial fibrillation and flutter by a dual-chamber implantable cardioverter-defibrillator. Circulation 2000;101:878–885.
143.KenKnight BH, Lang DJ, Scheiner A, Cooper RAS. Atrial defibrillation for implantable cardioverter-defibrillators: lead systems, waveforms, detection algorithms, and results. In:
Singer I, Barold SS, Camm AJ, editors. Nonpharmacological Therapy of Arrhythmias for the 21st century. Armonk (NY): Futura; 1998. p 457–471.
144.Costa M, Moody GB, Henry I, Goldberger AL. PhysioNet: an NIH research resource for complex signals. J Electrocardiol 2003;36(Suppl) 139–144. Available at http://www. physionet.org.
145.American Heart Association ECG Database, Available from ECRI, 5200 Butler Pike, Plymouth Meeting, PA 19462 USA, http://www.ecri.org/.
146.Reek S, et al. Clinical efficacy of a wearable defibrillator in acutely terminating episodes of ventricular fibrillation using biphasic shocks. PACE 2003;26:2016–2022.
147.Feldman AM, et al. Use of a wearable defibrillator in terminating tachyarrhythmias in patients at high risk for sudden death: results of WEARIT/BIROAD. PACE 2004;27:4–9.
See also AMBULATORY MONITORING; DEFIBRILLATORS; ELECTROCARDIOGRAPHY, COMPUTERS IN; EXERCISE STRESS TESTING.