

Laser-Tissue Interactions Fundamentals and Applications - Markolf H. Niemz
.pdf88 3. Interaction Mechanisms
3.3 Photoablation
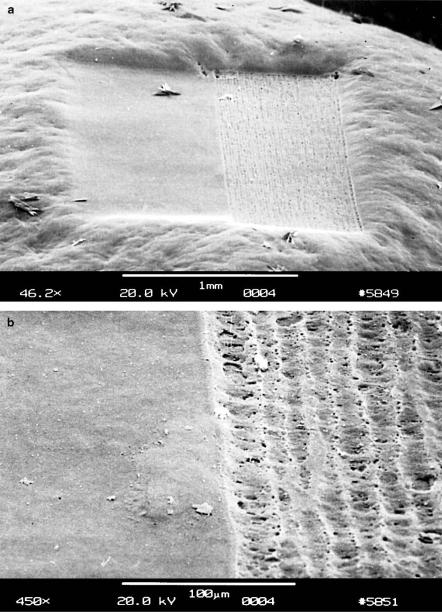
In Fig. 3.30, the cross-section of a cornea is shown which was exposed to an ArF excimer laser. The removal of tissue was performed in a very clean and exact fashion without any appearance of thermal damage such as coagulation or vaporization. Instead, evidence is given that the tissue was very precisely “etched”. This kind of UV light-induced ablation is called photoablation and will be discussed in this section.
Fig. 3.30. Photoablation of corneal tissue achieved with an ArF excimer laser (pulse duration: 14ns, energy density: 180mJ/cm2, bar: 100μm). Photograph kindly provided by Dr. Bende (T¨ubingen)
Photoablation was first discovered by Srinivasan and Mayne-Banton (1982). They identified it as ablative photodecomposition, meaning that material is decomposed when exposed to high intense laser irradiation. Typical threshold values of this type of interaction are 107–108 W/cm2 at laser pulse durations in the nanosecond range. The ablation depth, i.e. the depth of tissue removal per pulse, is determined by the pulse energy up to a certain saturation limit. The geometry of the ablation pattern itself is defined by the spatial parameters of the laser beam. The main advantages of this ablation technique lie in the precision of the etching process as demonstrated in Fig. 3.30, its excellent predictability, and the lack of thermal damage to adjacent tissue.

3.3 Photoablation |
89 |
First studies regarding ablative photodecomposition were performed with polymethyl-metacrylate (PMMA), polyimide, Teflon, and other synthetic organic polymers7. Soon after, biological tissues were also ablated. Today, photoablation is one of the most successful techniques for refractive corneal surgery, where the refractive power of the cornea is altered in myopia, hyperopia, or astigmatism (see Sect. 4.1). In this section, for the sake of simplicity, we will follow the explanations given by Garrison and Srinivasan (1985) in the case of synthetic polymer targets. Due to the homogeneity of these materials, their behavior under certain experimental conditions is easier to understand. Thus, experimental data on the ablative process are very reliable and theoretical modeling is strongly facilitated. However, most of the theory applies for the more inhomogeneous biological tissues, as well.
Organic polymers are made up of large molecules consisting of more than 103 atoms, mainly carbon, hydrogen, oxygen, and nitrogen. A smaller molecular unit of up to 50 atoms is called a monomer. It is repeated several times along a well-defined axis to form the polymer chain. In Figs. 3.31a–b, the basic chemical structures of the most popular polymers – PMMA and polyimide – are illustrated.
Fig. 3.31. (a) Chemical structure of four monomers of PMMA. (b) Chemical structure of one monomer of polyimide
7In the field of material processing, especially in the manufacture of miniaturized surface structures, photoablation by means of excimer lasers has meanwhile become a well-established technique.

90 3. Interaction Mechanisms
For PMMA, the temporal progress of photoablation was modeled by Garrison and Srinivasan (1985) using Newton’s equation of motion. The polymer is described by structureless monomer units held together by strong attractive forces. The interaction with laser radiation is simulated by allowing each monomer unit to undergo excitation directly from an attractive to a repulsive state. This promotion is associated with a change in volume occupied by each monomer, leading to a transfer of momentum and, thus, to the process of ablation. For the sake of simplicity, a face-centered cubic (fcc) crystalline array is assumed. With a density of 1.22g/cm3 and a monomer mass of 100amu, a lattice constant of 0.81nm is calculated. The main attractive forces holding the monomer units together are the two carbon–carbon bonds along the chain. The strength of such a C–C bond is approximately 3.6eV (see Table 3.8). The basic repulsive term is proportional to 1/r12, where r denotes a mean distance of two monomers. With these assumptions, the process of photoablation was simulated as shown in Fig. 3.32.
Fig. 3.32. Computer simulation of photoablation showing the movement of PMMA monomers as a function of time. Reproduced from Garrison and Srinivasan (1985) by permission. c 1985 American Institute of Physics

3.3 Photoablation |
91 |
The character of the bonds within an organic polymer is primarily covalent. In order to obtain a physical explanation of the photoablation process, let us assume that two atoms A and B are bound by a common electron. The corresponding energy level diagram of the ground and several excited states is shown in Fig. 3.33. Due to the macromolecular structure, each electronic level is split into further vibrational states. Absorption of a photon may promote the two atoms to an excited state (AB) . Usually, the excitation is achieved by satisfying the Franck–Condon principle. It states that the radial distance of the two nuclei of the atoms A and B will not be a ected during the process of excitation due to the small electron mass. Thus, transitions characterized by a vertical line in the energy level diagram are favored as indicated in Fig. 3.33. The probability of such a transition is increased if the maxima of the corresponding Schr¨odinger functions of the initial and final states coincide at the same radial distance.
Fig. 3.33. Energy level diagram for photoablation
If a UV photon is absorbed, the energy gain is usually high enough to access an electronic state which exceeds the bond energy. In this case, the two atoms A and B may dissociate at the very next vibration. Thus, photoablation can be summarized as a two-step process:
• |
excitation: |
AB + hν −→ (AB) , |
• |
dissociation: |
(AB) −→ A + B + Ekin . |
The dissociation energies of some typical chemical bonds are listed in Table 3.8. Moreover, the wavelengths and the corresponding photon energies of selected laser systems are given in Table 3.9. When comparing both tables,

92 3. Interaction Mechanisms
Table 3.8. Dissociation energies of selected chemical bonds. Data according to Pauling (1962)
Type of bond |
Dissociation energy (eV) |
|
|
C=O |
7.1 |
C=C |
6.4 |
O−H |
4.8 |
N−H |
4.1 |
C−O |
3.6 |
C−C |
3.6 |
S−H |
3.5 |
C−N |
3.0 |
C−S |
2.7 |
|
|
Table 3.9. Wavelengths and photon energies of selected laser systems
Laser type |
Wavelength (nm) |
Photon energy (eV) |
|
|
|
ArF |
193 |
6.4 |
KrF |
248 |
5.0 |
Nd:YLF (4ω) |
263 |
4.7 |
XeCl |
308 |
4.0 |
XeF |
351 |
3.5 |
Argon ion |
514 |
2.4 |
Nd:YLF (2ω) |
526.5 |
2.4 |
He-Ne |
633 |
2.0 |
Diode |
800 |
1.6 |
Nd:YLF |
1053 |
1.2 |
Nd:YAG |
1064 |
1.2 |
Ho:YAG |
2120 |
0.6 |
Er:YAG |
2940 |
0.4 |
CO2 |
10600 |
0.1 |
|
|
|
we find that only photons from UV lasers – typically excimer lasers – provide an energy su cient for dissociating such bonds. Therefore, the interaction mechanism of photoablation is limited to the application of UV light.
The ejected photoproducts of excimer laser ablation have been analyzed in several studies, e.g. by Srinivasan and Mayne-Banton (1982) and Brannon et al. (1985). Usually, a mixture of single atoms (C, N, H, O), molecules (C2, CN, CH, CO), and stable fragments (MMA-monomer, HCN, benzene) were detected. It is interesting to add that the product composition was found to be wavelength-dependent. Srinivasan et al. (1986b) found that radiation at 248nm generates fragments of a higher molecular weight than does 193nm radiation. Thus, the corresponding etched surface at 248nm is rougher and less predictable than at 193nm.

3.3 Photoablation |
93 |
Moreover, it was observed that a certain threshold intensity must be applied to achieve photoablation. Above this intensity, a well-defined depth is ablated, depending on the absorption coe cient and the incident intensity. At the same time, an audible report is heard and visible fluorescence is observed at the impact site. If the incident intensity is moderate and such that the ablation depth is smaller than the corresponding optical absorption length, subsequent pulses will enter partially irradiated tissue as well as unexposed tissue underlying it. Therefore, only the first few pulses are unique. After these, a linear relation between the number of applied pulses and the total etch depth is obtained. In practice, the etch depths are averaged over several pulses and noted as ablation depth per pulse. This value is reproducible within an uncertainty of about 10% for most materials which is an excellent value when taking all the inhomogeneities of tissue into account. The physical principles of photoablation are summarized in Table 3.10.
Table 3.10. Principles of photoablation
Absorption of high-energy UV photons
Promotion to repulsive excited states
Dissociation
Ejection of fragments (no necrosis)
Ablation
We stated above that photoablation is a process which is restricted to the application of UV light. However, it is not limited to excimer lasers, since generating higher harmonics of other laser types can result in UV radiation, as well. The 4th harmonic of a solid-state laser, for instance, also induces photoablation as reported by Niemz et al. (1994b). In Figs. 3.34a–b and 3.35a–b, a sample of corneal tissue is shown which was partially exposed to either the second or the fourth harmonic of a Nd:YLF laser. In both cases, the pulse duration at the fundamental wavelength was set to 30ps. The higher harmonics were induced by means of two BBO crystals. The pulse energies were approximately 150μJ in the green and 20μJ in the UV, respectively. The laser beam was scanned over the surface within a 1×1mm2 pattern. Whereas distinct impact sites of the focused laser beam are clearly visible in the section exposed to the second harmonic, a clean and homogeneous layer is ablated with the fourth harmonic. Only the latter belongs to the group of photoablation, whereas the other e ect is attributed to plasma-induced ablation which will be discussed in Sect. 3.4.
94 3. Interaction Mechanisms
Fig. 3.34. (a) Human cornea exposed to the second (right) and fourth (left) harmonics of a Nd:YLF laser, respectively (pulse duration: 30ps). (b) Enlargement of the boundary with the adjacent zones

3.3 Photoablation |
95 |
Fig. 3.35. (a) Human cornea exposed to the second and fourth harmonics of a Nd:YLF laser, respectively (left). Enlargement of area exposed to the second harmonic (right). (b) Same view (left). Enlargement of area exposed to the fourth harmonic (right)

96 3. Interaction Mechanisms
3.3.1 Model of Photoablation
In order to come up with a model which describes the dependence of ablated depth on incident laser intensity, most research groups – such as Srinivasan and Mayne-Banton (1982), Andrew et al. (1983), Deutsch and Geis (1983), Garrison and Srinivasan (1985) – based their assumptions on the validity of Lambert’s law of light absorption given by8
I(z) = I0 exp(−αz) , |
(3.20) |
where z denotes the optical axis, I0 is the incident laser intensity, and α is the absorption coe cient of the tissue. To evaluate the decrease in intensity, (3.20) has to be di erentiated with respect to z which leads to
− |
∂I |
= αI(z) . |
(3.21) |
∂z |
Photoablation will take place only as long as the left side in (3.21) does not drop below a certain threshold value αIph, i.e.
αI(z) ≥ αIph ,
where Iph is the threshold intensity of photoablation. This condition requires that a certain amount of energy must be absorbed per unit volume and time to achieve photoablation. The threshold intensity Iph is determined by the minimal number of bonds that have to be dissociated to yield decomposition. We thus obtain
I0 exp(−αz) ≥ Iph .
The ablation depth d, i.e. the depth at which I(z) = Iph, should then be
d = |
1 |
ln |
I0 |
|
2.3 |
log10 |
I0 |
. |
(3.22) |
α |
I |
α |
|
||||||
|
|
|
|
I |
|
||||
|
|
|
ph |
|
|
|
ph |
|
|
This simple model describes photoablation very well, except for the threshold Iph at the onset of photoablation and the threshold Ipl at the onset of plasma generation. The ablation curve of rabbit cornea is shown in Fig. 3.36 in a single-logarithmic plot. Usually, the ablation depth per pulse is given as a function of the incident energy density E0, where E0 = I0τ and τ is the pulse duration. The logarithmic dependence, i.e. the central and linear part in Fig. 3.36, is in good agreement with theoretical predictions based on (3.22). This section of the ablation curve is observed in almost any kind of tissue. However, the threshold Iph is not as sharp as predicted by (3.22), i.e. the slope of the curve approaches zero when intercepting with the abscissa. This result most probably stems from the inhomogeneity in fragment
8For a complete mathematical description of photoablation, the temporal shape of the applied laser pulses should also be taken into account. Further details are found in the paper by Srinivasan (1986a).

3.3 Photoablation |
97 |
sizes. The threshold varies around an average value <Iph> according to the size of the ablated fragment. Imagine that such a fragment was bound to several molecules prior to ablation. As soon as a certain ratio of dissociated molecules is reached, the fragment will be released. Because larger fragments have a smaller “surface” compared to their “volume”, the threshold Iph will decrease with increasing size of the ablated fragment. Consequently, averaging of various fragment sizes leads to a smooth intercept with the abscissa.
Fig. 3.36. Ablation curve of rabbit cornea obtained with an ArF excimer laser (pulse duration: 14ns). Data according to Fantes and Waring (1989)
Above a second threshold Ipl – the threshold of plasma generation – the ablation depth per pulse obviously saturates as shown in Fig. 3.36. This e ect stems from a well-known phenomenon called plasma shielding. Once a plasma is ignited at high power densities due to the generation of a high electric field, most of the succeeding laser radiation is absorbed by the plasma, thereby heating it up and leading to additional thermal e ects. All abundant energy thus dissipates to heat and does not contribute to a further increase in ablation depth. Therefore, the ablation curve saturates at high energy densities. The absorption coe cient αpl of the induced plasma is significantly higher than the original absorption coe cient α of the tissue as will be evaluated in Sect. 3.4. Hence, (3.20)–(3.22) are no longer valid. For a detailed discussion of plasma parameters and plasma shielding, the reader is referred to Sect. 3.4.
In the 1980s, the question was raised whether photoablation is based on a photochemical or a photothermal process. This discussion has led to