


page 67
|
lubrication |
roughing |
|
|
|
tool wear |
|
||||||||||||||||
|
|
|
|
|
|
|
tool angle |
|
location |
|
|||||||||||||
|
|
|
|
|
|
|
|
|
|
|
|
|
|
|
|
|
|
||||||
cutting |
|
|
|
|
speed |
|
|
|
|
|
|
|
|
|
|
|
|||||||
|
|
|
|
|
|
|
|
|
|
|
|
|
|||||||||||
psi |
|
|
|
|
|
|
|
|
|
|
|
|
|
|
|
|
|
|
|
|
|||
|
|
|
|
|
|
|
|
|
|
|
|
|
|
|
|
|
|
|
|
||||
|
|
|
|
|
|
|
|
|
|
|
|
|
|
|
|
|
|
|
|
|
|
|
|
|
|
|
|
|
|
Bore |
|
|
|
|
Counter Sink |
|
|
Chamfer |
|
|
Unload |
||||||
|
|
|
|
|
|
|
|
|
|
|
|
|
|||||||||||
|
|
|
|
|
|
|
|
|
|
|
|
|
|
|
|
|
|
|
|
|
|
|
|
setup |
|
|
|
|
|
|
|
|
|
|
|
|
tool |
|
|
|
|
|
|||||
|
|
|
wear |
|
|
|
|
|
|
|
wear |
|
|
|
|
|
|||||||
|
|
|
|
|
|
|
|
|
|
|
|
|
|
|
|
speed |
|
||||||
|
|
|
|
|
|
|
|
|
|
|
|
|
|
|
|
|
|
|
|||||
|
|
|
|
|
|
|
|
|
|
|
|
|
|
|
|
|
|
|
|
|
|||
centering |
centering |
check |
|
|
|
|
|
||||||||||||||||
|
|
|
|
|
|
|
|
|
|
|
|
|
|
|
|
|
|
|
|
|
|||
• When considering CAUSES, there are two main types, assignable and chance. chance - normal, or natural variations that occur in a system (e.g. dice)
assignable - controllable parameters such as material, process parameters, operator skill, etc.
6.2 PARETO DIAGRAM
•After the CE diagram is constructed we can start to trace the cause of problems.
•Assume
1.We have collected data from defects on the factory floor.
2.We have identified the causes of each of the defects (could also use problems, type of problems, etc)
e.g. bad photocopies
Frequency |
Defect |
|
|
|
|
12 |
Paper Jam |
|
1 |
Toner falls off |
|
5 |
too light |
|
3 |
Others |
|
page 68
3. We can rank the list)
e.g. bad photocopies
Frequency |
Defect |
|
|
|
|
12 |
Paper Jam |
|
5 |
Too light |
|
1 |
toner falls off |
|
3 |
Others |
|
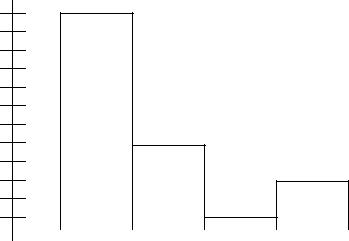
4. Draw the graph (** This is a Pareto diagram)
12
freq.
5
3
1
|
|
|
ne |
|
othe |
paper |
too |
|
|||
|
|
|
t |
|
|
|
|
light |
o |
|
r |
|
jam |
|
|
||
|
all |
||||
|
|
|
r |
|
s |
|
|
|
f |
|
|
|
|
|
|
s |
|
|
|
|
|
o |
|
|
|
|
|
f |
|
|
|
|
|
f |
|
5. Tackle the problem on the left first. Paper jams are the most significant problem that comes up.
6.3 MATRIX ANALYSIS
• It is also possible to use the concept in the Pareto Diagram, in a setting with multiple processes.
1. Take data concerning quality.