

page 23
4. INSPECTION FOR QUALITY
4.1 ACCEPTANCE OF LOTS
•What ? screening of arriving product lots to ensure adequate quality for use
•Why? Because putting parts into production when they are out of spec. will probably result in out of spec. product. This will cost much more.
•Advantages,
-focuses quality problems on source
-reduces inspection required
-can use destructive testing
-rejection of entire lots increases supplier quality incentives
-uses known risks and probabilities
•Disadvantages,
-good/bad lots may be rejected/accepted without reason
-planning and documentation required
-only describes part of a lot
4.2 SCREENING
•When every part in an incoming lot is checked, this is called screening.
•The non-conforming parts can be removed, and replaced with good parts
•Screened lots can be mixed with good lots to improve the AOQ
page 24
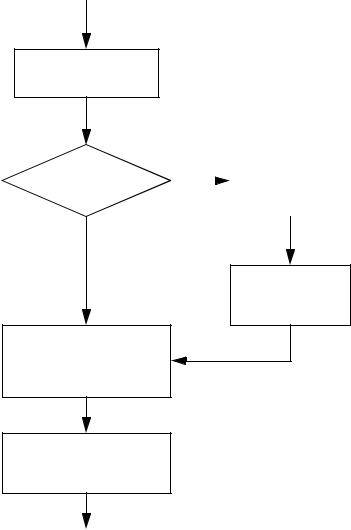
batches from producer
inspection by customer
|
no |
|
100% |
is lot accepted? |
|
|
inspection |
|
|||
|
|
|
|
yes
replace defects with good parts
mix into storage
select lots from mixed bins
good lots go into production
4.3 THE COST OF SAMPLING
• A simplified economic comparison of inspection versus screening can be made with the following method,
page 25
CI = nCIn + ( N – n) pCD
where,
CI = the total inspection cost
CIn = the cost to inspect each individual part
CD = the average cost resulting from each defective part
p = the proportion of defective parts
n = the number of parts inasmple
N = the number of parts inalot
Consider that for 100% inspection, n=N. Therefore, when choosing between screening, or sampling, consider the break even point detailed below. If the equation given is not true, then 100% inspection should be used, otherwise, sampling may be a better plan.
cost 100% > cost sample (for sampling type inspection)
NCIN + ( N – N) pCD > nCIn + ( N – n) pCD
|
NCIn |
– NpCD > |
nCIn – npCD |
|
|
N( CI |
– CD) |
n |
|
|
|
n |
||
----------------------------- > |
||||
|
( CIn |
– pCD) |
|
|
page 26
For example: a defective gear costs an automotive manufacturer $350 to replace once a vehicle is in service, and is costs $2.25 per gear to inspect it. It is known that one in a thousand gears will be defective, what inspection policy should be used if the parts arrive in batches of 10,000?
here,
CIn |
= $2.25 |
|
|
|
|
|
CD = 350 |
|
|
|
|
|
|
|
1 |
|
|
|
|
|
p = |
1000----------- = 0.001 |
|
|
|
||
N = 10000 |
|
|
|
|
|
|
|
N( CIn |
– CD) |
|
10000( 2.25 – 350) |
|
|
|
n < -----------------------------( C |
– pC ) |
= |
(------------------------------------------------2.25 – 0.001( 350) ) |
= |
|
|
|
In |
D |
|
|
|
Therefore, as a result we should XXXXXXXXXXXX
4.4 SINGLE/DOUBLE/MULTIPLE SAMPLED PLANS
•SINGLE - just take a sample from the lot, examine, and reject. e.g. a lot of 5000 has 200 samples removed, if more than 2 non-conforming samples found, the lot is sent back.
•DOUBLE - One sample is taken. If it conforms, keep the lot. If there are too many non-conform- ing send back the lot, otherwise take a second sample. If the combined first and second samples have too many rejects, then send the lot back.
•MULTIPLE - like the double sampled plan, but extended for a larger number of tests.
•the accept/retest/reject limits are set by statistical methods.
•Lot Sample Selection, must be as random as possible,
-use a random number generator,
-use a paper based method (e.g. pg. 288 in text)