

Metal-Catalysed Reactions of Hydrocarbons / 03-Chemisorption and Reactions of Hydrogen
.pdfCHEMISORPTION AND REACTIONS OF HYDROGEN |
113 |
Figure 3.12. Isobar and isotherms for chemisorption of hydrogen on supported platinum catalysts.122,126,135,136 The left-hand part shows the variation in the amount adsorbed (expressed as H/Pts ) at a fixed pressure, and the right-hand part the corresponding variations with pressure at fixed temperature (see text for full description).
within the adsorbed layer may cause the heat of adsorption to vary; in some cases, at higher coverages, different sites to those occupied at low coverage will be favoured by the whole adlayer (Figure 3.10). During desorption, as the coverage falls, reverse site-switching may occur, and the interactions will decrease; both effects lead to structure in the TPD spectrum even from a fcc(111) single-crystal surface. TPD does not necessarily resolve every state identified by LEED, as in some cases the adsorption energies are not sufficiently different: the techniques can however with suitable calibration provide estimates of the number of atoms in each resolvable state. Inherent heterogeneity as with stepped surfaces will create extra desorption peaks.
Kinetic analysis of desorption is fairly straightforward where only a single state of uniform energy (i.e., obeying the Langmuir equation) exists. The rate is given by
−dθH/dt = kθHx |
(3.7) |
where x is the order of reaction (usually x = 2 for desorption of H atoms, but sometimes 1) and by analogy with the Arrhenius equation
k = Ax exp (−Edes/RT ) |
(3.8) |

114 CHAPTER 3
where Ax is a pre-exponential factor for reaction of order x . This leads to the
Wigner-Polanyi equation
−(dθH/dt ) = Ax exp (−Edes/RT )θHx |
(3.9) |
where σo; this is the basis for all further analysis of TPD results. For second-order processes, peaks are sometimes symmetrical; the value of Tmax depends upon the heating rate β, and the theoretical treatment17 leads finally to the equation
ln θ0,HT2max = (Edes/RT max) + ln ( A2 R/β Edes) |
(3.10) |
where θ0,H is the initial concentration of adsorbed hydrogen atoms. Edes is then easily extracted from this equation. More complex procedures allow evaluation of Edes in those cases where it is a function of coverage (Tmax then depends on β) and where there is a multiplicity of states.
There have been a number of studies of the TPD of chemisorbed hydrogen from alloy single crystal surfaces,98 e.g. Ni-Cu108 and Pt-Au. The principal conclusion seems to be that the inclusion of the Group 11 metals alters the population of the various states but not very greatly their character (i.e. not their Tmaxvalues), although small changes in Tmax may suggest interference with attractive interactions between hydrogen atoms.109
As with every technique, there are pitfalls for the unwary. It is a destructive technique, and processes other than simple desorption may occur during the heating (and cooling) stages. Surface reconstruction is thermally activated and may take place on a similar time-scale to the heating; its degree of completion at the top temperature may be a function of exposure, and the structure may not revert to its pristine state on cooling. False effects due to the sample holder and other instrumental causes are well understood and easily corrected. Caveat operator!
3.3.CHEMISORPTION OF HYDROGEN ON SUPPORTED
METALS41,110–114
3.3.1. Introduction: Determination of Metal Dispersion
The chemisorption of hydrogen onto supported metals is inevitably more complex than onto unsupported macroscopic forms for three reasons: (i) small supported metal particles differ even from their unsupported counterparts because of the very presence of the support to which they are attached and with which they may interact;115,116 (ii) they will have a higher proportion of low co-ordination number atoms, and for the smallest particles117,118 this may cause the loss of typical metallic properties (see Section 2.5); and (iii) some hydrogen may become adsorbed onto the support by a process other than direct chemisorption. Thus

CHEMISORPTION AND REACTIONS OF HYDROGEN |
115 |
although what has been learnt by studying single crystals, films, wires and powders is extremely useful, its relevance to the kind of particles found in a typical supported metal catalyst needs close examination: such particles are indeed sui generis.
The importance of the manner of interaction of hydrogen with supported metals is two-fold: (1) it provides means for estimating the number of surface metal atoms, and hence with certain assumptions the exposed metal area and the mean particle size; and (2) it informs us of possible states in which hydrogen may exist on the catalyst during catalytic reactions in which it is a partner. The first consideration is treated in this section, and the second in the following section.
Anyone intending to use hydrogen chemisorption to estimate metal dispersion or any derived quantity is faced with a daunting number of decisions that must be taken before experimentation can start. There are three basic procedures to choose from. (A) Volumetric determination of the amount of hydrogen chemisorbed in a static system (the hydrogen atom is too light for gravimetric determination to work well). (B) A titration method in which chemisorbed oxygen reacts with hydrogen or vice versa. (C) Measurement of hydrogen chemisorption by some means in a dynamic system. Each method has advantages and drawbacks, and although each is simple to operate they all require very great care in the choice of conditions and procedures if significant results are to be obtained.
Whatever method is used, it is necessary to prepare the catalyst surface thoughtfully. The conditions for the initial reduction of the precursor will depend on the nature of the metal and salt or complex used in the preparation, and whether or not it has been calcined: in any event it is essential to ensure complete reduction and removal of any species (e.g. Cl−) that might interfere with the adsorption. It has to be remembered that particle size is critically dependent upon the preparation procedure and also upon the in situ treatment preceding adsorption, especially if reduction has not been performed during preparation. By far the larger part of published work concerns platinum, for which detailed standard protocols are available:119,120 hydrogen reduction of Pt/SiO2 made from H2PtCl6 should be for 10 h at 773 K (but not higher), with subsequent outgassing at the same temperature for 4 h to remove adsorbed hydrogen,121 but high dispersion of Pt/SiO2 made from the ammine is secured by reduction at 573 K using hydrogen at only 1 Torr pressure.122
Early work on the volumetric method by Russian122,123 and American124−126 scientists in the 1950s laid the foundations on which all later work has been based. It is hard to realise that in the late 1940s and early 1950s, work on supported metal catalysts was performed in total ignorance of the metal dispersion, although catalysts were occasionally made using colloidal platinum, the particle size of which was known.127 The central difficulty with the volumetric method however arises from the several forms that adsorption can take, and the consequent problem of identifying and isolating that form which tells about the metal dispersion. The literature110,112,128,129 makes frequent reference to ‘strong’ and ‘weak’ forms, with the implication that only the former relates to chemisorption of the molecule as

116 |
CHAPTER 3 |
atoms upon the metal. Thus the ‘strong’ form resists evacuation, while the ‘weak’ is removed; in temperature-programmed desorption (TPD) or in measuring isobars (i.e. the amount adsorbed at constant pressure as a function of temperature), the ‘weak’ form is detected at low temperature and the ‘strong’ is retained at temperatures above which the ‘weak’ is lost. Unfortunately, and this is the great dilemma with the method, the two forms can rarely be clearly distinguished, their ratio depending upon operating conditions such as adsorption temperature, pressure and time. Moreover TPD often, indeed usually, reveals a plethora of overlapping peaks,7,8,41,110,118,130−134 the deconvolution of which sometimes appears to be more of an art form than a scientific exercise. To obtain reproducible and meaningful results it is therefore necessary to adopt very strict operational protocols, defined with an understanding of the idiosyncrasies of the particular system under study; and although attempts are often made to assign states and locations to these various forms, their appearance depends upon operational factors and their identity remains elusive. Some may be purely adventitious as with Pt/Al2O3, where a peak at 723 K has been attributed133 to the decomposition of ammonia, which was a ligand in the precursor salt used in the preparation.
It is helpful first to determine adsorption isobars at several pressures and adsorption isotherms at several temperatures in order to decide what conditions to use:122,126 Figure 3.12 shows the forms that the results may take. At subambient temperatures, hydrogen is weakly adsorbed on highly polar supports such as silica and alumina; this is removed by the time room temperatures is reached, but by then the ‘strong’ form may be starting to desorb as well; indeed a ‘substantial part’ of the hydrogen adsorbed on Pt/SiO2 is reversible at this temperature.135 With certain supports, there is an additional uptake seen especially at high temperatures: this is due to hydrogen spillover onto the support, a subject to be discussed in Section 3.3.4. By good fortune the amount of hydrogen adsorbed at equilibrium in the region of ambient temperature normally provides a good compromise: there will usually be little physically adsorbed gas remaining and little spillover, and between 273 and 323 K the isobar is comparatively flat,136 so that close control of temperature is unnecessary, and the common assumption that H/Pts is about unity under these conditions is quite well justified. Extensive measurements of isobars and isotherms on EUROPT-1 have been reported.136
Some however prefer to work at low temperature (e.g. 77 K) to ensure that a complete monolayer remains on the metal and that spillover is absent. It is then necessary to estimate the amount of physical adsorption that has to be subtracted from the total, either by measuring the adsorption isotherm for the support alone, or, more reliably the isotherm on the catalyst, following the first adsorption and a short evacuation. This method is referred to as the back titration method (Figure 3.13), and even at ambient temperature the second isotherm often reveals some ‘weak adsorption’, the nature of which may vary from one system to another, and which needs to be taken from the total in order to isolate the amount of the ‘strong form’. This often leads to an isotherm that is flatter in the high-pressure

CHEMISORPTION AND REACTIONS OF HYDROGEN |
117 |
Figure 3.13. Measurement of hydrogen chemisorption isotherm by the back-titration method: (1) first isotherm, (2) second isotherm measured after short evacuation, (3) the difference.
region, making extrapolation to zero pressure easier: this procedure is frequently used to obtain a ‘monolayer volume’ from which metal area etc. can be derived. Yet further decisions have to be made. Although at room temperature and below some 95% of each dose is taken up very quickly, the rest may be taken up only quite slowly so that true equilibrium uptakes are only achieved after perhaps 1 h. The determination of a full isotherm with 20 or so points can therefore be a task for two days. Some of the slow uptake may be caused by diffusion to the least accessible metal, but very slow and prolonged uptake probably signifies a poisoned surface.
Over what range of pressure should the isotherm be measured? Careful work over an extended pressure range shows that there may be no sharp ‘knee’ corresponding to the completion of a monolayer on the metal, but rather continuing uptake which appears to approach some saturation limit without ever quite getting there. This implies that the zero-pressure monolayer volume obtained by extrapolation depends upon the pressure range over which the isotherm has been measured (see Figure 3.14).
Figure 3.14. Variation of the uptake extrapolated to zero pressure with the pressure range over which the measurements are made.
118 |
CHAPTER 3 |
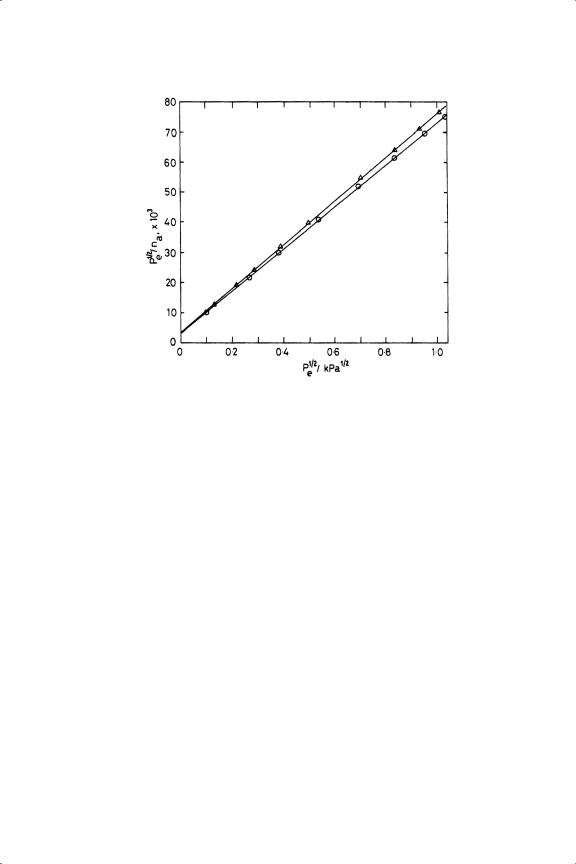
Figure 3.15. Hydrogen chemisorption on EUROPT-1 reduced at 758 K plotted according to the Langmuir equation137 (see text; the upper line is for results obtained with oxidation before the reduction).
One way of circumventing this problem is to fit the results to the appropriate linearised form of the Langmuir equation for dissociative adsorption:120,137
1 |
1 |
1 |
/nm |
|
Pe /2 |
/n = (b /2 nm )−1 |
+ Pe/2 |
(3.11) |
where n is the molar amount of hydrogen chemisorbed at the equilibrium pressure Pe , nm the monolayer amount and b the adsorption coefficient. Excellent straight line plots are obtained (see Figure 3.15), the inverse slope of which gives nm ; this procedure utilises all the data points, the only assumption being the applicability of the equation.
The volumetric method has very often been used with platinum catalysts for which quite satisfactory results are generally obtained: it is usual to assume that the monolayer volume or amount, obtained as just described or by extrapolation corresponds to an H:Ms (hydrogen atom to metal surface atom) ratio of 1:1. Some justification for this assumption is to be found, at least for particles of moderate size, in the adsorption stoichiometry shown by films and single crystals, but for very small particles and at high pressures the H/Ms ratio can exceed unity quite substantially: this is especially so with rhodium41,121,128 and iridium41,138 (see below). Care is however needed with palladium41,45,115,139−142 because of the risk of forming the hydride; however, monolayer coverage is obtained at pressures below which dissolution starts. The base metals iron, cobalt and nickel have been

CHEMISORPTION AND REACTIONS OF HYDROGEN |
119 |
intensively studied,8,110,143 but copper presents a special problem because it does not absorb hydrogen very strongly,64,144,145 and adsorption of oxygen atoms either from molecules or from nitrous oxide has to be resorted to. Similar difficulties are met with silver and gold. Particular problems also attend hydrogen chemisorption on ruthenium (see below) and on any of the Group 8–10 metals, supported on reactive oxides of the Transition Series metals (see Section 3.3.3). There are however numerous studies of hydrogen chemisorption on metal particles in/on
zeolites.117,118,132,146–151
The development of reliable procedures for volumetric determination of metal dispersion was somewhat hampered by the necessity to use homemade apparatus, although commercial equipment is now available (at a price). One important factor which varied from one apparatus to another, but was often ignored, was the pumping speed. This governs the rate at which desorbed molecules can be removed from the neighbourhood of the sample, and is critically dependant on the diameter of the tubing used. Assessment of the importance of this and many other factors has been greatly helped by the availability of standard catalysts,152 by the use of which both equipment and operators could be calibrated. A range of such catalysts was prepared in Japan, and there were more limited programmes in the United States and Russia. In Europe a 6.3% Pt/SiO2 (EUROPT-1), a typical petroleum reforming catalyst (0.3% Pt/Al2O3: EUROPT-3) and a 20% Ni/SiO2 were made and widely distributed. The EUROPT-1 in particular has been extremely thoroughly examined (see Further Reading section); it has a mean particles size of 1.8 nm and
a hydrogen monolayer volume by the Langmuir method of 190 µmol gcat−1. The volumetric method may be carried out in several different ways. As noted
above, the usual procedure of admitting a series of small doses and allowing each to reach equilibrium is a slow and tiresome process (although it can now be automated), and errors in measurement accumulate as the work progresses. This latter difficulty is avoided by introducing a single massive dose, sufficient to saturate both ‘strong’ and ‘weak’ sites, and then either monitoring the isotherm in the desorption mode (where equilibrium is attained more quickly8,153) or changing the size of the single dose so that the amount of the ‘weak’ form is altered and can therefore be obtained by extrapolation.128,139 With EUROPT-1 this procedure gives a monolayer volume of 188 µmol gcat−1 in good agreement with that found using mulitple injections. Error accumulation is also avoided by “pressure programming”, where the pressure over the sample is continuously increased by heating a large reservoir attached to the sample vessel.154 Comparison of the pressure-temperature curve with and without a catalyst being present permits derivation of the adsorption isotherm.
Having defined what seems to be a suitable method for estimating the monolayer capacity, that is, the number of hydrogen atoms strongly adsorbed per unit mass of metal, it still remains to be shown that this equates to the number of surface metal atoms; although this has often been assumed in the past, the variable co-ordination number of atoms at or close to the surface renders this a somewhat

120 |
CHAPTER 3 |
unreliable guess for calculating dispersion and mean particle size. Some further enlightenment concerning the nature of the ‘weak’ form is also desirable.
Progress was made when the results for hydrogen chemisorption were compared with those for the chemisorption of other gases (e.g. O2, CO) and especially with those for physical methods such as TEM and EXAFS, which are independent of chemical factors. Although there are some instances in the literature where good agreement has been reported between chemical and physical methods,41,153 there are also cases where the agreement has been poor and these turn out to be the more informative. The experience with EUROPT-1 is a case in point. The hydrogen monolayer quantity of 190 µmol gcat−1 noted above137 corresponds to an H/Pttot ratio of about 1.2, while TEM results show quite clearly that the mean size is about 1.8 nm which equates to a dispersion of only 60%. Reference to the TPD measurements showed that the largest of the three peaks, together with an assumed 1/1 H/Pt stoichiometry, led to a dispersion of 65%: the highest temperature peak was assigned to spillover, and the remaining peak to hydrogen taken up at the metal/support interface by breaking M O bonds. This accounted for the excess hydrogen chemisorbed. It cannot therefore be safely assumed that all strongly held hydrogen resides on the exposed metal surface.
Although the suggestion of some hydrogen being located at the interface lacked independent confirmation at the time, it has received unequivocal support from the EXAFS work of Koningsberger’s group.118,151,153,155−158 The subject of metal-support interaction was treated in considerable detail in Section 2.6, so it only remains to emphasise the role that hydrogen plays. In the case of Pt/γ -Al2O3,151,158 reduction at 573 K created small three dimensional metal particles at a distance of 0.27 nm from the oxide ions of the support: this quite large Pt−O bond length suggested that hydrogen atoms had inserted themselves at the interface, creating a Pt H . . . HO situation. Reduction at 723 K formed raft-like particles exposing mainly (100) facets and having a smaller tendency to chemisorb hydrogen, the Pt O distance was now only 0.22 nm, and XANES measurements showed that there were 95% more holes in the d-band. It was inferred that the hydrogen at the interface had been lost and that particles were held by a coulombic attraction between the metal and the oxide ions. These results, together with those on silica and various zeolites, reinforce the need to appreciate the structural and electronic changes brought about by reduction and evacuation, and the effects that these may have on adsorption stoichiometry and catalytic behaviour. Recognition of these effects might go far towards the resolving many of the anomalies and contradictions that the literature reveals.
It remains to offer a further comment on the nature of ‘weakly’ chemisorbed hydrogen. We saw (Section 3.2.2) when discussing single metal crystals that adsorption was often detected at coverages greater than unity, when expressed in terms of the number of metal atoms in the exact surface plane. Above ‘complete’ coverage, heats of adsorption fell,159 and hydrogen atoms occupied sites where

CHEMISORPTION AND REACTIONS OF HYDROGEN |
121 |
Figure 3.16. Hydrogen chemisorption on supported metals: plots of H/Mtot versus (12 – N ) where N is the first–shell coordination number determined by EXAFS; (a) Pt/Al2 O3; (b) Rh/Al2 O3 ; (c) Ir/SiO2 and Ir/Al2 O3 ; (d) curve for estimating dispersion D from (12–N ) (see text).
they made fewer contacts with metal atoms, i.e. atop or two-fold sites. Such excess adsorption was especially prevalent with rhodium. This may also happen with supported metal particles and in addition there may be two or even more hydrogen atoms attached to edge or corner atoms. Careful measurements41,111,146,151,158 by EXAFS and hydrogen chemisorption on supported platinum, rhodium and iridium catalysts, differing in metal loading and reduction temperature have shown that even for dispersions less than 100% the H/Mtot ratio can rise to quite high values (Figure 3.16). For the largest particles showing a calculated 100% dispersion, corresponding to a first shell co-ordination number of 5, H/Mtot values are for platinum, 1.25; for rhodium, 1.7; and for iridium, 3.3. Quite clearly the propensity for different metals to chemisorb hydrogen differs enormously and use of the same stoichiometry for all would give quite incorrect results. It is therefore unacceptable to use the H/Mtot ratio as a measure of size or dispersion, without knowing the proper proportionality factor to use.
In this connection we may note that naked gas-phase Transition Metal clusters react with hydrogen, at rates that vary markedly with size, to form adducts MHn where the maximum value of n is three for palladium, five for nickel and platinum and eight for iridium.160 Platinum also forms the (PtH4)2− anion, which is planar and stable below 195 K, but at higher temperature the four hydrogens oscillate around the six octahedral positions; it is converted to the unstable (PtH6)2− anion at high hydrogen pressures and temperature.161
A great deal of work has been carried out on unsupported162 and supported ruthenium catalysts,163−169 as well as on single crystals;1,170,171 this interest arises

122 |
CHAPTER 3 |
from this metal’s high activity in methanation of carbon monoxide and in alkane hydrogenolysis (see Chapters 13 and 14) and in forming high molecular weight hydrocarbon in Fischer-Tropsch synthesis. In this last reaction, the presence of alkaline species (especially K+) can direct the reaction towards forming oxygenated products (e.g. C2H5OH). What is of interest in the present context is that it is frequently difficult to obtain good isotherms by the volumetric method, because of the very long times needed for the uptake of each dose to finish. If enough time is not allowed, the isotherm above the ‘knee’ may have a high slope, and the monolayer amount obtained by extrapolation to zero pressure suggests much larger particles than TEM shows. The problem is largely, perhaps entirely, due to poisons arising from the preparation (or from the atmosphere); these, especially chloride ion,168,172−174 oxygen168 and sulfur175 species are firmly retained by the metal and inhibit hydrogen chemisorption. Their slow removal determines the rate at which hydrogen is taken up.176 Potassium ion also blocks hydrogen uptake, interfering particularly with the ‘weak’ state formed at high pressure.163 The dispersion of Ru/Al2O3 has also been determined using low-temperature oxygen chemisorption177 and dynamic pulse reaction with nitrous oxide.178
Far less use has been made of hydrogen chemisorption in the study of supported bimetallic catalysts, for which there are several possible reasons. (i) The process of chemisorption may lead to a restructuring of the metal particle, in which the component is drawn to the surface: this certainly happens with carbon monoxide and may occur with hydrogen, especially with small particles. (ii) Where one component’s atoms are inactive towards hydrogen (e.g. a Group 11 metal), hydrogen atoms may migrate to them from the active metal (Section 3.23) or there may be sites where interaction occurs with atoms of both types. (iii) Even if it is assumed, as is often done, that hydrogen chemisorption counts the number of exposed atoms, this cannot safely lead to an estimate of dispersion or particle size, since there is no means of knowing the number of inactive surface atoms. Physical methods such as TEM are preferred where the size needs to be known, and XPS or AES can give information on surface composition.179,180 Despite these uncertainties there have been a number of studies of hydrogen chemisorption on bimetallic catalysts,49,181−183 especially those of ruthenium with either copper184,185 or silver.163,186,187 In general, provided other factors do not obtrude, the amount of hydrogen adsorbed falls progressively as the surface concentration of the inert element rises: there is little evidence for electronic interaction188 or of migration to the inactive partner.
Hydrogen chemisorption on supported metals can also be studied in a dynamic mode.130,189 The sample is first reduced and then cleansed by passing a stream of very pure inert gas at high temperature. Successive small doses of hydrogen are then admitted at regular intervals at the desired temperature; the first few are wholly retained, some later ones only partially, and finally when the surface is fully covered the doses pass through unchanged. The amount of hydrogen retained under