Icef 2004/2005
STATISTICS
FIRST YEAR
EXAM
Solutions
April 5, 2005
SECTION II
Part A
Problems 1 5
Problem 1

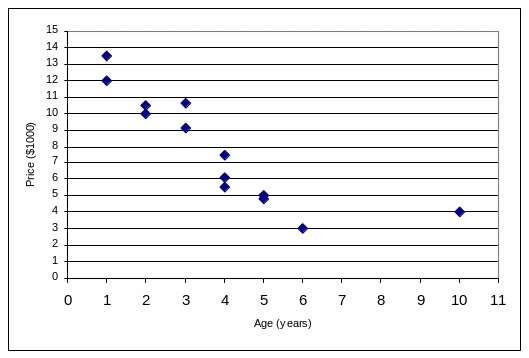
The given scatterplot shows the advertised prices (in thousands of dollars) plotted against ages (in years) for random sample of Plymouth Voyagers on several dealers’ lots. A computer printout showing the results of fitting a line to the data by the method of lest squares gives
Dependent Variable: PRICE |
|
|||
Method: Least Squares |
|
|||
Included observations: 13 |
|
|||
Variable |
Coefficient |
Std. Error of Coeff. |
||
C |
12.33 |
1.005 |
||
AGE |
-1.17 |
0.224 |
||
R-squared |
0.7140 |
|
||
In other words,
Price = 12.33 1.17 Age,
R-squared = 71.40%
(a) Find the correlation coefficient for relationship between price and age of Voyagers based on these data.
(b) Do these results give the evidence of connection between Age and Price? Test the corresponding hypothesis.
(c) How will the size of the correlation coefficient change if the 10-year-old Voyager is removed from the data set? Explain your answer.
(d) How will the size of the slope of the least squares regression line change if the 10-year-old Voyager is removed from the data set?
Solution.
(a)
It is known that
![]() where r
is a correlation coefficient and
where r
is a correlation coefficient and
![]() .
Obviously
.
Obviously
![]() ,
so
,
so
![]() .
.
(b)
We should test the null hypothesis H0:
![]() versus
Ha:
versus
Ha:
![]() .
Test-statistics is
.
Test-statistics is
![]() .
Under H0
has
tdistribution
with 11 (= number of observations
2) degrees of freedom. Pvalue
is less than 0.001 (in fact Pvalue
= 0.0003). Hence, null hypothesis should be rejected at any
reasonable significance level. In other words, these results show
strong connection between Age and Price.
.
Under H0
has
tdistribution
with 11 (= number of observations
2) degrees of freedom. Pvalue
is less than 0.001 (in fact Pvalue
= 0.0003). Hence, null hypothesis should be rejected at any
reasonable significance level. In other words, these results show
strong connection between Age and Price.
(с) If the 10-year-old Voyager is removed from the data set the remaining points are much more close to straight line, the linear relationship between Price and Age looks more strong, and, of course, it is negative. So, the absolute value of correlation coefficient will increase. (In fact, the new correlation coefficient is equal to 0.966.)
(d) If the 10-year-old Voyager is removed from the data set the least square line will be steeper, so the slope will remain negative and the absolute value of the slope will increase (In fact, the new slope is equal to 1.97.)
Problem 2
All college students were asked in order to assess the usage of the college computer classes for the self-study purposes. The numbers of users of several categories, classified by the year of study, are shown in the following table,
Almost every day Sometimes Never
First year 22 35 15
Second year 41 27 7
Third year 36 15 3
Fourth year 33 13 1
Use these data to investigate the association, if any, between usage of computers and year of study, interpret any association that exists. Name another factor that may have an influence on these data.
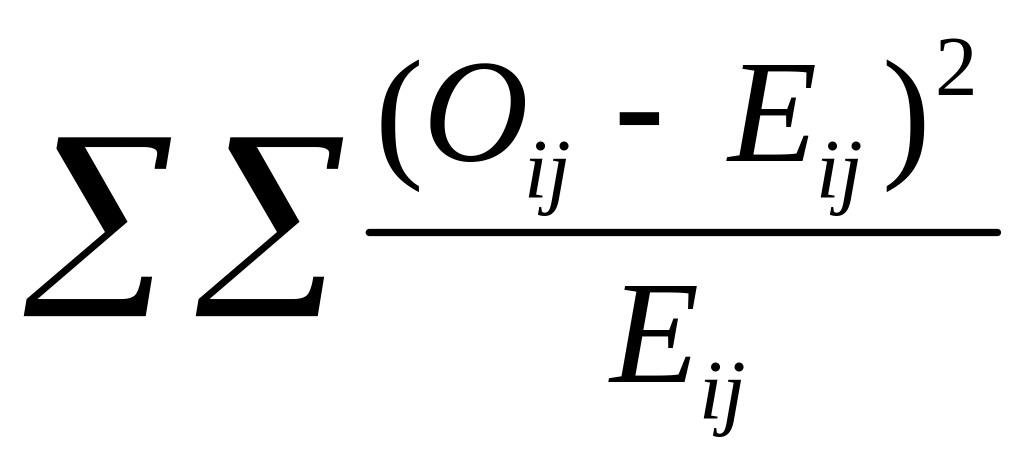
Solution. The null hypothesis: there is no association between usage of computers and year of study. In order to test this hypothesis we may use contingency tables. By direct calculations we get the table of observed values:
|
Almost every day |
Sometimes |
Never |
Total |
Margin |
First year |
22 |
35 |
15 |
72 |
0.290 |
Second year |
41 |
27 |
7 |
75 |
0.302 |
Third year |
36 |
15 |
3 |
54 |
0.218 |
Fourth year |
33 |
13 |
1 |
47 |
0.190 |
Total |
132 |
90 |
26 |
248 |
|
Margin |
0.532 |
0.363 |
0.105 |
|
|
and the table of expected values:
|
Almost every day |
Sometimes |
Never |
First year |
38.32 |
26.13 |
7.55 |
Second year |
39.92 |
27.22 |
7.86 |
Third year |
28.74 |
19.60 |
5.66 |
Fourth year |
25.02 |
17.06 |
4.93 |
(50 points).
The
corresponding statistics
 is equal to 28.25 and P-value
is closed to 0. The null hypothesis is rejected at any reasonable
significance level.
Looking through the table we may conclude that there are two tendencies: the higher the year the higher the proportion of students using computers almost every day, and the higher the year the lower the proportion of students never using computers.
There are another factors such that the different subjects for different years, the possible increasing number of practical works, the increasing of computer skill, that may have influence on these data.
