

vk.com/id446425943
2018
THE STATE OF
AGRICULTURAL
COMMODITY
MARKETS
AGRICULTURAL TRADE, CLIMATE CHANGE AND FOOD SECURITY

vk.com/id446425943
This flagship publication is part of THE STATE OF THE WORLD series of the Food and Agriculture Organization of the United Nations.
Required citation:
FAO. 2018. The State of Agricultural Commodity Markets 2018. Agricultural trade, climate change and food security. Rome.
Licence: CC BY-NC-SA 3.0 IGO.
The designations employed and the presentation of material in this information product do not imply the expression of any opinion whatsoever on the part of the Food and Agriculture Organization of the United Nations (FAO) concerning the legal or development status of any country, territory, city or area or of its authorities, or concerning the delimitation of its frontiers or boundaries. The mention of specific companies or products of manufacturers, whether or not these have been patented, does not imply that these have been endorsed or recommended by FAO in preference to others of a similar nature that are not mentioned.
ISBN 978-92-5-130565-2 © FAO 2018
Some rights reserved. This work is made available under the Creative Commons Attribution-NonCommercial-ShareAlike 3.0 IGO licence (CC BY-NC-SA 3.0 IGO; https://creativecommons.org/licenses/by-nc-sa/3.0/igo).
Under the terms of this licence, this work may be copied, redistributed and adapted for non-commercial purposes, provided that the work is appropriately cited. In any use of this work, there should be no suggestion that FAO endorses any specific organization, products or services. The use of the FAO logo is not permitted. If the work is adapted, then it must be licensed under the same or equivalent Creative Commons license. If a translation of this work is created, it must include the following disclaimer along with the required citation: “This translation was not created by the Food and Agriculture Organization of the United Nations (FAO). FAO is not responsible for the content or accuracy of this translation. The original English edition shall be the authoritative edition.”
Any mediation relating to disputes arising under the licence shall be conducted in accordance with the Arbitration Rules of the United Nations Commission on International Trade Law (UNCITRAL) as at present in force.
Third-party materials. Users wishing to reuse material from this work that is attributed to a third party, such as tables, figures or images, are responsible for determining whether permission is needed for that reuse and for obtaining permission from the copyright holder. The risk of claims resulting from infringement of any third-party-owned component in the work rests solely with the user.
Sales, rights and licensing. FAO information products are available on the FAO website (www.fao.org/publications) and can be purchased through publications-sales@fao.org. Requests for commercial use should be submitted via: www.fao.org/contact-us/licence-request. Queries regarding rights and licensing should be submitted to: copyright@fao.org.
COVER PHOTOGRAPH ©West Siwa Development Project
EGYPT: Siwa Oasis is one of the best illustrations of farmers’ ingenuity to adapt agriculture to very harsh climatic conditions by managing scarce water resources to rear livestock and grow indigenous crops to respond to local needs.

vk.com/id446425943
2018
THE STATE OF
AGRICULTURAL
COMMODITY
MARKETS
AGRICULTURAL TRADE,
CLIMATE CHANGE AND
FOOD SECURITY
Food and Agriculture Organization of the United Nations
Rome, 2018

vk.com/id446425943
CONTENTS
FOREWORD
METHODOLOGY
ACKNOWLEDGEMENTS
ACRONYMS AND ABBREVIATIONS
EXECUTIVE SUMMARY
PART 1 AGRICULTURAL TRADE:
KEY DYNAMICS AND TRENDS
The evolution of agricultural trade: 2000–2016 Agricultural policy trends
PART 2
THE LINKAGES BETWEEN AGRICULTURAL TRADE, FOOD SECURITY AND CLIMATE CHANGE
Climate change, agriculture and agricultural trade
Long-term foresight analysis of climate change impacts on agricultural trade
PART 3
AGRICULTURAL TRADE AND CLIMATE CHANGE: EXPLORING THE POLICY SPACE
Paris Agreement and the World Trade Organization (WTO) Agreements
Relationship between WTO regulations and the Paris Agreement
Policy space for effective implementation of Nationally Determined Contributions (NDCs)
iv |
PART 5 |
|
|
vi |
ADAPTING TO CLIMATE CHANGE AND |
|
|
vii |
MITIGATING ITS IMPACT: THE ROLE |
|
|
OF TRADE POLICIES |
61 |
||
x |
|||
The role of trade and trade policies |
|
||
xii |
|
||
in climate change adaptation |
62 |
||
|
|||
|
The role of trade in mitigating the impact |
|
|
1 |
of climate change |
69 |
|
Assessing the policy space for trade policies: |
|
||
2 |
|
||
adaptation and mitigation in the context |
|
||
9 |
|
||
of WTO obligations |
72 |
||
|
|||
|
PART 6 |
|
|
13 |
NON-TARIFF MEASURES (NTMs): |
|
|
REGULATIONS AND STANDARDS |
75 |
||
14 |
|||
Technical Barriers to Trade (TBT) and |
|
||
|
|
||
|
environmental protection |
76 |
|
19 |
Sanitary and Phytosanitary Measures |
|
|
|
|
||
|
(SPS) Agreement |
78 |
|
31 |
GLOSSARY |
85 |
|
NOTES |
86 |
||
|
|||
32 |
|
|
|
38 |
|
|
|
40 |
|
|
PART 4 |
|
ADAPTING TO CLIMATE CHANGE AND |
|
MITIGATING ITS IMPACT: DOMESTIC POLICIES |
|
AND SUPPORT MEASURES |
43 |
Policies targeting adaptation and mitigation in |
|
production under the Agreement on Agriculture |
44 |
Policies for emissions reduction |
53 |
Assessing the policy space for domestic support: |
|
adaptation and mitigation in the context of the |
|
Agreement on Agriculture |
58 |
| ii |

vk.com/id446425943
TABLES, FIGURES AND BOXES
TABLES |
|
|
|
1.7 Average agricultural applied tariff |
4.1 Sources of growth in global |
48 |
||||
1.1 Major importers of agricultural |
|
rates, weighted average (percent), |
|
agricultural output |
||||||
|
2000–2016 |
10 |
5.1 Maize imports, 2000–2016 |
|
||||||
products: share of total import value, |
|
|
||||||||
|
|
|
|
|||||||
|
1.8 Producer Nominal Protection |
|
(billion USD) |
63 |
||||||
2016 and 2000 |
5 |
|
||||||||
Coefficient, 2000–2016 |
10 |
|
|
|
|
|||||
1.2 Major exporters of agricultural |
|
5.2 Impact of open markets on net |
|
|||||||
|
|
|
|
|||||||
|
2.1 Changes in agricultural production |
trade positions under climate change in |
||||||||
products: share of total export |
|
|||||||||
|
in 2050: climate change relative to the |
2050 |
|
65 |
||||||
value, 2016 and 2000 |
6 |
|
||||||||
baseline |
20 |
|
|
|
|
|||||
2.1 Climate change and food |
|
|
|
|
|
|||||
16 |
2.2 Baseline and climate change crop |
|
BOXES |
|
|
|||||
security |
2.1 Agricultural trade, climate |
|
||||||||
yield assumptions, percent change |
|
|
||||||||
3.1 Total domestic support |
37 |
|
|
|||||||
2011–2050 |
22 |
change and nutrition |
15 |
|||||||
4.1 Annex 2 of the Agreement on |
|
2.3 Changes in agricultural net |
|
2.2 Limitations of long-term |
|
|||||
Agriculture: Green Box support |
47 |
trade in 2050: climate change scenario |
foresight analysis |
17 |
||||||
measures |
relative to the baseline (in billion USD, |
2.3 Climate change and |
|
|||||||
|
|
|
|
|
||||||
4.2 Effects of a USD 20 tax per tonne |
2011 constant prices) |
23 |
|
|||||||
chokepoints of global food trade |
18 |
|||||||||
of carbon dioxide equivalent on |
|
2.4 Changes in agricultural production |
2.4 System drivers and scenarios |
|
||||||
selected agricultural prices for |
|
and net exports in selected countries |
|
|
||||||
|
|
in the modelling analysis |
21 |
|||||||
selected countries (percent increase) 55 |
|
|||||||||
and regions in 2050: climate change |
||||||||||
|
|
|
|
|||||||
|
|
|
|
2.5 The impact of climate change |
|
|||||
5.1 Impact of emissions leakage |
|
scenario relative to the baseline |
23 |
28 |
||||||
through trade |
70 |
2.5 Increases in exports of agricultural |
on fisheries |
|||||||
|
|
|
|
|||||||
|
|
|
|
3.1 Implementation mechanisms |
|
|||||
|
|
|
|
products in 2050: climate change |
|
|
||||
FIGURES |
|
|
|
|
||||||
|
|
relative to the baseline (in billion USD, |
under the Kyoto Protocol and |
|
||||||
|
|
|
|
33 |
||||||
1.1 World merchandise trade value |
|
2011 constant prices) |
24 |
Paris Agreement |
||||||
|
|
|
3.2 The US — Gasoline case |
39 |
||||||
and world GDP: annual growth rates, |
2.6 Decreases in exports of agricultural |
|||||||||
2000–2016 |
3 |
products in 2050: climate change |
|
3.3 Developing countries: |
|
|||||
|
|
|
|
relative to the baseline (in billion USD, |
|
|||||
1.2 Agricultural price indices, |
|
special and differential treatment |
41 |
|||||||
|
2011 constant prices) |
25 |
||||||||
1990–2018 (2002–2004=100) |
4 |
4.1 Regional food reserves |
52 |
|||||||
|
|
|||||||||
|
|
|
|
2.7 Changes in GDP in 2050: |
|
|||||
1.3 Food Price Index volatility, |
|
|
4.2 Cap-and-trade schemes |
56 |
||||||
|
climate change scenario relative |
|
||||||||
January 1991–March 2018 (percent) |
4 |
|
||||||||
to the baseline scenario |
26 |
4.3 Regulatory policies: |
|
|||||||
1.4 Evolution of South–South |
|
|
||||||||
|
2.8 Changes in GDP in selected |
|
deforestation and biofuels |
57 |
||||||
agricultural trade, 2000–2015 |
7 |
|
||||||||
countries and regions in 2050: |
|
5.1 Import financing for |
|
|||||||
1.5 Least Developed Countries: |
|
|
|
|||||||
|
climate change scenario relative |
|
developing countries |
64 |
||||||
Agricultural trade (USD billion), |
8 |
to the baseline |
26 |
5.2 The effects of global |
|
|||||
2000–2015 |
2.9 Changes in food prices in |
|
65 |
|||||||
1.6 Sub-Saharan Africa: net |
|
|
agricultural market integration |
|||||||
|
2050: climate change scenario |
|
6.1 Estimating the carbon |
|
||||||
agricultural trade (USD billion), |
|
relative to the baseline |
27 |
79 |
||||||
2000–2013 |
9 |
2.10 Changes in food prices and |
|
footprint of agricultural products |
||||||
|
|
|
|
|
|
|
|
|
||
|
|
|
|
food purchasing power in selected |
|
|
|
|
|
|
|
|
|
|
countries/regions in 2050: climate |
|
|
|
|
|
|
|
|
|
|
change scenario relative to the |
|
|
|
|
|
|
|
|
|
|
baseline |
27 |
|
|
|
|
|
| iii |

vk.com/id446425943
FOREWORD
There will be no sustainable future without eradicating poverty and hunger. Ensuring food security for all is both a key function of and a challenge for agriculture, which faces ever-increasing difficulties – as populations rise, urbanization increases and incomes grow, the agricultural sector will be under mounting pressure to meet the demand for safe and nutritious food. Agriculture has to generate decent jobs and support the livelihoods of billions of rural people across the globe, especially in developing countries where hunger and poverty are concentrated. Furthermore, the sector has a major role to play in ensuring the sustainability of the world’s precious natural resources and biodiversity, particularly in light of a changing climate.
Climate change will have an increasingly adverse impact on many regions of the world, with those in low latitudes being hit the hardest. This means that countries in Africa, Asia and Latin America, many of which already suffer from poverty, food insecurity and various forms of malnutrition, will be disproportionately at risk. Agriculture in these regions will be negatively affected. Regions with temperate climates, on the other hand, could see positive impacts, with warmer weather benefitting their agricultural sectors. Climate change can widen the economic gap between developed and developing countries. Unless we take urgent action to combat climate change, we can expect to see a very different global picture of agriculture in the future. Agricultural trade will also change.
International trade has the potential to stabilize markets and reallocate food from surplus to deficit regions, helping countries adapt to climate change and contribute towards food security. However, we must ensure that the evolution and expansion of agricultural trade is equitable and
works for the elimination of hunger, food insecurity and malnutrition globally. For this reason, in recent years, the relationship between agricultural trade and food security has become an increasing part of both trade and development agendas.
Developing countries, in particular, will need support from the global community to facilitate their adaptation and mitigation efforts in relation to climate change and to transform their agriculture and food systems sustainably. As the migration crisis of recent years has shown, no country stands unaffected. What happens in one part of the globe will undoubtedly affect other parts, and domestic and foreign policies must take account of this.
The year 2015 signalled the arrival of two landmark initiatives that recognized the need for countries to take collective action to promote sustainable development and combat climate change: the 2030 Agenda for Sustainable Development and its 17 Sustainable Development Goals (SDGs), and the Paris Agreement of the United Nations Framework Convention on Climate Change (UNFCCC). Both initiatives reflect evolving thinking around global issues, and both call for a fair and transparent international trade system. In food and agriculture, trade can play a role and contribute to meeting the targets of both the 2030 Agenda and the Paris Agreement.
The work of the Food and Agriculture Organization of the United Nations (FAO) underpins these international efforts, while also being guided by them. Through its Strategy on Climate Change, FAO delivers transformational solutions for adaptation and mitigation in agriculture at global, national and local levels. The Organization also works towards transparent
| iv |

vk.com/id446425943
and efficient global agricultural commodity markets and supports Member Nations in formulating and implementing agricultural and trade policies that are conducive to improved food security and nutrition. In this way, FAO’s work supports the discussions in the World Trade Organization (WTO).
This edition of The State of Agricultural Commodity Markets focuses on the complex and underexplored intersection between agricultural trade, climate change and food security. It is clear that we cannot tackle hunger without finding adaptation and mitigation solutions to climate change in agriculture and food systems. It is also clear that the uneven impact of climate change across regions and countries, and the corresponding changes in food availability and access will affect international trade patterns and trade routes.
Under the Paris Agreement, many countries have committed to reducing their greenhouse gas emissions, including in the agricultural sector, one of the main contributors to climate change. Collective consultations on approaches to tackle agriculture’s vulnerability to climate change were initiated in November 2017 at the Twenty-third Conference of the Parties of UNFCCC under the Koronivia Joint Work on Agriculture.
This report supports these discussions by providing an in-depth analysis of the Paris Agreement and the WTO agreements to enhance clarity and provide guidance on policy options that could strengthen the mutually supportive role of these accords in tackling climate change and hunger. Wide-ranging policy actions are necessary to ensure that trade will contribute to the efforts aimed at ensuring food security and promoting adaptation and mitigation to climate change. The uneven impact of climate change
across the world and its implications for agricultural trade, especially for developing countries, underlines the need for a balanced approach to policies, which should enhance the adaptive role of trade, while supporting the most vulnerable.
Developing and implementing policies that shift global agricultural production onto a more sustainable path, protect the most vulnerable countries and regions and at the same time facilitate the contribution of trade to the achievement of Sustainable Development Goal 2, will be key if we are to see a world free of hunger and malnutrition by 2030.
José Graziano da Silva
FAO Director-General
| v |

vk.com/id446425943
METHODOLOGY
The preparation of The State of Agricultural Commodity Markets 2018 began in March 2017. An editorial advisory board comprised of FAO specialists and external experts was formed to support the writing team. The Editorial Advisory Board reviewed, discussed and provided advice on the analysis and subsequent drafts of the report.
An International Technical Conference on Climate Change, Agricultural Trade and Food Security took place in Rome on 15–17 November 2017. The conference brought together policy-makers, academics, practitioners and other interested stakeholders from around the world to exchange ideas and share research results and experiences. The report has benefited from the research, analysis and discussions that took place at the conference. This approach significantly broadened the Organization’s knowledge and views on the issues.
To underpin the analysis in the report, climate change impacts were projected by Wageningen Economic Research using MAGNET (Modular Applied GeNeral Equilibrium Tool), a global Computable General Equilibrium model. Scenarios were developed based on trends from the Intergovernmental Panel on Climate Change (IPCC) Shared Socio-economic Pathway Three (SSP3) data and climate-related crop yields data provided by FAO.
A total of ten technical papers on several issues related to climate change and agricultural trade were commissioned from world experts to inform the writing.
The first draft was presented and discussed by the Editorial Advisory Board in March 2018 and further discussed by the FAO Economic and Social Development Department management team in April 2018. The Office of the Director-General and FAO specialists from technical divisions across the Organization reviewed subsequent drafts and the final report.
Following Members’ requests, the biennial research and publication cycle of The State of Agricultural Commodity Markets has been aligned with the meetings of the Committee on Commodity Problems (CCP). The content and findings of SOCO 2018 will be presented to the CCP at its upcoming meeting on 26–28 September 2018.
| vi |

vk.com/id446425943
ACKNOWLEDGEMENTS
The State of Agricultural Commodity Markets 2018 (SOCO 2018) was prepared by a multidisciplinary team of the Food and Agriculture Organization of the United Nations (FAO) under the direction of Boubaker Ben-Belhassen, Director of FAO’s Trade and Markets Division (EST), and George Rapsomanikis, Senior Economist and Editor of SOCO 2018. Overall guidance was provided by Kostas Stamoulis, Assistant Director-General of the Economic and Social Development Department (ESD), and by the Economic and Social Development Department Management team.
RESEARCH AND WRITING TEAM
The research and writing team was composed of: Emily Carroll, Jiyeon Chang, Luca Lodi (Data), George Rapsomanikis and Andrea Zimmermann from EST; and FAO consultant David Blandford (Penn State University).
The team received valuable comments and guidance from the SOCO 2018 Editorial Advisory Board: Boubaker Ben-Belhassen (Director, Trade and Markets Division, FAO), David Blandford (Penn State University), Joseph W. Glauber (International Food Policy Research Institute), Christian Häberli (University of Bern and World Trade Institute), Ekaterina Krivonos (FAO), Alan Matthews (Trinity College Dublin), Georgios Mermigkas (FAO), Mirella Salvatore (FAO) and Josef Schmidhuber (Deputy Director, Trade and Markets Division, FAO).
CONTRIBUTORS
Background papers
The following authors contributed with technical background papers for this report: Frank Asche (University of Florida); David Blandford (Penn State University); David Cui, Marijke Kuiper, Hans van Meijl and Andrzej Tabeau (Wageningen Economic Research); Joseph W. Glauber (International Food Policy Research Institute); Christian Häberli (University of Bern and World Trade Institute); Thomas W. Hertel (Purdue University); Lukas Kornher (University of Kiel); Ralf Lopian (Ministry of Agriculture and Forestry, Finland); C.S.C. Sekhar (University of Delhi); and Andrea Zimmermann (FAO), Julian Benda (FAO), Heidi Webber (Leibniz Centre for Agricultural Landscape Research) and Yaghoob Jafari (University of Bonn).
Additional inputs
The report was informed by the ‘International Technical Conference on Climate Change, Agricultural Trade and Food Security’, which took place on 15–17 November 2017 in Rome. The names of the presenters and background papers from the conference can be found at: www.fao.org/economic/est/est- events-new/climatetrade/en/.
From FAO, inputs were provided by Shoki AlDobai, Lorenzo Giovanni Bellu, Julian Benda, Denis Drechsler, Günter Hemrich (Deputy Director ad interim, Nutrition and Food Systems Division), Alexander Jones (Director, Climate and Environment Division), Aikaterini Kavallari, Michelle Kendrick, Ekaterina Krivonos, Brent Larson, Yasaman Matinroshan, Georgios Mermigkas, Mirko Montuori, Jamie Morrison (Strategic Programme Leader, Enable inclusive and efficient agricultural and food systems),
| vii |

vk.com/id446425943
ACKNOWLEDGEMENTS
Marc Mueller, Zitouni Oulddada (Deputy Director, Climate and Environment Division), Clarissa Roncato Baldin, Stefania Vannuccini, Ramani Wijesinha Bettoni, Trudy Wijnhoven and Jingyuan Xia (International Plant Protection Convention Secretary). Fabio De Cagno and Chiara Di Domenico provided administrative support. Araceli Cardenas, Raffaella Rucci and Ettore Vecchione provided support on communications issues.
Translation and printing services were delivered by the Meetings Programming and Documentation Service (CPAM) of the FAO Conference, Council and Protocol Affairs (CPA) Division.
The Publishing Group (OCCP) in FAO’s Office for Corporate Communication provided editorial support, design and layout, as well as production coordination, for editions in all six official languages.
THIS REPORT
The 2018 edition of The State of Agricultural Commodity Markets aims to deepen the discussion on the broad spectrum of policy instruments available to policy-makers implementing the Paris Agreement. It examines how various forms of domestic support and trade measures relate to climate change adaptation and mitigation; how they might be used in the future; and, how World Trade Organization (WTO) rules shape policy choices.
The report explores policy options that lie on the juncture of: the Paris Agreement, a framework that allows flexibility in setting targets and choosing interventions; and the WTO agreements, which are based on specific rules aimed at minimizing production and trade distortions. As such, it discusses how best to strengthen the mutually supportive role of these multilateral accords.
The report is organized as follows:
Part 1 focuses on the evolution of agricultural trade, its structure and patterns during the period 2000–2016. Understanding the dynamics and trends that drive changes in the pattern of agricultural trade is key for analysing the likely effects of climate change on global agriculture and the linkages between trade and food security.
Part 2 describes how climate change affects agriculture and food security, and how agricultural trade and related policies can contribute to adaptation. It adds to our understanding by providing projections of the likely impact of climate on agricultural production and trade by 2050, highlighting its uneven effects across regions and countries.
Part 3 discusses in depth the interlinkages between the Paris Agreement and the WTO agreements, especially the Agreement on Agriculture. By focusing on their underlying principles, as well as the mechanisms that govern their implementation, the analysis demarcates the policy space within which countries can act, but also identifies potential difficulties.
| viii |
vk.com/id446425943
Part 4 examines in detail issues related to domestic support, such as investments in technologies and their adoption, insurance schemes, market price support and subsidies. These policies, which both directly and indirectly affect adaptation and mitigation in agriculture, are discussed in terms of their likely impact on addressing climate change and food security targets within the context of WTO rules and disciplines.
Part 5 discusses trade policies, such as import tariffs and export restrictions, and the ways these can affect adaptation, especially in the event of weather-induced production shocks, as well as through their impact on the world food market. The analysis also focuses on the use of trade policy in conjunction with mitigation efforts based on a carbon tax, and discusses potential challenges.
Part 6 looks at non-tariff barriers, such as carbon labelling on agricultural products, and examines how measures that can shape consumer preferences with the aim of contributing to mitigation can be implemented within the current rules and disciplines. This part also focuses on the impact of climate change on the incidence of pests and diseases, and examines whether the Sanitary and Phytosanitary Agreement (SPS) provides sufficient policy space for members to adopt appropriate measures in a timely manner.
| ix |

vk.com/id446425943
ACRONYMS
AND ABBREVIATIONS
ACRE |
Agriculture and Climate Risk Enterprise Ltd. |
AFOLU |
Agriculture, forestry and other land use |
AgMIP |
Agricultural Model Intercomparison and |
|
Improvement Project |
AMIS |
Agricultural Market Information System |
AMS |
Aggregate measurement of support |
AoA |
Agreement on Agriculture |
APTERR |
ASEAN Plus Three Emergency Rice Reserve |
ARC |
Agricultural Risk Coverage |
ASEAN |
Association of Southeast Asian Nations |
BTA |
Border tax adjustment |
CA |
Conservation agriculture |
CASU |
Conservation Agriculture Scaling Up Project |
CDM |
Clean Development Mechanism |
CGE |
Computable general equilibrium |
CH4 |
Methane |
CO2 |
Carbon dioxide |
CO2e |
Carbon dioxide equivalent |
Codex |
FAO/WHO Codex Alimentarius |
|
Commission |
COP |
Conference of the Parties |
CSA |
Climate-smart agriculture |
DSB |
Dispute Settlement Body |
DSU |
WTO Understanding on rules and |
|
procedures governing the settlement |
|
of disputes |
ECOWAS Economic Community of |
|
|
West African States |
EDF |
European Development Fund |
ETS |
Emissions trading scheme |
GATT |
General Agreement on Tariffs and Trade |
GCM Global circulation model GDP Gross domestic product
GFSP Global Food Safety Partnership GHG Greenhouse gas
GWP Global warming potential IAM Integrated assessment model
ILO International Labour Organization IMF International Monetary Fund
IPCC Intergovernmental Panel on Climate Change
IPPC International Plant Protection Convention
ISO International Organization for Standardization
LCA Life Cycle Assessment LDCs Least Developed Countries
MAGNET Modular Applied GeNeral Equilibrium Tool
MENA/
NENA Middle East and North Africa/ Near East and North Africa
MFN Most-favoured nation N2O Nitrous oxide
NDC/
INDC Nationally Determined Contribution/ Intended Nationally Determined Contribution
NFIDC Net food-importing developing country NGO Non-governmental organization
NT National treatment NTBs Non-tariff barriers NTMs Non-tariff measures
OIE World Organisation for Animal Health
| x |

vk.com/id446425943
PLC Price Loss Coverage
PPM Processes and production method R&D Research and development
RCP Representative Concentration Pathway REDD Reducing Emissions from Deforestation
and Forest Degradation
SDG Sustainable Development Goal SDT Special and differential treatment
SOCO The State of Agricultural Commodity Markets SPS Sanitary and phytosanitary
SSG Special Agricultural Safeguard SSM Special Safeguard Mechanism
SSP Shared Socio-economic Pathway
STDF Standards and Trade Development Facility TBTs Technical barriers to trade
TFP Total factor productivity
TRIPS Agreement on Trade-Related Aspects of Intellectual Property Rights
UNFCCC United Nations Framework Convention on Climate Change
WB World Bank
WBCIS Weather-based Crop Insurance Scheme WHO World Health Organization
WTO World Trade Organization
| xi |

vk.com/id446425943
EXECUTIVE SUMMARY
CLIMATE CHANGE WILL AFFECT AGRICULTURE AND FOOD SECURITY IN MANY COUNTRIES
Climate change will have significant implications for agriculture and food security. By the middle of this century, higher average temperatures, changes in precipitation, rising sea levels, an increase in the frequency and intensity of extreme weather events, as well as the possibility of an increase in damage from pests and disease, are expected to affect crop and livestock production, as well as fisheries and aquaculture.
This impact will be uneven across regions and countries. In low-latitude regions, where most developing and least developed countries are located, agriculture is already being adversely affected by climate change, specifically, by a higher frequency of droughts and floods. For developing countries, climate change could exacerbate the food security challenges they already experience.
Climate change impacts will be location specific, with significant variations across crops and regions. Arid and semi-arid regions will be exposed to even lower precipitation and higher temperatures and, consequently, experience yield losses. Conversely, countries in temperate areas, many of which have developed economies, are expected to benefit from warmer weather during their growing season. As a result, climate change could exacerbate existing inequalities and further widen the gap between developed and developing countries.
AGRICULTURAL TRADE CAN CONTRIBUTE TO CLIMATE CHANGE ADAPTATION AND MITIGATION EFFORTS
Since the beginning of the twenty-first century, agricultural trade patterns have evolved in line
with economic growth in emerging economies. In the coming years, agricultural trade could undergo further changes, reflecting the uneven and disproportionate impact of climate change on agricultural sectors across the globe. As climate change alters the comparative advantage and competitiveness of agriculture across regions and countries, some nations could lose while others could gain.
International trade could play a particularly important role in adaptation efforts, contributing towards food security in many countries. In the short term, by moving food from surplus to deficit areas, trade can provide an important mechanism to address production shortfalls due to extreme weather events. In the long term, international trade could contribute towards adjusting agricultural production in an efficient manner across countries.
Global agricultural market integration should reinforce the adaptive role of trade in terms of increasing availability of and access to food in the countries that will be negatively affected by climate change. Nevertheless, global agricultural market integration would also affect the distribution of gains and losses between producers and consumers. Small-scale family farmers in low-latitude regions could lose, while consumers of food could gain. A reverse result is expected in temperate regions.
Appropriate agricultural and trade policies are important in strengthening the adaptation role of trade and balancing the multiple objectives of the sector. Agriculture needs both to adjust to the effects of climate change and to reduce its greenhouse gas (GHG) emissions. At the same time, to meet growing demand, agriculture in 2050 will need to produce almost 50 percent more food, feed and biofuel than in 2012. Producing
| xii |

vk.com/id446425943
more with less, while preserving natural resources and enhancing the livelihoods of small-scale family farmers, will be a key challenge for the future.
Transformative changes in agriculture and food systems appear to be economically and technically feasible. Domestic support measures and trade policies can promote productivity growth and ensure that the international trading system is open, fair and transparent. At the same time, these policies should help both agriculture and trade adapt to and mitigate climate change.
Hunger and malnutrition, poverty, and climate change must be addressed together in order to meet Sustainable Development Goal 2 to end hunger, achieve food security and improved nutrition, and promote sustainable agriculture. Multilateral agreements and mechanisms allow for global collective action and encourage the alignment of multiple objectives, such as: eradicating hunger; achieving sustainable agriculture; strengthening global partnerships and cooperation in the context of trade; and fighting climate change.
MULTILATERAL AGREEMENTS: THE MUTUALLY SUPPORTIVE ROLE OF THE PARIS AGREEMENT AND WTO COMMITMENTS FOR AGRICULTURE
In 2015, the Paris Agreement on Climate Change set the long-term goal of keeping the rise in global average temperature to well below 2 °C above pre-industrial levels, recognizing that this would significantly reduce the risks and impacts of climate change. The Agreement also enables each country to determine its own targets and what it considers to be its fair contribution towards limiting the global average temperature increase. Targets, and the general approach to
meeting them, are reflected in the Nationally Determined Contributions (NDCs) – a central component of the Agreement.
There is a clear willingness of countries to respond to climate change by investing in and transforming agriculture sectors. Developing countries in particular highlight the importance of agriculture and food security for adaptation in their NDCs; some countries specify agriculture sectors as important in their mitigation targets. Nevertheless, NDCs remain broad and most do not include specific policies.
Much of the work to translate the Paris Agreement and the NDCs into concrete climate interventions in agriculture is in the making. A wide range of policy instruments is available, from investments in innovative technologies to subsidies that provide incentives to farmers to adopt climate-smart agriculture practices, and regulations to reduce emissions of agricultural activities to carbon taxes. Most of these policy
instruments are covered by the WTO agreements, especially the Agreement on Agriculture, which aims to limit the distortionary impact of support measures on production and trade and to establish a fair and non-discriminatory trading system that will enhance market access and improve the livelihoods of farmers around the world. The challenge will be to strengthen the mutually supportive role of the Paris Agreement and the WTO agreements.
POLICIES TO COMBAT CLIMATE CHANGE AND PROMOTE AGRICULTURAL DEVELOPMENT AND TRADE SHOULD BE INTEGRATED
In principle, there is no fundamental conflict between policies under international climate change frameworks and trade rules. Measures to
| xiii |

vk.com/id446425943
EXECUTIVE SUMMARY
promote adaptation and mitigation in agriculture will be part of broader agricultural and food security policies, and thus will be subject to rules and disciplines of the WTO Agreement on Agriculture (AoA). Significant progress in adaptation and mitigation can be achieved through measures that do not distort trade. These include spending more on innovative technologies and investing in their adoption, as well as extending climate-smart agricultural practices that promote productivity, adapt to climate change and increase carbon sequestration. Expenditure on environmental programmes and ecosystem services that can reduce the negative external effects of emissions generated by agricultural production are additional measures that pose minimal or no distortion to production and trade.
Measures such as market price support and some types of input subsidies can distort trade. But some well-targeted climate-smart subsidies may be an effective instrument to provide incentives to farmers to adopt technologies and practices that promote climate change adaptation and mitigation, or to obtain insurance and hedge against the risks of extreme weather events. Such policies can provide a climate-smart stimulus to agriculture and effectively address the trade-offs between food security and climate change objectives.
Effective climate-smart support to farmers can also improve the comparative advantage of agriculture in countries that will be negatively affected by changing climate, allowing them to become competitive and achieve a better balance in export and import performance. Such measures will be crucial for developing countries that may experience a considerable increase in their net food imports due to climate change. For countries that may be
subject to significant climate-induced problems, safety nets will be necessary both at the international level, to alleviate potential pressures in funding food imports, and at the national level through emergency food reserves and social protection programmes that target the poor and the vulnerable.
Trade policies can contribute towards well-functioning international markets to which countries that experience production shortfalls due to weather shocks can resort in order to ensure food security. Global market integration can reinforce this role of trade in adaptation, as long as trade policies are combined with climate-smart domestic measures and investments.
Trade could also be central in climate change mitigation efforts. If trade could provide the necessary signals to farmers to produce low carbon footprint products, emissions could be reduced globally. In practice, this would necessitate the imposition of a carbon tax (or an equivalent mitigation measure) on agricultural products domestically, combined with a corresponding tariff adjustment at the border to discriminate against high carbon footprint imports. Although WTO provisions offer flexibility for waivers or exemptions from complying with the non-discrimination principle, difficulties in the interpretation and application of these provisions could arise due to the lack of an internationally agreed definition and measurement of carbon footprint. Nevertheless, alternative options include carbon labelling of agricultural products that could shape consumer preferences and contribute to reducing emissions from agriculture.
While sufficient space for policy discussions needs to be pursued at the intersection of the WTO and the Paris Agreement, policies should
| xiv |

vk.com/id446425943
not negatively impact on other countries, especially developing ones, by restricting trade. Developed countries are clearly in a different position when making their choices than low-income developing countries. This is especially true for developing countries where agriculture is characterized by high emissions and will be particularly hit by climate change both in terms of production and of increase in pests and diseases. The different challenges faced by developed and developing countries are
recognized in the Paris Agreement and in the WTO agreements through the principle of differentiated responsibilities and respective capabilities, and the special and differential treatment of developing countries, respectively.
Discussing and implementing policies for climate change adaptation and mitigation will enable the transformative change that is necessary to make agriculture meet the challenges of our time.
| xv |

vk.com/id446425943
FIUMICINO, ITALY
Orto Sole cooperative farm and market in Fiumicino is located in a protected historical site made of sandy soils that require optimized water resource management and climate-smart adaptation techniques to preserve soil structure.
©FAO/Alessandra Benedetti

vk.com/id446425943
CHAPARTTER 1 AGRICULTURAL TRADE:
KEY DYNAMICS AND TRENDS
Key points
1 Agricultural trade has increased significantly in value terms since 2000.
Fast agricultural trade growth rates between 2000 and 2008 gave in to contractions during 2009–2012 and to sluggish growth since then.
2 The role of emerging economies in global agricultural markets has increased
since 2000. Growing income per capita and reduced poverty boosted food consumption and imports, while increases in agricultural productivity led to growing exports.
3 Developing countries are increasingly participating in international markets.
South−South agricultural trade has also expanded significantly. For Least Developed Countries, agricultural imports have grown faster than exports.

vk.com/id446425943
PART 1
AGRICULTURAL TRADE:
KEY DYNAMICS AND TRENDS
Since the beginning of the twenty-first century, world agricultural markets have evolved significantly. Strong economic growth in emerging economies has driven the demand for agricultural products globally. In emerging economies and developing countries, changes in both income and its distribution have also led to changes in consumption patterns.
Global production has continued to increase to meet demand and trade has expanded significantly, with its composition and pattern following changes in demand and the emergence of new agricultural exporters and importers. The increased importance of emerging economies such as Brazil, China, India, Indonesia and the Russian Federation has been a major development in world agricultural markets. Changes in trade patterns also include increased trade between developing countries. Understanding the dynamics and trends that drive changes in the pattern and composition of agricultural trade is key for analysis of the effects of climate change in world agricultural markets and the linkages between trade and food security. n
THE EVOLUTION OF AGRICULTURAL TRADE: 2000–2016
Between 2000 and 2016, world agricultural trade increased more than threefold in value. On average, trade in agricultural products exhibited an annual growth rate of over 6 percent, rising to USD 1.6 trillion in 2016 from USD 570 billion in 2000 (Figure 1.1). This trend has been driven by economic growth – world gross domestic product (GDP) has also doubled since 2000 – population growth, advances in transport, information and
communication technology, and improvements in market access.
Growth in trade is related to economic performance. Since the financial crisis of 2008, world merchandise trade (comprising fuel and mining products, agricultural products and manufactured goods) has been sluggish due to weak economic growth. Agricultural trade has been more resilient than fuel and mining products and manufactured goods, where a reduction in investment and the resultant weak aggregate demand has slowed trade. Investment, the most import-intensive component of GDP, has been particularly weak in developed economies since the financial crisis.1
Indeed, there are suggestions that the elasticity of trade with respect to GDP has declined. During the period 2001–2007, before the financial crisis, a
1 percent increase in income was estimated to result in a 1.5 percent increase in the volume of trade. In the period 2008–2013, a similar increase in income increased trade by 0.7 percent. These differences in the response of trade to income could be due to either a smaller share of investment in aggregate demand, or a slower rate of global value chains development.2 For agricultural trade, they could also be due to growing protectionism, including changes in domestic support policies, in the wake of the food price spikes of 2008 and 2011.
Trade in agricultural products is less affected by changes in investment behaviour compared to fuels and mineral products and manufactures, and more directly related to population growth and income changes. The positive trend in agricultural trade since 2002 was abruptly interrupted in 2008 by the global recession, and although it recovered in 2010 and 2011, the slowdown in the global economy, especially in emerging economies such as China, affected
| 2 |
vk.com/id446425943
THE STATE OF AGRICULTURAL COMMODITY MARKETS 2018
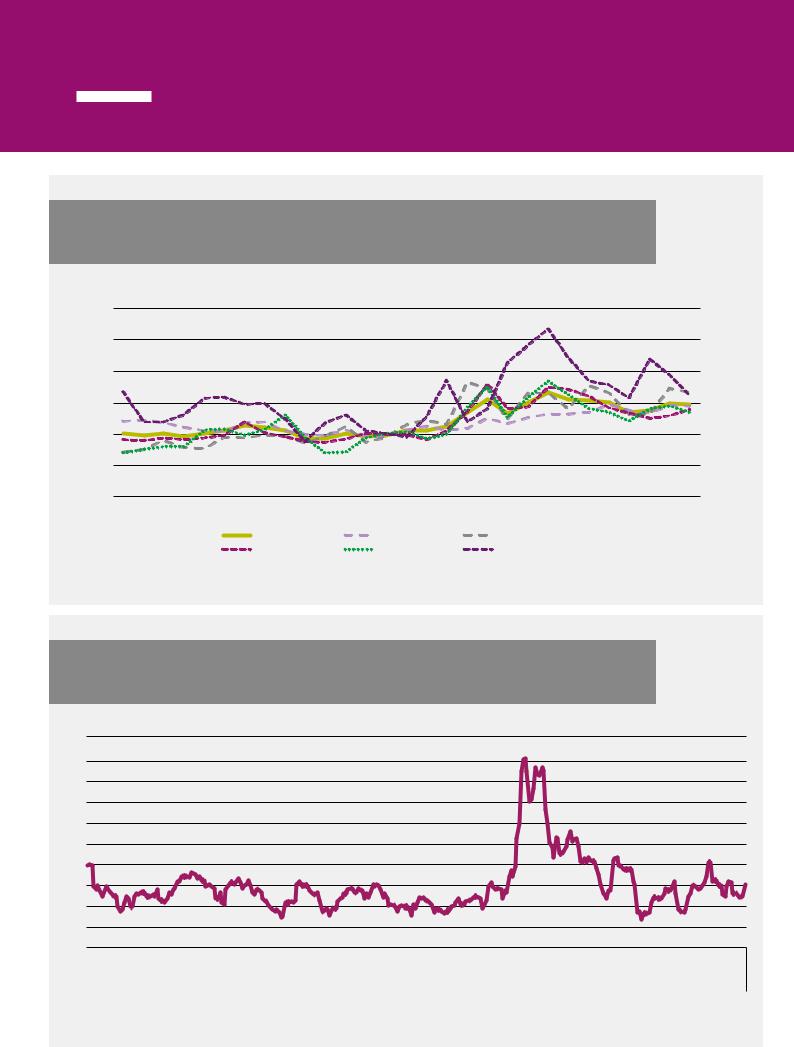
FIGURE 1.1
WORLD MERCHANDISE TRADE VALUE AND WORLD GDP: ANNUAL GROWTH RATES, 2000–2016
MERCHANDISE TRADE VALUE GROWTH RATE, %
40 |
|
|
|
|
|
|
|
|
|
|
|
|
|
|
|
|
|
|
|
|
|
|
|
|
|
|
|
|
|
|
|
|
|
|
|
|
|
|
|
5 |
|
|
|
|
|
|
|
|
|
|
|
|
|
|
|
|
|
|
|
|
|
|
|
|
|
|
|
|
|
|
|
|
|
|
|
|
|
|
|
||
30 |
|
|
|
|
|
|
|
|
|
|
|
|
|
|
|
|
|
|
|
|
|
|
|
|
|
|
|
|
|
|
|
|
|
|
|
|
|
|
|
|
|
|
|
|
|
|
|
|
|
|
|
|
|
|
|
|
|
|
|
|
|
|
|
|
|
|
|
|
|
|
|
|
|
|
|
|
4 |
||||
|
|
|
|
|
|
|
|
|
|
|
|
|
|
|
|
|
|
|
|
|
|
|
|
|
|
|
|
|
|
|
|
|
|
|
|
|
||||
20 |
|
|
|
|
|
|
|
|
|
|
|
|
|
|
|
|
|
|
|
|
|
|
|
|
|
|
|
|
|
|
|
|
|
|
|
|
|
|
|
|
|
|
|
|
|
|
|
|
|
|
|
|
|
|
|
|
|
|
|
|
|
|
|
|
|
|
|
|
|
|
|
|
|
|
|
|
3 |
||||
10 |
|
|
|
|
|
|
|
|
|
|
|
|
|
|
|
|
|
|
|
|
|
|
|
|
|
|
|
|
|
|
|
|
|
|
|
|
||||
|
|
|
|
|
|
|
|
|
|
|
|
|
|
|
|
|
|
|
|
|
|
|
|
|
|
|
|
|
|
|
|
|
|
|
|
|
|
|
|
|
|
|
|
|
|
|
|
|
|
|
|
|
|
|
|
|
|
|
|
|
|
|
|
|
|
|
|
|
|
|
|
|
|
|
|
|
2 |
||||
0 |
|
|
|
|
|
|
|
|
|
|
|
|
|
|
|
|
|
|
|
|
|
|
|
|
|
|
|
|
|
|
|
|
|
|
|
|
||||
|
|
|
|
|
|
|
|
|
|
|
|
|
|
|
|
|
|
|
|
|
|
|
|
|
|
|
|
|
|
|
|
|
|
|
|
|
|
|
|
|
-10 |
|
|
|
|
|
|
|
|
|
|
|
|
|
|
|
|
|
|
|
|
|
|
|
|
|
|
|
|
|
|
|
|
|
|
|
|
|
|
|
1 |
|
|
|
|
|
|
|
|
|
|
|
|
|
|
|
|
|
|
|
|
|
|
|
|
|
|
|
|
|
|
|
|
|
|
|
|
|
|
|||
-20 |
|
|
|
|
|
|
|
|
|
|
|
|
|
|
|
|
|
|
|
|
|
|
|
|
|
|
|
|
|
|
|
|
|
|
|
|
|
|
|
|
|
|
|
|
|
|
|
|
|
|
|
|
|
|
|
|
|
|
|
|
|
|
|
|
|
|
|
|
|
|
|
|
|
|
|
|
0 |
||||
|
|
|
|
|
|
|
|
|
|
|
|
|
|
|
|
|
|
|
|
|
|
|
|
|
|
|
|
|
|
|
|
|
|
|
|
|
||||
-30 |
|
|
|
|
|
|
|
|
|
|
|
|
|
|
|
|
|
|
|
|
|
|
|
|
|
|
|
|
|
|
|
|
|
|
|
|
|
|
|
|
|
|
|
|
|
|
|
|
|
|
|
|
|
|
|
|
|
|
|
|
|
|
|
|
|
|
|
|
|
|
|
|
|
|
|
|
-1 |
||||
-40 |
|
|
|
|
|
|
|
|
|
|
|
|
|
|
|
|
|
|
|
|
|
|
|
|
|
|
|
|
|
|
|
|
|
|
|
|
||||
|
|
|
|
|
|
|
|
|
|
|
|
|
|
|
|
|
|
|
|
|
|
|
|
|
|
|
|
|
|
|
|
|
|
|
|
|
|
|
|
|
|
|
|
|
|
|
|
|
|
|
|
|
|
|
|
|
|
|
|
|
|
|
|
|
|
|
|
|
|
|
|
|
|
|
|
|
-2 |
||||
-50 |
|
|
|
|
|
|
|
|
|
|
|
|
|
|
|
|
|
|
|
|
|
|
|
|
|
|
|
|
|
|
|
|
|
|
|
|
||||
|
|
|
|
|
|
|
|
|
|
|
|
|
|
|
|
|
|
|
|
|
|
|
|
|
|
|
|
|
|
|
|
|
|
|
|
|
|
|
|
|
-60 |
|
|
|
|
|
|
|
|
|
|
|
|
|
|
|
|
|
|
|
|
|
|
|
|
|
|
|
|
|
|
|
|
|
|
|
|
|
|
|
-3 |
2001 |
2002 |
2003 |
2004 |
2005 |
2006 |
2007 |
2008 |
2009 |
|
2010 |
2011 |
2012 |
2013 |
2014 |
2015 |
2016 |
|
|||||||||||||||||||||||
GDP GROWTH RATE, %
|
Agriculture |
|
Fuel and mining products |
|
Manufacturing products |
|
GDP Growth |
SOURCE: FAO calculations using WTO Statistics and World Development Indicators, (World Bank). Agricultural trade comprises products covered by the Agreement on Agriculture, Annex 1, that is, it includes food and agricultural raw materials and excludes fish and forestry.
trade and commodity prices significantly. The unprecedented growth in demand for agricultural products over the last decade was fuelled by growth in China and increases in biofuel production worldwide. The recent slowdown in Chinese income and demand growth, and the decline in the propensity of households to spend additional income on food, in turn, led to a decline in global agricultural trade by 11 percent in 2015, although this rebounded to show a
1 percent increase in 2016.
Prices reflect the fundamental forces of supply and demand and shape global trade. Since 2000,
increasing prices of agricultural commodities, as well as the 2008 and 2011 price surges, were the result of structural changes in global agricultural markets (Figure 1.2). Strong demand for food and feed, declining stock-to-use ratios and expanding production in biofuels combined to give rise to market shocks and price volatility. Since then, agricultural prices have declined, although they are still higher than in 2007. In 2015 and 2016, world prices also reflected the appreciation of the US dollar. Markets are also calmer and price volatility has declined significantly compared with the violent price episodes of 2008–11 (Figure 1.3). »
| 3 |
vk.com/id446425943
PART 1 AGRICULTURAL TRADE: KEY DYNAMICS AND TRENDS
FIGURE 1.2
AGRICULTURAL PRICE INDICES, 1990–2018 (2002–2004=100)
300
250
200
150
100
50
0
1990 |
1991 |
1992 |
1993 |
1994 |
1995 |
1996 |
1997 |
1998 |
1999 |
2000 |
2001 |
2002 |
2003 |
2004 |
2005 |
2006 |
2007 |
2008 |
2009 |
2010 |
2011 |
2012 |
2013 |
2014 |
2015 |
2016 |
2017 |
2018 |
|
|
|
|
|
|
|
Food Price Index |
|
|
|
Meat Price Index |
|
|
|
Dairy Price Index |
|
|
|
|
|
|
|
||||||
|
|
|
|
|
|
|
Cereals Price Index |
|
|
Oils Price Index |
|
|
|
Sugar Price Index |
|
|
|
|
|
|
|
|||||||
SOURCE: FAO Food Price Index, World Food Situation (http://www.fao.org/worldfoodsituation/foodpricesindex/en/)
FIGURE 1.3
FOOD PRICE INDEX VOLATILITY, JANUARY 1991–DECEMBER 2017 (PERCENT)
PERCENT
10
9
8
7
6
5
4
3
2
1
0
1/1991 5/1991 9/1991 1/1992 5/1992 9/1992 1/1993 5/1993 9/1993 1/1994 5/1994 9/1994 1/1995 5/1995 9/1995 1/1996 5/1996 9/1996 1/1997 5/1997 9/1997 1/1998 5/1998 9/1998 1/1999 5/1999 9/1999 1/2000 5/2000 9/2000 1/2001 5/2001 9/2001 1/2002 5/2002 9/2002 1/2003 5/2003 9/2003 1/2004 5/2004 9/2004 1/2005 5/2005 9/2005 1/2006 5/2006 9/2006 1/2007 5/2007 9/2007 1/2008 5/2008 9/2008 1/2009 5/2009 9/2009 1/2010 5/2010 9/2010 1/2011 5/2011 9/2011 1/2012 5/2012 9/2012 1/2013 5/2013 9/2013 1/2014 5/2014 9/2014 1/2015 5/2015 9/2015 1/2016 5/2016 9/2016 1/2017 |
5/2017 |
9/2017 |
|||||||||||||||||||||||||||||||||||||||||||||||||||
|
1992 |
|
1993 |
|
1994 |
|
1995 |
|
1996 |
|
1997 |
|
1998 |
|
1999 |
|
2000 |
|
2001 |
|
2002 |
|
2003 |
|
2004 |
|
2005 |
|
2006 |
|
2007 |
|
2008 |
|
2009 |
|
2010 |
|
2011 |
|
2012 |
|
2013 |
|
2014 |
|
2015 |
|
2016 |
|
2017 |
||
|
1991 |
|
|
|
|
|
|
|
|
|
|
|
|
|
|
|
|
|
|
|
|
|
|
|
|
|
|||||||||||||||||||||||||||
SOURCE: FAO, monthly food price indices (2002−2004=100), computed every 12 months
| 4 |

vk.com/id446425943
THE STATE OF AGRICULTURAL COMMODITY MARKETS 2018
TABLE 1.1
MAJOR IMPORTERS OF AGRICULTURAL PRODUCTS: SHARE OF TOTAL IMPORT VALUE, 2016 AND 2000
|
2016 |
|
|
|
2000 |
|
|
Rank |
Share |
|
Rank |
Share |
|
European Union |
1 |
39.1 |
European Union |
1 |
45.3 |
|
(Member Organization) |
(Member Organization) |
|||||
|
|
|
|
|||
|
|
|
|
|
|
|
United States of America |
2 |
10.1 |
United States of America |
2 |
10.1 |
|
|
|
|
|
|
|
|
China |
3 |
8.2 |
Japan |
3 |
8.7 |
|
|
|
|
|
|
|
|
Japan |
4 |
4.2 |
Canada |
4 |
2.8 |
|
|
|
|
|
|
|
|
Canada |
5 |
2.7 |
Mexico |
5 |
2.3 |
|
|
|
|
|
|
|
|
Mexico |
6 |
2 |
China |
6 |
2.3 |
|
|
|
|
|
|
|
|
China, Hong Kong SAR |
7 |
1.9 |
China, Hong Kong SAR |
7 |
2 |
|
|
|
|
|
|
|
|
India |
8 |
1.9 |
Republic of Korea |
8 |
2 |
|
|
|
|
|
|
|
|
Republic of Korea |
9 |
1.9 |
Russian Federation |
9 |
1.7 |
|
|
|
|
|
|
|
|
Russian Federation |
10 |
1.9 |
Saudi Arabia |
10 |
1.2 |
|
|
|
|
|
|
|
|
Indonesia |
11 |
1.4 |
Switzerland |
11 |
1.2 |
|
|
|
|
|
|
|
|
Viet Nam |
12 |
1.3 |
Indonesia |
12 |
1 |
|
|
|
|
|
|
|
|
United Arab Emirates |
13 |
1.2 |
Brazil |
13 |
0.9 |
|
|
|
|
|
|
|
|
Malaysia |
14 |
1.1 |
Malaysia |
14 |
0.8 |
|
|
|
|
|
|
|
|
Australia |
15 |
1 |
Egypt |
15 |
0.8 |
|
|
|
|
|
|
|
|
Turkey |
16 |
1 |
Turkey |
16 |
0.8 |
|
|
|
|
|
|
|
|
Switzerland |
17 |
0.9 |
India |
17 |
0.7 |
|
|
|
|
|
|
|
|
Singapore |
18 |
0.9 |
Thailand |
18 |
0.7 |
|
|
|
|
|
|
|
|
Thailand |
19 |
0.9 |
Philippines |
19 |
0.6 |
|
|
|
|
|
|
|
|
Saudi Arabia |
20 |
0.9 |
Algeria |
20 |
0.6 |
|
|
|
|
|
|
|
|
Total |
|
84.5 |
Total |
|
86.5 |
|
|
|
|
|
|
|
SOURCE: FAO calculations using data from World Integrated Trade Solution (accessed February 2018). Agricultural trade comprises products covered by the Agreement on Agriculture, Annex 1.
»The increasing importance of emerging economies has been a major development in global agricultural markets since 2000. China’s share of world imports increased from 2.3 percent in 2000 to 8.2 percent in 2016, placing it third in the ranking of the top twenty importers after the United States of America and the European Union (Member Organization) (Table 1.1). Between 2000 and 2016, other emerging economies, such as India, Indonesia, and the Russian Federation increased their aggregate share in global imports from 3.4 percent to 5.2 percent. Developed economies such as the European Union (Member Organization) and Japan experienced a decline in their share of total global import value, although they remained high up the ranking of the top twenty importers.
Changes in export patterns clearly underline the increasing importance of emerging economies in global agricultural markets (Table 1.2). Although traditional exporters such as the European Union (Member Organization) and the United States of America remain at the top of the ranking in terms of the share of total export value, Brazil increased its share from 3.2 percent in 2000 to 5.7 percent in 2016. China became the fourth most important exporter, increasing its share of total export value from 3.0 percent in 2000 to 4.2 percent in 2016.
Together with Brazil and China the emerging economies of India and Indonesia have increased their agricultural exports substantially. In 2016, these four countries accounted for 14.5 percent of global export value compared with 8.5 percent in 2000.
| 5 |

vk.com/id446425943
PART 1 AGRICULTURAL TRADE: KEY DYNAMICS AND TRENDS
TABLE 1.2
MAJOR EXPORTERS OF AGRICULTURAL PRODUCTS: SHARE OF TOTAL EXPORT VALUE, 2016 AND 2000
|
2016 |
|
|
|
2000 |
|
|
Rank |
Share |
|
Rank |
Share |
|
European Union |
1 |
41.1 |
European Union |
1 |
46.9 |
|
(Member Organization) |
(Member Organization) |
|||||
|
|
|
|
|||
|
|
|
|
|
|
|
United States of America |
2 |
11 |
United States of America |
2 |
14 |
|
|
|
|
|
|
|
|
Brazil |
3 |
5.7 |
Canada |
3 |
3.9 |
|
|
|
|
|
|
|
|
China |
4 |
4.2 |
Australia |
4 |
3.7 |
|
|
|
|
|
|
|
|
Canada |
5 |
3.4 |
Brazil |
5 |
3.2 |
|
|
|
|
|
|
|
|
Argentina |
6 |
2.8 |
China |
6 |
3.0 |
|
|
|
|
|
|
|
|
Australia |
7 |
2.5 |
Argentina |
7 |
2.7 |
|
|
|
|
|
|
|
|
Indonesia |
8 |
2.4 |
Mexico |
8 |
1.9 |
|
|
|
|
|
|
|
|
Mexico |
9 |
2.3 |
New Zealand |
9 |
1.6 |
|
|
|
|
|
|
|
|
India |
10 |
2.2 |
Thailand |
10 |
1.5 |
|
|
|
|
|
|
|
|
Thailand |
11 |
2.0 |
Malaysia |
11 |
1.4 |
|
|
|
|
|
|
|
|
Malaysia |
12 |
1.8 |
India |
12 |
1.2 |
|
|
|
|
|
|
|
|
New Zealand |
13 |
1.6 |
Indonesia |
13 |
1.1 |
|
|
|
|
|
|
|
|
Viet Nam |
14 |
1.3 |
Turkey |
14 |
0.9 |
|
|
|
|
|
|
|
|
Turkey |
15 |
1.3 |
Colombia |
15 |
0.7 |
|
|
|
|
|
|
|
|
Russian Federation |
16 |
1.1 |
Chile |
16 |
0.7 |
|
|
|
|
|
|
|
|
Chile |
17 |
0.9 |
Singapore |
17 |
0.7 |
|
|
|
|
|
|
|
|
Singapore |
18 |
0.8 |
Viet Nam |
18 |
0.6 |
|
|
|
|
|
|
|
|
Switzerland |
19 |
0.7 |
South Africa |
19 |
0.6 |
|
|
|
|
|
|
|
|
South Africa |
20 |
0.7 |
Switzerland |
20 |
0.6 |
|
|
|
|
|
|
|
|
Total |
|
89.8 |
Total |
|
90.9 |
|
|
|
|
|
|
|
SOURCE: FAO’s calculations using data from World Integrated Trade Solution (accessed February 2018). Agricultural trade comprises products covered by the Agreement on Agriculture, Annex 1.
During the same period, the combined share in total export value of the United States of America, the European Union (Member Organization), Australia and Canada – all traditional exporters – declined by ten percentage points from 68.5 percent in 2000 to 58.0 percent in 2016.
The increased participation of emerging economies in global agricultural trade reflects the pace of structural change along the development path. During the last two decades, rapid economic growth and increases in per capita income in these economies fuelled the demand for agricultural products and, in conjunction with their large populations, led to significant increases in imports.
For example in India, GDP per capita increased from USD 770 in 2000 to USD 1 751 in 2015 (measured in 2010 prices). Between 2004 and 2011, the poverty headcount ratio – the proportion of the population living on less than USD 1.90 a day – declined from 38.2 percent to 21.2 percent. Such income increases paired with poverty reduction boosted the demand for food and resulted in increased agricultural imports. Between 2000 and 2015, GDP per capita in China increased from USD 1 771 to USD 6 498 (measured in 2010 prices), while a significant number of people were lifted out of poverty – the poverty headcount ratio declined from
31.9 percent in 2002 to 1.8 percent in 2013. These emerging economies will remain significant
| 6 |
vk.com/id446425943
THE STATE OF AGRICULTURAL COMMODITY MARKETS 2018
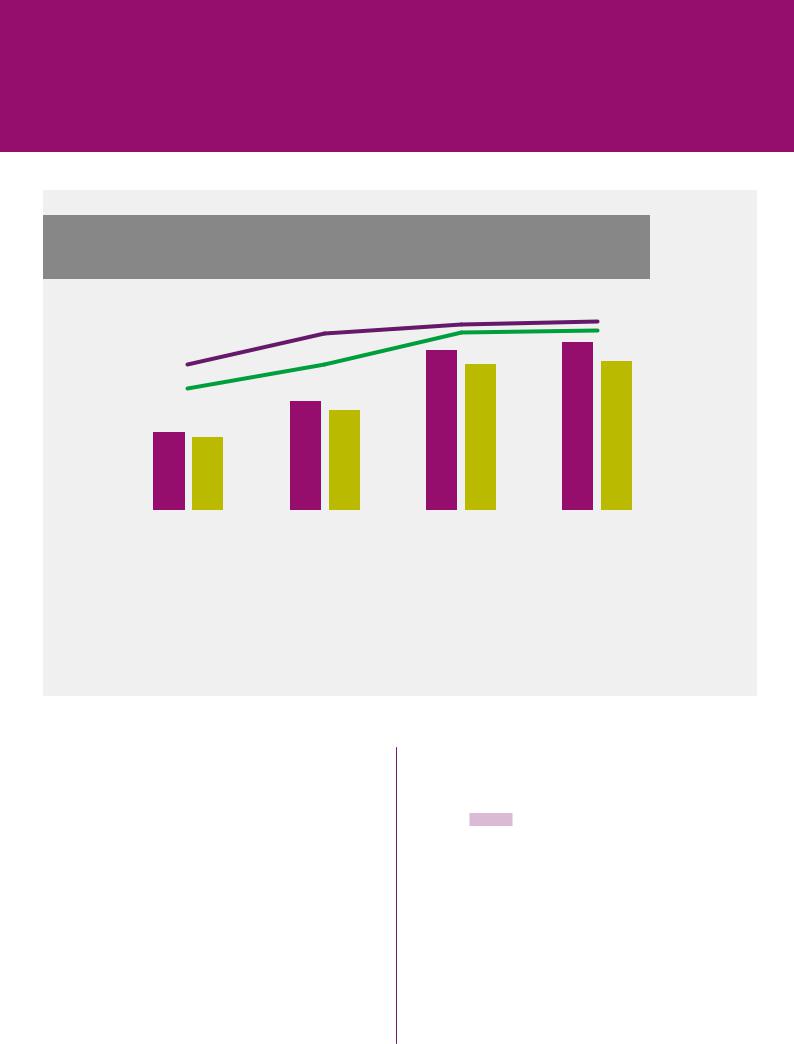
FIGURE 1.4
EVOLUTION OF SOUTH–SOUTH AGRICULTURAL TRADE, 2000–2015
PERCENTAGE OF GLOBAL TRADE VALUE
25 |
|
|
|
|
60 |
|
|
|
|
||
20 |
|
|
|
50 |
|
|
|
|
|
|
|
|
|
|
40 |
||
|
|
|
|
||
15 |
|
|
|
|
|
|
|
|
30 |
||
|
|
|
|
||
10 |
|
|
|
|
|
|
|
|
20 |
||
|
|
|
|
||
5 |
|
|
|
|
|
|
|
|
10 |
||
|
|
|
|
||
0 |
|
|
|
|
0 |
|
|
|
|
||
2000 |
2005 |
2010 |
2015 |
|
|
|
Lowand middle-income countries' exports (percent of global value) |
|
South−South exports (percent of lowand middle-income countries’ total trade) |
|
|
Lowand middle-income countries' imports (percent of global value) |
|
|
South−South imports (percent of lowand middle-income countries’ total trade) |
PERCENTAGE OF LOWAND MIDDLE-INCOME COUNTRIES' TOTAL TRADE
SOURCE: FAO calculations using data from World Integrated Trade Solution (accessed February 2018). South countries comprise the World Bank country groups of middleand low-income countries and non-WTO countries. Agricultural trade comprises products covered by the Agreement on Agriculture, Annex 1.
importers of agricultural products, although their imports are likely to grow at a slower pace, as the propensity to spend additional income on food diminishes with higher per capita income.
At the same time, agricultural productivity growth in emerging economies fuelled production and exports. In Brazil, agricultural value added per worker more than doubled between 2000 and 2015
– from USD 4 578 to USD 11 149 (measured in 2010 prices) – with the country’s global export value share also rising. Increases in productivity in the agricultural sectors of China, India and Indonesia also boosted production and exports, further increasing the participation of these countries in global agricultural trade.
Exports from middleand low-income countries increased from 9.4 percent of global agricultural
trade value in 2000 to 20.1 percent in 2015. Imports followed a similar trend – large emerging economies, in particular Brazil, China, India and Indonesia, have been the main engines of this growth (Figure 1.4).
A key feature of the increased participation of middleand low-income countries in global agricultural markets has been the rapid growth of South–South trade — that is, trade in agricultural products within the middleand low-income countries group. The share of imports by middleand low-income countries sourced from other middleand low-income countries increased from 41.9 percent in 2000 to 54.4 percent in 2015. During the same period, exports followed a similar trend. By 2015, about half of the exports of middleand low-income countries were destined for other ‘South’ countries.
| 7 |
vk.com/id446425943
PART 1 AGRICULTURAL TRADE: KEY DYNAMICS AND TRENDS
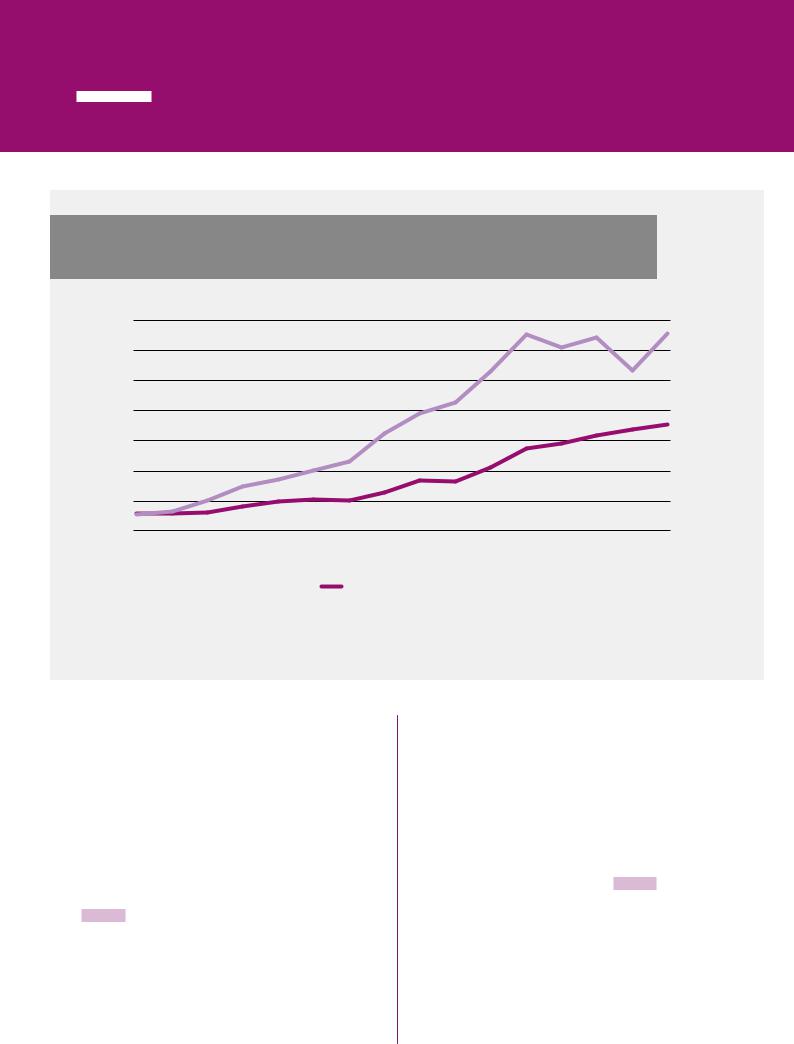
FIGURE 1.5
LEAST DEVELOPED COUNTRIES: AGRICULTURAL TRADE (USD BILLION), 2000–2015
BILLIONS USD
35
30
25
20
15
10
5
0
2000 |
2001 |
2002 |
2003 |
2004 |
2005 |
2006 |
2007 |
2008 |
2009 |
2010 |
2011 |
2012 |
2013 |
2014 |
2015 |
Export |
|
Import |
|
SOURCE: FAO calculations using data from World Integrated Trade Solution (accessed February 2018). Data have been aggregated in line with the list of Least Developed Countries as identified by the United Nations Committee for Development Policy, Development Policy and Analysis Division, Department of Economic and Social Affairs. Agricultural trade comprises products covered by the Agreement on Agriculture, Annex 1.
Within this group, Least Developed Countries (LDCs) face significant challenges. Agriculture is central to LDCs, accounting for between 30 and 60 percent of GDP, providing employment for more people than any other economic sector and underpinning their food security, export earnings and development.
The agricultural imports of LDCs saw a huge increase from about USD 2.5 billion in 2000 to about USD 32.8 billion in 2015, accounting for 2.5 percent of global agricultural import value (Figure 1.5). Exports exhibited a weaker trend, amounting to just 1.4 percent of global export value and widening the LDCs’ trade deficit in agricultural products to about USD 15 billion in 2015. LDCs export mostly unprocessed and predominantly primary agricultural commodities, including coffee, tea, cotton, jute, spices and bananas.
Income grew by roughly 3.4 percent per annum for the LDC group as a whole. However, it was primarily population growth, averaging
2.4 percent per annum, that strengthened the demand for food and boosted imports. In fact, sluggish agricultural productivity that could not keep pace with population growth is the reason why, over the years, most LDCs have changed from being net agricultural exporters to net agricultural importers. This is particularly evident for sub-Saharan Africa (Figure 1.6). LDCs continue to experience limited gains in productivity and competitiveness. Poor infrastructure, lack of productive technologies, lack of access to inputs and weak institutions combine to hinder productivity growth. Productivity levels are significantly below what could be achieved by using the best practices and technology available. Since 2000, agricultural productivity growth has been weak. In LDCs as a whole, value added per worker in
| 8 |

vk.com/id446425943
THE STATE OF AGRICULTURAL COMMODITY MARKETS 2018
FIGURE 1.6
SUB-SAHARAN AFRICA: NET AGRICULTURAL TRADE (USD BILLION), 2000–2013
VALUE OF EXPORTS AND IMPORTS
60 |
|
|
|
|
|
|
|
|
|
|
|
|
|
|
|
|
|
|
|
|
|
|
|
|
|
|
|
|
|
|
|
|
|
4 |
|||
|
|
|
|
|
|
|
|
|
|
|
|
|
|
|
|
|
|
|
|
|
|
|
|
|
|
|
|
|
|
|
|
|
|||||
50 |
|
|
|
|
|
|
|
|
|
|
|
|
|
|
|
|
|
|
|
|
|
|
|
|
|
|
|
|
|
|
|
|
2 |
||||
|
|
|
|
|
|
|
|
|
|
|
|
|
|
|
|
|
|
|
|
|
|
|
|
|
|
|
|
|
|
|
|
|
|
|
|
|
|
|
|
|
|
|
|
|
|
|
|
|
|
|
|
|
|
|
|
|
|
|
|
|
|
|
|
|
|
|
|
|
|
0 |
|||||
|
|
|
|
|
|
|
|
|
|
|
|
|
|
|
|
|
|
|
|
|
|
|
|
|
|
|
|
|
|
|
|
|
|||||
40 |
|
|
|
|
|
|
|
|
|
|
|
|
|
|
|
|
|
|
|
|
|
|
|
|
|
|
|
|
|
|
|
|
|
|
|
|
|
|
|
|
|
|
|
|
|
|
|
|
|
|
|
|
|
|
|
|
|
|
|
|
|
|
|
|
|
|
|
|
|
-2 |
|||||
|
|
|
|
|
|
|
|
|
|
|
|
|
|
|
|
|
|
|
|
|
|
|
|
|
|
|
|
|
|
|
|
|
|||||
30 |
|
|
|
|
|
|
|
|
|
|
|
|
|
|
|
|
|
|
|
|
|
|
|
|
|
|
|
|
|
|
|
|
|
|
|
-4 |
|
|
|
|
|
|
|
|
|
|
|
|
|
|
|
|
|
|
|
|
|
|
|
|
|
|
|
|
|
|
|
|
|
|
|
||||
20 |
|
|
|
|
|
|
|
|
|
|
|
|
|
|
|
|
|
|
|
|
|
|
|
|
|
|
|
|
|
|
|
|
-6 |
||||
|
|
|
|
|
|
|
|
|
|
|
|
|
|
|
|
|
|
|
|
|
|
|
|
|
|
|
|
|
|
|
|
|
|
|
|
|
|
|
|
|
|
|
|
|
|
|
|
|
|
|
|
|
|
|
|
|
|
|
|
|
|
|
|
|
|
|
|
|
|
-8 |
|||||
|
|
|
|
|
|
|
|
|
|
|
|
|
|
|
|
|
|
|
|
|
|
|
|
|
|
|
|
|
|
|
|
|
|||||
10 |
|
|
|
|
|
|
|
|
|
|
|
|
|
|
|
|
|
|
|
|
|
|
|
|
|
|
|
|
|
|
|
|
|
|
|
|
|
|
|
|
|
|
|
|
|
|
|
|
|
|
|
|
|
|
|
|
|
|
|
|
|
|
|
|
|
|
|
|
|
-10 |
|||||
|
|
|
|
|
|
|
|
|
|
|
|
|
|
|
|
|
|
|
|
|
|
|
|
|
|
|
|
|
|
|
|
|
|||||
0 |
|
|
|
|
|
|
|
|
|
|
|
|
|
|
|
|
|
|
|
|
|
|
|
|
|
|
|
|
|
|
|
|
|
-12 |
|||
|
|
|
|
|
|
|
|
|
|
|
|
|
|
|
|
|
|
|
|
|
|
|
|
|
|
|
|
|
|
|
|
|
|||||
2000 |
2001 |
2002 |
2003 |
2004 |
2005 |
2006 |
2007 |
2008 |
2009 |
2010 |
2011 |
2012 |
2013 |
|
|
||||||||||||||||||||||
VALUE OF NET TRADE
|
Export |
|
Import |
|
Net |
SOURCE: FAO calculations using FAOSTAT data on crop and livestock products trade.
agriculture increased by 2.0 percent a year, from USD 490 in 2000 to USD 657 in 2015. n
AGRICULTURAL POLICY TRENDS
The expansion of agricultural trade since 2000 was also facilitated by improvements in market access as a result of the 1995 WTO AoA. Average applied tariff levels declined as countries met their commitments under the Agreement, but also as a result of bilateral and regional trade agreements and unilateral policy changes
(Figure 1.7). Nevertheless, this average hides considerable variation in border protection on individual products across countries. A number of countries have maintained substantially high import barriers for products such as dairy, rice and sugar, which have historically been highly protected.3
Trade-distorting domestic support in major developed countries has fallen since 2000 with the implementation of the AoA, which limits expenditure on such measures through the Total Aggregate Measurement of Support (see Table 3.1). Support that distorts trade, such as market price support or payments coupled with output and input subsidies, declined particularly in the European Union (Member Organization), where around 68 percent of its support consisted of minimally or
non-distorting decoupled payments in 2014, compared with around 35 percent in 2000.4
In some developed economies, such as those within the European Union (Member Organization), the reduction of trade-distorting support was accompanied by an increase in expenditure on so-called ‘Green Box’ measures (see Tables 3.1 and 4.1), such as direct payments to farmers that are decoupled from production. »
| 9 |
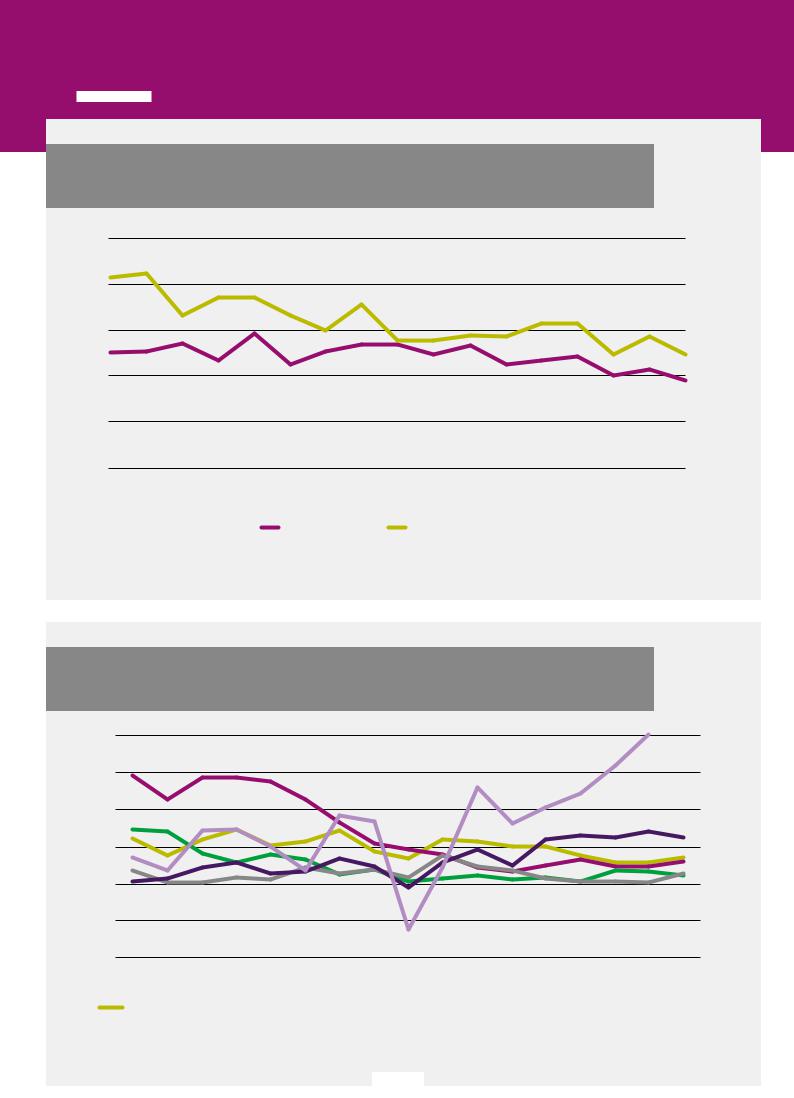
vk.com/id446425943
PART 1 AGRICULTURAL TRADE: KEY DYNAMICS AND TRENDS
FIGURE 1.7
AVERAGE AGRICULTURAL APPLIED TARIFF RATES, WEIGHTED AVERAGE (PERCENT), 2000–2016
25
20
15
10
5
0
2000 2001 2002 2003 2004 2005 2006 2007 2008 2009 2010 2011 2012 2013 2014 2015 2016
High-income countries Lowand middle-income countries
SOURCE: FAO calculations using data from World Integrated Trade Solution (accessed February 2018). Definitions of high-income, and middleand low-income countries follow the classification of the World Bank.
FIGURE 1.8
PRODUCER NOMINAL PROTECTION COEFFICIENT, 2000–2016
1.4
1.3
1.2
1.1
1
0.9
0.8
2000 |
2001 |
2002 |
2003 |
2004 |
2005 |
2006 |
2007 |
2008 |
2009 |
2010 |
2011 |
2012 |
2013 |
2014 |
2015 |
2016 |
|
Canada |
|
|
European Union |
(Member Organization) |
|
United States of America |
|
Brazil |
|
China |
|
Indonesia |
|||||
|
|
|
|
|
|
||||||||||||
NOTE: Producer Nominal Protection Coefficient is the ratio between the average price received by producers (at farm gate), including payments per tonne of current output, and the border price (measured at farm gate).
SOURCE: OECD.
| 10 |

vk.com/id446425943
THE STATE OF AGRICULTURAL COMMODITY MARKETS 2018
»During the same period, in some emerging and developing economies higher levels of development, increasing income per capita and the need to stimulate production, have led to increased support to farmers, in some cases through trade-distorting measures, such as market price support. Figure 1.8 shows the trend in the Producer Nominal Protection Coefficient for selected countries, reflecting the effect of border measures, as well as payments coupled to production on the domestic producer price level.
In addition, there were significant reductions in the use of export subsidies by developed countries under the AoA, facilitated by the higher level of agricultural commodity prices between 2000 and 2008. The implementation of the agreement at the December 2015 Nairobi WTO Ministerial Conference to eliminate export subsidies on agricultural products will contribute to a more level playing field in trade for both emerging economies and developing countries. n
| 11 |

vk.com/id446425943
TERA, BAJIRGA, NIGER
Women in the field preparing for the next rainy season by digging mid-moon dams to save water, part of an FAO, European Development Fund, and African, Caribbean and Pacific Group of States (ACP) project to promote sustainable land management and restore drylands and degraded soils. ©FAO/Giulio Napolitano
vk.com/id446425943
PART 2 THE LINKAGES BETWEEN AGRICULTURAL TRADE, FOOD SECURITY AND CLIMATE CHANGE
Key points
1Climate change will affect world regions unevenly. It is already affecting
vulnerable countries and will pose a major threat to their food security.
2Climate change will alter conditions for agriculture. This could lead to changes in comparative advantage across regions
and consequently to changes in agricultural trade.
3Agricultural trade can help in adapting to climate change and in
ensuring food security. It can support adaptation efforts by stabilizing markets and reallocating food from surplus to deficit regions.

vk.com/id446425943
PART 2
THE LINKAGES BETWEEN AGRICULTURAL TRADE, FOOD SECURITY AND CLIMATE CHANGE
CLIMATE CHANGE, AGRICULTURE AND AGRICULTURAL TRADE
Climate is an essential input in agricultural production. Shifts in the average levels of temperature and precipitation inevitably have an impact on agricultural productivity, farm incomes and prices. Agriculture also contributes to climate change directly by emitting methane, nitrous oxide and carbon dioxide, and indirectly by affecting net carbon emissions through its impact on soil, forests and other land uses (see Part 4, Box 4.3). The impacts of a warming planet are already becoming detectable in many parts of the world and are expected to accelerate in the coming decades.5 Understanding the changes in the climate and their potential impact on agriculture and vice versa, has become an active area of research bringing together various natural science and socio-economic disciplines.
Climate affects agriculture through various channels. Higher temperatures can have significant impacts on crop growth. They result in faster crop development, a shortened grain-filling stage and reduced yields. High temperatures can also damage plant cells, and extreme heat during the flowering stage increases sterility rates. Invasive weeds tend to be better adapted to a changing climate, with short juvenile periods, long-distance seed dispersal and greater response to elevated carbon dioxide concentrations.
Increases in temperatures also affect livestock. While there is limited evidence of these effects on a broad scale, experiments and observational data suggest that a warming planet will have negative effects on feed intake, the rate at which
animals grow and gain weight and dairy production. Disease and parasites, as well as mortality rates, are expected to increase. By altering the growth rate of pastures, climate change can also have an indirect effect on ruminant and dairy productivity.
In short, there are several avenues through which climate change can affect agriculture, with the adverse impacts becoming more dominant as temperatures rise.6 These slow-onset climate change effects will be felt unevenly by regions and countries. Whereas most tropical regions are likely to experience production losses due to rising temperatures, production in temperate regions is expected to benefit from warmer climate and longer growing seasons. Agricultural production may even become profitable in areas where this is currently not the case, such as cereal production in marginal areas of Finland.7 Elevated carbon dioxide concentrations could bring yield increases in some temperate crops, such as wheat, rice and potatoes, but may not have such an effect on crops grown in the tropics.8 In addition to the slow-onset climate effects, climate models predict an increasing likelihood of extreme events – such as droughts, floods and storms – with potentially damaging effects on crops and livestock in the short term.
Climate change is expected to slow down the decline in the number of undernourished, partly offsetting the positive effect of economic growth on food security. Most modelling studies suggest that the likely impact of climate change on food security, globally, may be relatively small compared to that of other drivers such as population and GDP growth. However, due to its uneven effects, climate change can be a critical factor for food security in some regions.9 Climate change can also affect nutrition (Box 2.1). The effects that climate change might have on the
| 14 |

vk.com/id446425943
THE STATE OF AGRICULTURAL COMMODITY MARKETS 2018
BOX 2.1
AGRICULTURAL TRADE, CLIMATE CHANGE AND NUTRITION
The link between climate change and nutrition is an important one, highlighted in the Second International Conference on Nutrition (ICN2) which underscores “the need to address the impacts of climate change and other environmental factors on food security and nutrition, in particular on the quantity, quality and diversity of food produced, taking appropriate action to tackle negative effects”.
The increase in carbon dioxide in the atmosphere is directly linked to the nutritional quality of crops. A study comparing 143 crops cultivated in Australia, Japan, and the United States of America reported a statistically significant decrease in the concentration of zinc and iron in rice, wheat, maize, soybeans, field peas, and sorghum. Given the impact of micronutrient deficiency on childhood growth disorders and increased vulnerability to illnesses, a climate-change-induced reduction in the nutritional quality of crops can negatively affect the global nutritional outcome.
Climate change may also compromise food safety, by increasing food-borne pathogens or inducing chemical changes that can increase the prevalence of toxic compounds in food. For example, cassava grown under
high levels of carbon dioxide has shown increased levels of cyanide in its leaves, which are commonly consumed in many countries as a rich source of protein, minerals and vitamins.
Higher prices of foodstuffs induced by climate change can also weaken the diversity of food consumed, by undermining the purchasing power of poor households. Poor households struggle to shift away from staple foods when prices rise, as they rely on their high-calorific content as the main source of energy. This is at the cost of consuming less vegetable and protein-rich products, which tend to be higher in price. Food price increases between 2012 and 2013 in Ethiopia forced households to reduce the number of meals per day and to switch to less preferred foodstuffs. In rural areas of the United Republic of Tanzania, increases in maize prices have been associated with a decline in the demand for other nutrients, impacting iron and vitamin A deficiency levels.
In this regard, trade can not only help moderate the impact of climate change on agricultural production and prices, but also strengthen the diversity and safety of foods available, contributing to better nutrition by promoting improved diets.
SOURCES: Adapted from Kornher, L. 2018. The market for maize in Eastern and Southern Africa in the context of climate change. SOCO 2018 Background Paper, Rome, FAO; D’Souza, A. & Jolliffe, D. 2014. Food Insecurity in Vulnerable Populations: Coping with Food Price Shocks in Afghanistan. American Journal of Agricultural Economics, 96(3): 790–812; Abdulai, A. & Aubert, D. 2004. A cross-section analysis of household demand for food and nutrients in Tanzania. Agricultural Economics, 31(1): 67–79; Matz, J.A., Kalkuhl, M. & Abegaz, G.A. 2015. The short-term impact of price shocks on food security – Evidence from urban and rural Ethiopia. Food Security, 7(3): 657–679; FAO. 2014. Second International Conference on Nutrition. Conference Outcome Document: Rome Declaration on Nutrition; and UNSCN. 2010.
four dimensions of food security – availability, access, utilization and stability – are summarized in Table 2.1.
International trade can play an important role in facilitating adaptation to climate change in the context of food security. In a country
experiencing declines in production due to a weather-induced shortfall, trade can contribute towards food security in terms of both availability and access. It can help in addressing domestic price instability due to extreme weather events. Furthermore, trade can have a positive effect on utilization, as it allows for
| 15 |

vk.com/id446425943
PART 2 THE LINKAGES BETWEEN AGRICULTURAL TRADE, FOOD SECURITY AND CLIMATE CHANGE
TABLE 2.1
CLIMATE CHANGE AND FOOD SECURITY10
Dimension of food security |
Climate change effects on food security |
Time horizon |
|
|
}} Global mean crop yields of rice, maize and wheat projected |
|
|
|
to decrease 3–10 percent per degree of warming |
|
|
|
}} Impacts on livestock through reduced feed quantity/quality, |
|
|
Availability |
pest and disease prevalence, physical stress; meat, egg and |
Slow onset, long term |
|
|
milk yield and quality decrease |
|
|
|
}} 5–10 percent decrease in potential fish catch in tropical |
|
|
|
marine ecosystems |
|
|
|
}} Increasing food prices |
|
|
Access |
}} Relocation of production with impacts on prices, trade flows |
Slow onset, long term |
|
|
and food access |
|
|
|
|
|
|
|
}} Reduced food safety due to higher rates of microbial growth at |
|
|
|
increased temperatures |
|
|
Utilization |
}} Reduced nutritional quality of crops due to decreases in leaf |
Slow onset, long term |
|
and grain nitrogen, protein and macroand micronutrient |
|||
|
|
||
|
concentrations associated with increased carbon dioxide |
|
|
|
concentrations and more variable and warmer climate |
|
|
|
|
|
|
|
}} Damage to crops and livelihoods from extreme events |
|
|
Stability |
(heatwaves, droughts, floods, storms, etc.) |
Extreme events, short term |
|
}} Short-term disruptions of trade through effects on transport |
|||
|
|
||
|
systems |
|
|
|
|
|
SOURCE: Based on FAO (2016); Campbell et al. (2016); and Schmidhuber and Tubiello (2007).
greater diversity in the food available, particularly in regions where climatic factors may not allow for the production of a large variety of different crops.
In the long term, by altering the comparative advantage of agriculture across regions, climate change could result in a significant shift in production patterns and a reconfiguration of international trade. This may deepen or reverse the net trade positions of regions and countries. Net food importers may increase their imports to meet their needs. Regions that once tended to be self-sufficient or net exporters may become net importers of crops in the face of adverse climate change. Other regions – particularly in the higher latitudes – may become more competitive in a wider range of agricultural products and increase their exports.
Agricultural trade and climate change
Integrated Assessment Models (IAMs) combine climate, crop and economic models in a model chain to project the long-term impacts of climate change, often to the year 2050 or beyond. These
projections are subject to scenarios assuming different climate, economic and policy pathways. The economic models usually produce a baseline scenario – a projection into the future based on the assumption that current climate conditions, macroeconomic and agricultural policy trends would continue. These baseline scenarios typically assume no adaptation or mitigation efforts. Using this baseline, counterfactual scenarios introducing climate or policy changes are then compared to assess their impacts
on agriculture.
Globally, most IAMs project declining agricultural production, increasing food prices and increasing trade relative to the baseline as a result of climate change in 2050. Often, analysts consider a number of different models based on different climate change and policy scenarios in order to account for uncertainty over the long term (see also Box 2.2). A review of nine models by Nelson et al. (2014) projects that climate change will result in changes in land use, prices and trade. On average, international producer prices are expected to increase by 20 percent, while international trade increases by one percent as a share of global production.11
| 16 |

vk.com/id446425943
THE STATE OF AGRICULTURAL COMMODITY MARKETS 2018
BOX 2.2
LIMITATIONS OF LONG-TERM FORESIGHT ANALYSIS
While economic models are useful tools to better understand how various drivers interact in complex systems, they are based on assumptions and often focus on specific aspects while leaving out others. For example, long-term climate change impacts are often based on crop yield changes, while extreme events, impacts on livestock productivity – direct and indirect through climate change effects on grassland productivity – and other effects of climate change such as sea-level rises, effects on energy demands, health and labour productivity, are disregarded.
Uncertainties in assumptions accumulate over the model chain, from climate to crop, to economic models and over the long-term projection horizon. To explore the range of possible outcomes, several combinations of climate and socio-economic scenarios are often run by whole model ensembles
– several climate, crop and economic models running on the same set of scenarios.
Another multi-model analysis by von Lampe et al. (2014) also suggests that climate change would lead to higher international prices for agricultural products and finds strong evidence that it could result in substantially higher international trade in food.12 These findings on the decline of global agricultural production and the increasing role of trade under climate change are also supported by FAO and OECD studies.13 A World Bank study finds that by 2030 climate change effects will remain limited at the global level. However, as changes in the climate become more pronounced, international trade will become an important tool for adaptation, increasing between 0.4 percent and 1.2 percent as a share of global production.14
Although models generally agree on the broad effects of climate change on agriculture and the adaptive role of trade, they differ in the magnitude of changes projected. This is due to differences in model structure (e.g. models considering only the agricultural sector compared
with whole-economy models), specification (e.g. net trade or bilateral trade flows, differences in elasticities), and the crops considered.15 However, most studies agree on the uneven impact of climate change across regions. India,
sub-Saharan Africa and South Asia are regions that are often projected to be adversely affected, whereas North America, parts of South America (e.g. Chile), Central Asia and Eastern Europe typically experience largely positive impacts.16 Model results also suggest that international markets may become more concentrated, with fewer regions dominating exports under severe climate change conditions compared with a scenario where mitigation efforts lead to relatively lower emissions.17
The role of agricultural trade policy in adaptation
As climate change is expected to have an uneven effect across regions, international trade can be an important avenue in ensuring food security. In well-functioning global markets, trade patterns will respond to changes in the comparative advantage across regions and countries. Global markets are important, and a number of studies carried out on the intersection of trade and climate change have focused on how trade policy can strengthen the adaptation role of trade by moderating the impacts of climate change on agricultural prices, welfare and food security. One study finds, for instance, that agricultural price increases due to climate change are greater and more widespread when trade is restricted across regions, compared to when all tariffs and export subsidies on agricultural and food products are removed.18
Under a hypothetical scenario that allows for free agricultural trade worldwide, global welfare losses due to climate change are projected to be reduced by about two-thirds relative to a scenario that assumes that trade policies give rise to the high protection levels prevailing in 1995.19 In most regions, welfare – the sum of gains and losses experienced by producers and consumers of agricultural products that are affected by climate change and policies – is also expected to improve under free trade. Another study suggests that open agricultural markets can moderate the negative impact of climate
| 17 |

vk.com/id446425943
PART 2 THE LINKAGES BETWEEN AGRICULTURAL TRADE, FOOD SECURITY AND CLIMATE CHANGE
BOX 2.3
CLIMATE CHANGE AND CHOKEPOINTS OF GLOBAL FOOD TRADE
Extreme weather events and slow-onset climate change also affect main transportation routes for agricultural trade. According to a recent Chatham House report, most international agricultural trade depends on only a small number of ‘chokepoints,’ of which 14 have been identified as being critical to food security.
Droughts, storms and floods may cause temporary closures of chokepoints, while weather-related wear and tear of infrastructure can reduce their efficiency and make them even more vulnerable to extreme events. Rising sea levels are likely to threaten the integrity of port operations and coastal storage infrastructure and will increase their vulnerability to storm surges. Climate change may also increase the risk of supply disruptions, as extreme weather events become more common and concurrent across different locations.
The most important chokepoints are:
}} Maritime (straits and canals): Panama Canal, Strait of Malacca (transit of over a quarter of global soybean exports), Turkish Straits (pass for one-fifth of global wheat exports, largely from the Black Sea ‘breadbasket’ region);
}} Inland and coastal chokepoints (in major
crop-exporting regions): United States of America, Brazil, Black Sea (together they account for 53 percent of global exports of wheat, rice, maize and soybean).
For example, the Chatham House report underlines the vulnerability of the Middle East and North Africa (MENA), a major food import dependent region in the world, to chokepoint disruptions. Over 30 percent of grain imports destined for this region are routed through at least one maritime chokepoint.
Limiting the risks from chokepoint disruptions will require the integration of chokepoint analysis in mainstream risk management, infrastructure investments, enhancement of confidence and predictability of global trade, and the development of emergency supply-sharing arrangements. In light of this, the G20 have requested to expand the activities of the Agricultural Market Information System (AMIS) to include assessment of chokepoint disruption risk, and to monitor chokepoint performance by collating data on throughput, congestion and climate resilience.
SOURCES: Bailey, R. & Wellesley, L. 2017. Chokepoints and Vulnerabilities in Global Food Trade, Chatham House Report, Chatham House, The Royal Institute of International Affairs. London, United Kingdom; Declaration, G20 Meeting of Agriculture Ministers 2018, 27–28 July 2018, Buenos Aires, Argentina.
change on global GDP from a decline of
1.36 percent to 0.58 percent.20 A third study also finds that freer trade could partly offset welfare losses from climate change, but only marginally (from a decline of 0.27 percent to 0.26 percent).21 Nevertheless, the distribution of gains and losses across regions matters. By offsetting the impact on agricultural prices brought about by climate change, open markets would benefit consumers in the most adversely affected regions, while resulting in losses for consumers in the temperate and boreal north. Producer impacts are reversed: farmers in regions where production benefits from climate change gain greater access to markets, while producers in adversely affected regions could lose, as they face more intense competition from the farmers in the north.22 These results suggest that
facilitating trade should be part of broader efforts to promote adaptation, especially those targeted towards increasing the agricultural productivity of family farmers sustainably.
Open markets could also contribute towards food security, especially in regions that could be affected by climate change and characterized by a high prevalence of undernourishment. One study suggests that under a severe climate change scenario in some regions, hunger could rise by up to 55 percent relative to the baseline in 2050 if regional markets are not integrated – i.e. if trade does not take place easily. When markets are fully integrated and under the same climate change assumptions, hunger is projected to rise by
30 percent due to climate change impacts, as the poor can access food at a lower cost from abroad.23
| 18 |

vk.com/id446425943
THE STATE OF AGRICULTURAL COMMODITY MARKETS 2018
While trade can help moderate climate change impacts on food availability and access, it can also have both positive and negative spillover effects. In the long term, greater competition, combined with appropriate policies, may result in increases in sustainable productivity through improved technologies or investments that can support growth and employment.24
Nevertheless, increased international trade can result in increases in GHG emissions due to transport and deforestation from the expansion of agricultural land use in exporting countries.25
In general, the benefits from agricultural trade for developing countries depend on their net trade position (net exporter or net importer) and on their own policy efforts. Under deteriorating conditions for agricultural production from climate change, food imports by low-latitude (often developing) countries will have to come from high-latitude (often developed) countries. Although trade may alleviate climate change pressures on domestic markets, in the long term it may result in food import dependence for negatively-affected countries. It can also increase the risk of exposure to higher market and price volatility due to extreme events that could affect large players in the international market (see Part 5).26
Import dependence raises the question of whether countries will have the financial capability to buffer agricultural production losses due to climate change in the long run. Trade can be an important component of ensuring food security in the context of climate change, but there is a need for a range of measures to build resilience.27 Policy options should focus on promoting the structural transformation of agriculture, but also on putting the broader economy on a sustainable path. Climate pressures on agriculture – which in developing countries provides employment to a large part of the population – should be met by efforts to facilitate sustainable growth in both agriculture and other sectors of the economy. In agriculture, this requires sustainable agricultural productivity growth, including through the adoption of improved technologies and practices, especially by small-scale family farmers in the poorest
countries that will be disproportionately affected by climate change (see Part 4).
As open markets are likely to increase the competitive pressure on import-competing sectors, the need for sustainable agricultural productivity growth becomes more pronounced in achieving a better balance between export and import performance. Trade and other policies should contribute towards stable domestic prices that promote food security, while at the same time provide appropriate incentives to farmers to adapt to climate change and increase productivity. Efforts should also focus on improving markets for land, labour and credit, which are central to promoting technology adoption and investment and ensuring an efficient allocation of natural resources. n
LONG-TERM FORESIGHT ANALYSIS OF CLIMATE CHANGE IMPACTS ON AGRICULTURAL TRADE
The uneven impact of climate change across regions will have implications for agricultural trade, with a recent modelling exercise providing more insight on how trade flows might change and on the extent to which trade could moderate the effects of changing climate in the long term.28
Food availability and climate change
In many regions, the adverse impacts of climate change on crop yields and agricultural production could partly be offset by farm-level responses and autonomous adaptation, such as intensifying management (e.g. increasing use of fertilizers) and expanding the arable area. Nonetheless, compared with the baseline, climate change is expected to result in declines in agricultural production in large parts of Africa, the Middle East and South and Southeast Asia. These declines are projected to be more pronounced in West Africa and India, where production could decrease by 2.9 and 2.6 percent respectively due to climate change impacts (Figure 2.1). In higher latitude regions, higher temperatures are
| 19 |
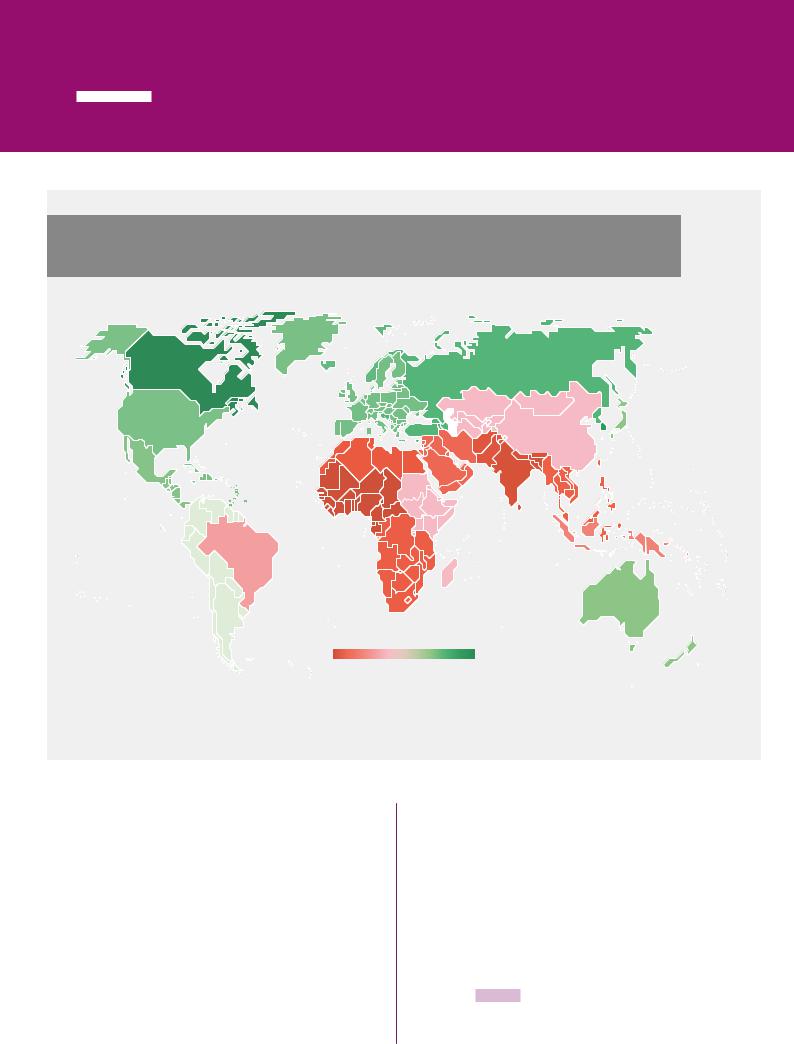
vk.com/id446425943
PART 2 THE LINKAGES BETWEEN AGRICULTURAL TRADE, FOOD SECURITY AND CLIMATE CHANGE
FIGURE 2.1
CHANGES IN AGRICULTURAL PRODUCTION IN 2050: CLIMATE CHANGE RELATIVE TO THE BASELINE
Decrease |
Increase |
NOTE: The final boundary between the Republic of the Sudan and the Republic of South Sudan has not yet been determined. Final status of the Abyei area has not yet been determined.
SOURCE: Based on data provided by Wageningen Economic Research. 2018. Climate Change and Global Market Integration: Implications for global economic activities, agricultural commodities and food security. SOCO 2018 Background Paper, Rome, FAO.
projected to result in increases in agricultural production, as for example in Canada (2.5 percent) and the Russian Federation (0.9 percent).29
South Asia and sub-Saharan Africa, particularly West Africa, are among the most vulnerable regions to climate change.30 In these regions, national economies depend on agriculture for a significant share of GDP and employment. At the same time, small-scale family farmers have little access to innovative technologies and inputs, which limits their capacity to adapt to a changing climate.31 Differences in access to markets and technologies across countries and within countries are likely to exacerbate the effects of climate change.32 Indeed, uneven climate change
effects in combination with differences in adaptation capacity may give rise to a growing divide between developed and developing countries.33
Regions that experience agricultural production declines due to climate change are expected to increase imports of agricultural products. Temperate regions, where production is projected to increase, will export more. By 2050, climate change will affect the net trade positions of countries and regions compared with the baseline (Figure 2.3). Net food importing countries in North and West Africa are projected to increase their net imports by 2.6 and 7.7 percent respectively. Net imports are also expected to »
| 20 |
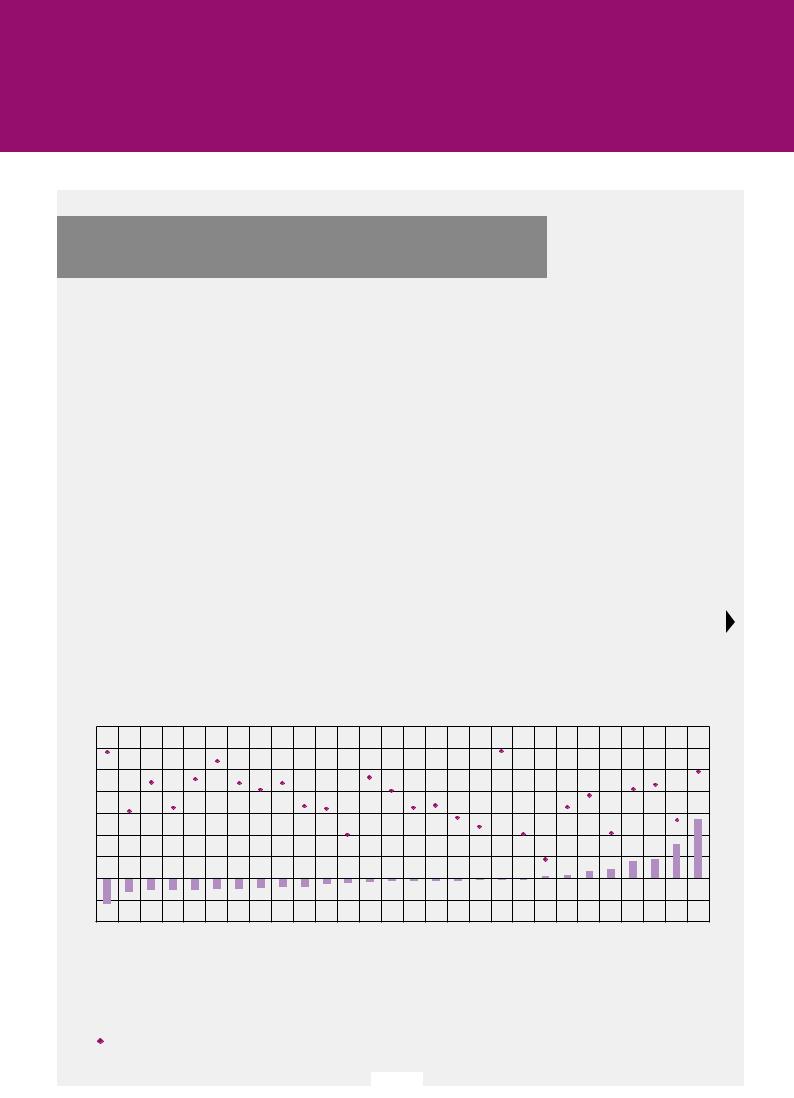
vk.com/id446425943
THE STATE OF AGRICULTURAL COMMODITY MARKETS 2018
BOX 2.4
SYSTEM DRIVERS AND SCENARIOS IN THE MODELLING ANALYSIS
The global Computable General Equilibrium (CGE) MAGNET (Modular Applied GeNeral Equilibrium Tool) model – a model of the global economy including agriculture – was used to simulate a baseline and a climate change scenario to project potential global and regional agricultural and economic developments to the year 2050.
The baseline scenario reflects a continuation of current trends and is derived from the Intergovernmental Panel on Climate Change (IPCC) Shared Socio-economic Pathway of a regional rivalry world (SSP3). It assumes that world GDP and population will grow by 134.7 and 38.7 percent respectively between 2011 and 2050. The baseline scenario makes no assumptions about climate change. Crop yields are assumed to increase in all regions due to technological progress, and globally are projected to increase by 38 percent (Figure 2.2). Yield projections assume that regions where the rate of technology adoption is currently rather low, such
as sub-Saharan Africa, Southeast Asia and Eastern Europe, will follow a positive trend towards catching up with the rest of the world. In line with FAO assumptions to 2050, global agricultural production and trade are projected to expand over 2011–2050. This expansion is mainly driven by the increase in demand driven by population and GDP growth, and improvements in crop yields driven by technological progress.
The climate change scenario is based on the assumptions of Representative Concentration Pathway 6.0 (RCP6.0), one of the four GHG concentration trajectories adopted by the IPCC for its Fifth Assessment Report. Under RCP6.0, global GHG emissions are expected to be at an intermediate level and the corresponding increase of global mean surface temperature by the end of this century (2081–2100) relative to the beginning (1986–2005) is expected to be in the range of 1.4 °C to 3.1 °C, with a mean of 2.2 °C. The impacts of climate change
FIGURE 2.2
BASELINE AND CLIMATE CHANGE CROP YIELD ASSUMPTIONS, PERCENT CHANGE 2011–2050
70
60
50
40
30
20
10
0
-10
-20
|
|
|
NorthAfrica |
SouthernofRest Africa |
CentralAmerica |
SoutheastAsia |
ofRestSouth Asia |
India |
CentralofRestEurope |
West Africa |
Near East |
SouthofRestAmerica |
EasternEurope |
Brazil |
Oceania |
China and East Asia |
Turkey |
Indonesiaand Southeast Pacific |
East Africa |
Western Europe |
Japan |
Central Asia |
FederationRussian and the Caucasus UnitedStates of America and Rest of North America Mexico |
Rest of East Asia |
Rest of Western Europe |
Canada |
|
AfricaSouth |
|
|
|
|
|
|
|
|
|
RestEasternEuropeof |
|||||||||||||||
|
|
|
Assumed change in crop yield due to climate change 2011–50 (RCP6.0) |
|
|
|
|
|
|
|
|
|
|
|
|
|
||||||||||
|
|
|
|
|
|
|
|
|
|
|
|
|
|
|
||||||||||||
|
|
|
Assumed change in crop yield due to technological progress 2011–50 (SSP3) |
|
|
|
|
|
|
|
|
|
|
|
|
|
||||||||||
|
|
|
|
|
|
|
|
|
|
|
|
|
|
|
|
|||||||||||
| 21 |

vk.com/id446425943
PART 2 THE LINKAGES BETWEEN AGRICULTURAL TRADE, FOOD SECURITY AND CLIMATE CHANGE
BOX 2.4
(CONTINUED)
on crop yields are derived by feeding information from global circulation models into crop growth models, which provide the yield projections under climate change. Only crop yield changes due to climate change are factored in; the modelling exercise does not consider impacts on livestock, extreme weather events or any specific adaptation or mitigation efforts.
Between 2011 and 2050, the global average yield across all crops is assumed to decline by 1.1 percent due to climate change only. However, this global
average masks significant variation across regions. Crop yields are projected to rise due to climate change, for example, in Canada (27 percent), some European countries (16 percent), Mexico (8 percent), the Russian Federation and the Caucasus (4 percent). In other countries and regions, yields are projected to decline, with the larger declines to be expected in several developing economies, for example, in parts of Africa (-12 percent), Southeast Asia (-5 percent), and
India (-5 percent).
SOURCES: O’Neill, B.C., Kriegler, E., Ebi, K.L., Kemp-Benedict, E., Riahi, K., Rothman, D.S., van Ruijven, B.J. et al. 2017. The Roads Ahead: Narratives for Shared Socioeconomic Pathways Describing World Futures in the 21st Century. Global Environmental Change, 42:169–80; Data provided by Global Perspectives Team, FAO Agricultural Development Economics Division; Wageningen Economic Research. 2018. Climate Change and Global Market Integration: Implications for global economic activities, agricultural commodities and food security. SOCO 2018 Background Paper, FAO, Rome; IPCC. 2014. Climate Change 2014: Synthesis Report. Contribution of Working Groups I, II and III to the Fifth Assessment Report of the Intergovernmental Panel on Climate Change [Core Writing Team, R.K. Pachauri and L.A. Meyer (eds.)]. IPCC, Geneva, Switzerland, 151 pp.
»increase relative to the baseline in Rest of South Asia (3.6 percent) and India (20.4 percent). Most of the countries in sub-Saharan Africa could deepen their net import position. By contrast, Canada – a traditional agricultural net exporting country – will expand its net exports by
21.9 percent relative to the baseline. The Russian Federation and the Caucasus, a net food importing region that will experience increases in production due to higher temperatures, will import less and export more, resulting in a
35.5 percent decline in its net imports (Figures 2.3 and 2.4; see also the discussion in Part 1 on countries’ importance in world markets).34
Climate change will affect bilateral trade flows. Agricultural exports are projected to increase from North America and from Europe and Central Asia to the Near East and North Africa, sub-Saharan Africa and South and Southeast Asia (Figure 2.5). By contrast, it is expected that Latin America and the Caribbean will export less to Europe and Central Asia, China and East Asia, North America and the Near East and North Africa. Sub-Saharan Africa is expected to import agricultural products from most other regions and countries, underlining the need for sustainable productivity growth in the region. For net food-importing developing countries (NFIDCs)
increases in imports may result in balance of payments problems (see discussion in Part 5 on import financing safety nets).
Exports by countries in South and Southeast Asia to North America, Europe and Central Asia, and the Near East and North Africa are expected to decline as the region adjusts to climate change impacts (Figure 2.6). Yet together with Latin America and the Caribbean, Southeast Asia will increase exports to sub-Saharan Africa. The uneven impact of climate change and the corresponding impacts in production and trade patterns imply that, while trade from North America, Europe, and Central Asia to other emerging economies and developing countries is expected to increase by more than USD 15 billion, South–South trade is likely to lag behind with an expected increase of about USD 4 billion (see discussion on South–South trade in Part 1).
Access to food and climate change
Climate change could affect the overall economy, particularly in countries with large agricultural sectors where crop production accounts for a significant part of GDP and total employment, or in countries that are leading exporters (Figure 2.7). »
| 22 |
vk.com/id446425943
THE STATE OF AGRICULTURAL COMMODITY MARKETS 2018
FIGURE 2.3
CHANGES IN AGRICULTURAL NET TRADE IN 2050: CLIMATE CHANGE SCENARIO
RELATIVE TO THE BASELINE (IN BILLION USD, 2011 CONSTANT PRICES)
|
|
|
|
|
|
|
|
|
|
|
|
|
|
|
|
|
|
|
|
|
|
|
|
|
|
|
|
|
|
|
|
|
|
|
|
Rest of |
|
|
|
|
|
|
|
|
|
|
|
|
|
|
|
|
|
|
|
|
|
|
|
|
|
|
|
|
|
|
|
|||||||||||
|
|
|
|
|
|
|
|
|
|
|
|
|
|
|
|
|
|
|
|
|
|
|
|
|
|
|
|
|
|
|
|
|
|
|
|
|
|
|
|
|
|
|
|
|
|
|
|
Russian Federation |
|
|
|
|
|
|
|
|
||||||||||||||||||||||
|
|
|
|
|
|
|
|
|
|
|
|
|
|
|
|
|
|
|
|
|
|
|
|
|
|
|
|
|
|
|
|
|
|
|
|
|
|
|
|
|
|
|
|
|
|
|
|
|
|
|
|
|
|
|
|
|||||||||||||||||||||||
|
|
|
|
|
|
|
|
|
|
|
|
|
|
|
|
|
|
|
|
|
|
|
|
|
|
|
|
|
|
|
|
|
|
|
|
Western Europe |
|
|
|
|
|
|
|
|
|
|
|
|
and the Caucasus |
|
|
|
|
|
|
|
|
|||||||||||||||||||||
|
|
|
|
|
|
|
|
Canada |
|
|
|
|
|
|
|
|
|
Rest of Eastern |
|
|
|
|
|
|
|
|
|
|
|
|
|
|
|
|
|
|
|
|
|
|
|
|
|
|
|
|
|
|
|
|||||||||||||||||||||||||||||
|
|
|
|
|
|
|
|
|
|
|
|
|
|
|
|
|
|
|
|
|
|
|
|
|
|
|
|
|
|
|
|
|
|
|
|
|
|
|
|
|
|
|
|
|
|
|
|
|
|
|
|
|
|
|
|
|
|
|
|
|
|
|
|
|
|
|
||||||||||||
|
United States of |
|
|
|
|
|
|
|
|
|
|
|
|
|
|
|
|
|
|
|
|
|
|
|
|
Western |
|
|
|
|
|
Europe |
|
|
Central |
|
|
|
|
|
|
|
|
|||||||||||||||||||||||||||||||||||
|
|
|
|
|
|
|
|
|
|
|
|
|
|
|
|
|
|
|
|
|
|
|
|
|
|
|
|
|
|
|
|
|
|
|
|
|
|
|
||||||||||||||||||||||||||||||||||||||||
|
|
|
|
|
|
|
|
|
|
|
|
|
|
|
|
|
|
|
|
|
|
|
|
|
Europe |
|
|
|
|
|
Eastern |
|
|
Asia |
|
|
|
|
|
|
|
|
|
|
|
|
|
|
|
|
|
|
Rest of |
|||||||||||||||||||||||||
|
America and |
|
|
|
|
|
|
|
|
|
|
|
|
|
|
|
|
|
|
|
|
|
|
|
|
|
|
|
|
|
|
|
|
|
Europe |
|
|
|
|
|
|
|
|
|
|
|
|
|
|
|
|
|
|
|
|
|
|
|
|
|
East Asia |
|||||||||||||||||
|
Rest of North America |
|
|
|
|
|
|
|
|
|
|
|
|
|
|
|
|
|
|
|
|
|
|
|
|
|
|
|
Rest of |
|
|
|
|
|
|
|
|
|
|
|
|
|
|
|
|
|
|
|
|
China and |
|
|
|
|||||||||||||||||||||||||
|
|
|
|
|
|
|
|
|
|
|
|
|
|
|
|
|
|
|
|
|
|
|
|
|
|
|
|
|
|
|
|
|
|
|
|
|
|
Turkey |
|
|
|
|
|
|
|
|
|
|
|
|
|
|
|
|
|
|
|
|
|
|
|
|
||||||||||||||||
|
|
|
|
|
|
|
|
|
|
|
|
|
|
|
|
|
|
|
|
|
|
|
|
|
|
|
|
|
Central |
Europe |
|
|
|
|
|
|
|
|
|
|
|
|
|
|
|
|
|
|
|
|
|
|
|
|
|
|
|
East Asia |
|
|
|
|
|
|
|
|
||||||||||||
|
|
|
|
|
|
|
|
|
|
|
|
|
|
|
|
|
|
|
|
|
|
|
|
|
|
|
|
|
|
|
|
|
|
|
|
|
|
|
|
|
|
|
|
|
|
|
|
|
|
|
|
|
|
|
|
|
|
|
|
|
Rest of |
|
|
|
|
|
|
|||||||||||
|
|
|
|
|
|
|
|
|
|
|
|
|
|
|
|
|
Central |
|
|
North |
|
|
|
|
|
|
|
|
|
|
|
|
Middle |
|
|
|
|
|
|
|
|
|
|
|
|
|
|
Japan |
||||||||||||||||||||||||||||||
|
|
|
|
|
|
|
|
|
|
|
|
|
|
|
|
|
|
|
|
|
|
|
|
|
|
|
|
|
|
|
|
|
|
|
|
|
|
|
|
|
|
|
|
|
||||||||||||||||||||||||||||||||||
|
|
|
|
|
|
|
|
|
|
|
|
|
|
|
|
|
|
|
|
|
|
|
|
|
|
|
|
|
|
|
East |
|
|
|
|
|
|
|
|
|
|
|
|
South Asia |
|
|
|
|
|
|
|
|
||||||||||||||||||||||||||
|
Mexico |
|
|
|
|
|
|
|
|
|
|
|
|
|
|
|
|
|
|
|
|
|
|
|
|
|
|
|
|
|
|
|
|
|
|
|
|
|
|
|
|
|
|
|
|
|
|
|
|
|
|
|
|
|
|
|||||||||||||||||||||||
|
|
|
|
|
|
|
|
|
|
|
|
|
|
America |
|
|
Africa |
|
|
|
|
|
|
|
|
|
|
|
|
|
|
|
|
|
|
|
|
|
|
|
|
|
|
|
|
|
|
|
|
|
|
|
|
Southeast |
||||||||||||||||||||||||
|
|
|
|
|
|
|
|
|
|
|
|
|
|
|
|
|
|
|
|
|
|
|
|
|
|
|
|
|
|
|
|
|
|
|
|
|
|
|
|
|
|
|
|
East Africa |
|
|
|
|
|
|
|
|
|
|
|
|
|
|
|
|
|
|
|
|
||||||||||||||
|
|
|
|
|
|
|
|
|
|
|
|
|
|
|
|
|
|
|
|
|
|
|
|
|
|
|
|
|
|
|
|
|
|
|
|
|
|
|
|
|
|
|
|
|
|
|
|
|
|
|
|
|
|
|
|
|
|
|
|
|
|
|
|
|||||||||||||||
|
|
|
|
|
|
|
|
|
|
|
|
|
|
|
|
|
|
|
|
|
|
|
|
|
|
|
|
|
|
|
|
|
|
|
|
|
|
|
|
|
|
|
|
|
|
|
|
|
|
|
|
|
|
|
|
|
|
|
|
|
|
|
|
Asia |
||||||||||||||
|
|
|
|
|
|
|
|
|
|
|
|
|
|
|
|
|
|
|
|
|
|
|
|
|
|
|
|
|
|
|
|
|
|
|
|
|
|
|
|
|
|
|
|
|
|
|
|
|
|
|
|
|
|
|
|
|
|
|
|
|
|
|
|
|||||||||||||||
|
|
|
|
|
|
|
|
|
|
|
|
|
|
|
|
|
|
|
|
|
|
|
|
|
|
|
|
West |
|
|
|
|
|
|
|
Rest of |
|
|
|
|
|
|
|
|
|
|
|
|
|
|
|
|
|
|
|
|
|
|
|
Indonesia and |
||||||||||||||||||
|
|
|
|
|
|
|
|
|
|
|
|
|
|
|
|
|
|
|
|
|
|
|
|
|
|
|
|
|
|
|
|
|
|
|
|
|
|
|
|
|
|
|
|
|
|
|
|
|
|
|
|
|
|
|
|
|
|
|||||||||||||||||||||
|
|
|
|
|
|
|
|
|
|
|
|
|
|
|
|
|
|
|
|
|
|
|
|
|
|
|
|
|
|
|
|
|
|
|
|
|
|
|
|
|
|
|
|
|
|
|
|
|
|
|
|
|
|
|
|
|
|
|||||||||||||||||||||
|
|
|
|
|
|
|
|
|
|
|
|
|
|
|
|
|
|
|
|
|
|
|
|
|
|
|
|
|
|
|
|
|
|
|
|
|
|
|
|
|
|
India |
|
|
||||||||||||||||||||||||||||||||||
|
|
|
|
|
|
|
|
|
|
|
|
|
|
|
|
|
|
|
|
|
|
|
|
|
|
|
|
Africa |
|
|
|
|
|
|
|
|
|
|
|
|
|
|
|
|
Southeast Pacific |
|||||||||||||||||||||||||||||||||
|
|
|
|
|
|
|
|
|
|
|
|
|
|
|
|
|
|
|
|
|
|
Brazil |
|
|
|
|
|
|
|
|
|
|
|
|
|
|
|
|||||||||||||||||||||||||||||||||||||||||
|
Net Exporters |
|
|
|
|
|
|
|
|
|
|
|
|
|
|
|
|
|
|
|
|
|
|
|
|
|
|
|
|
|
Southern Africa |
|
|
|
|
|
|
|
|
|
|
|
|
|
|
|
|
|
|
|
|
|
|
|
|
|||||||||||||||||||||||
|
|
|
|
|
|
|
|
Rest of |
|
|
|
|
|
|
|
|
|
|
|
|
|
|
|
|
|
|
|
|
|
|
|
|
|
|
|
|
|
|
|
|
|
|
|
|
|
|
|
|
|
|
|
|
|
|
|
|
|
|
|
|
||||||||||||||||||
|
Net Importers |
|
|
|
|
South America |
|
|
|
|
|
|
|
|
|
|
|
|
|
|
|
|
|
|
|
|
|
|
|
|
|
|
|
|
|
|
|
|
|
|
|
|
|
|
|
|
|
|
|
|
|
|
|
|
|
|
|
|
|
|
|
|
|
|
|
|
||||||||||||
|
|
|
|
|
|
South |
|
|
|
|
|
|
|
|
|
|
|
|
|
|
|
|
|
|
|
|
|
|
|
|
|
|
|
|
|
|
|
|
|
|
|
|
|
|
|
|
|
|
|
|
||||||||||||||||||||||||||||
|
Increase in net exports |
|
|
|
|
|
|
|
|
|
|
|
|
|
|
|
|
|
|
|
|
|
|
|
|
|
|
|
|
|
|
|
|
|
|
|
|
|
|
|
|
|
|
|
|
|
|
|
|
|
|
|
|
|
|
|
|
|
|
|
|
|
|
|
|
|
|
|
|
|
|
|
||||||
|
|
|
|
|
|
|
|
|
|
|
|
|
|
|
|
|
|
|
|
|
|
|
|
|
|
|
|
|
|
|
|
|
|
|
|
|
|
|
|
|
|
|
|
|
|
|
|
|
|
|
|
|
|
|
|
|
|
|
|
|
|
|
|
|
|
|
|
|
|
|
||||||||
|
|
|
|
|
|
|
|
|
|
|
|
|
|
|
|
|
|
|
|
|
|
|
|
|
|
|
|
|
|
|
|
|
|
|
|
|
|
|
|
|
|
|
|
|
|
|
|
|
|
|
|
|
|
|
|
|
|
|
|
|
|
|
|
|
|
Oceania |
||||||||||||
|
|
|
|
|
|
|
|
|
|
|
|
|
|
|
|
|
|
|
|
|
|
|
|
|
|
|
|
Africa |
|
|
|
|
|
|
|
|
|
|
|
|
|
|
|
|
|
|
|
|
|
|
|
|
|
|
|
|
|
|
|
|
|
|
|
|
|
|||||||||||||
|
Decrease in net exports |
|
|
|
|
|
|
|
|
|
|
|
|
|
|
|
|
|
|
|
|
|
|
|
|
|
|
|
|
|
|
|
|
|
|
|
|
|
|
|
|
|
|
|
|
|
|
|
|
|
|
|
|
|
|
|
|
|
|
|
|
|
|
|
|
|
|
|
|
|
|
|||||||
|
|
|
|
|
|
|
|
|
|
|
|
|
|
|
|
|
|
|
|
|
|
|
|
|
|
|
|
|
|
|
|
|
|
|
|
|
|
|
|
|
|
|
|
|
|
|
|
|
|
|
|
|
|
|
|
|
|
|
|
|
|
|
|
|
|
|
|
|
|
|
|
|
|
|
|
|||
USD billions |
|
|
|
|
|
|
|
|
|
|
|
|
|
|
|
|
|
|
|
|
|
|
|
|
|
|
|
|
|
|
|
|
|
|
|
|
|
|
|
|
|
|
|
|
|
|
|
|
|
|
|
|
|
|
|
|
|
|
|
|
|
|
|
|
|
|
|
|
|
|
|
|
|
|
|
|||
(Constant prices 2011) |
|
|
|
|
|
|
|
|
|
|
|
|
|
|
|
|
|
|
|
|
|
|
|
|
|
|
|
|
|
|
|
|
|
|
|
|
|
|
|
|
|
|
|
|
|
|
|
|
|
|
|
|
|
|
|
|
|
|
|
|
|
|
|
|
|
|
|
|
|
|
|
|
|
|
|
|||
NOTE: The final boundary between the Republic of the Sudan and the Republic of South Sudan has not yet been determined. Final status of the Abyei area has not yet been determined.
SOURCE: Based on data provided by Wageningen Economic Research. 2018. Climate Change and Global Market Integration: Implications for global economic activities, agricultural commodities and food security. SOCO 2018 Background Paper, FAO, Rome
FIGURE 2.4
CHANGES IN AGRICULTURAL PRODUCTION AND NET EXPORTS IN SELECTED COUNTRIES AND REGIONS IN 2050: CLIMATE CHANGE SCENARIO RELATIVE TO THE BASELINE
PERCENT
40
30
20
10
0
-10
-20
-30
Canada |
Russian Federation |
North Africa |
Rest of South Asia |
India |
West Africa |
|||
|
and the Caucasus |
|
|
|
|
|
|
|
|
|
|
Agri-food production |
|
|
Agri-food net exports |
|
|
|
|
|
|
|
|
|||
SOURCE: Based on data provided by Wageningen Economic Research. 2018. Climate Change and Global Market Integration: Implications for global economic activities, agricultural commodities and food security. SOCO 2018 Background Paper, FAO, Rome.
| 23 |
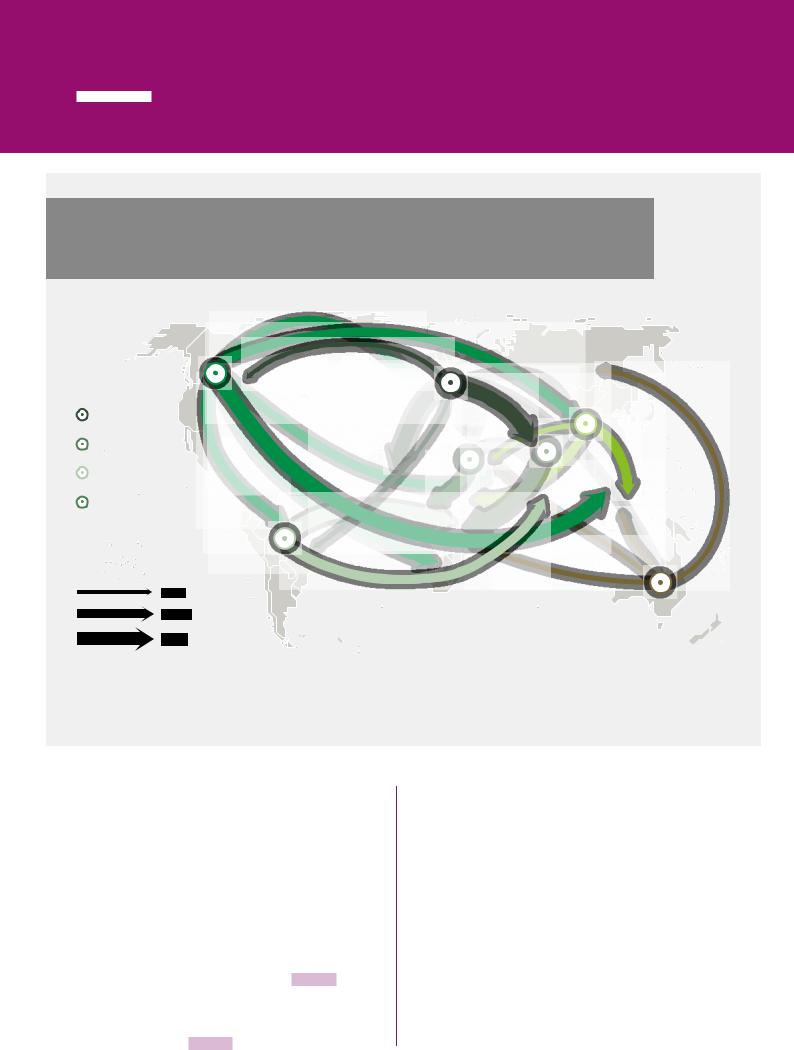
vk.com/id446425943
PART 2 THE LINKAGES BETWEEN AGRICULTURAL TRADE, FOOD SECURITY AND CLIMATE CHANGE
FIGURE 2.5
INCREASES IN EXPORTS OF AGRICULTURAL PRODUCTS IN 2050: CLIMATE CHANGE RELATIVE TO THE BASELINE (IN BILLION USD, 2011 CONSTANT PRICES)
 China and East Asia
Europe and
Central Asia
South and
Southeast Asia
Latin America and the Caribbean
Near East and
North Africa  North America
  Oceania
USD billions (Constant prices 2011)
0 − 0.5
0.5 − 0.9
≥ 0.9
SOURCE: Based on data provided by Wageningen Economic Research. 2018. Climate Change and Global Market Integration: Implications for global economic activities, agricultural commodities and food security. SOCO 2018 Background Paper, FAO, Rome.
»While some regions may to some extent benefit from climate change, such as in the northern latitudes, GDP could decline significantly in Africa and South Asia, with losses of up to
2.5 percent and 1.9 percent respectively relative to the baseline.
The impact of changing climate on GDP can largely be understood as the joint effect of two major contributing factors. The first factor relates to the direction and magnitude of climate change effects on crops as defined by climate-induced crop yield shocks (Figure 2.2). The second revolves around how important the arable sector is to the economy, reflected by the share of crops in the value of output of all economic sectors (Figure 2.8). Developing
economies are found to be hit harder partly due to higher climate-induced crop yield losses, and due to their economic structure, in which crops typically account for a relatively large share of total value of output.
By 2050 the value of crops in developing countries is expected to account for an average of 3.5 percent of the output value of all sectors – contrasting with an average of only 0.6 percent in developed economies – due to a combination of their projected path to development and climate change. West Africa for example is projected to have over 23 percent of its agricultural and food processing output value generated from crops in 2050. This heavy reliance on crops renders developing economies more vulnerable to
| 24 |

vk.com/id446425943
THE STATE OF AGRICULTURAL COMMODITY MARKETS 2018
FIGURE 2.6
DECREASES IN EXPORTS OF AGRICULTURAL PRODUCTS IN 2050: CLIMATE CHANGE RELATIVE TO THE BASELINE (IN BILLION USD, 2011 CONSTANT PRICES)
China and East Asia
Latin America and
the Caribbean
Near East and
North Africa
Oceania
Sub-Saharan Africa
South and
Southeast Asia
USD billions
(Constant prices 2011)
0 − 0.5
0.5 − 0.9
≥ 0.9
SOURCE: Based on data provided by Wageningen Economic Research. 2018. Climate Change and Global Market Integration: Implications for global economic activities, agricultural commodities and food security. SOCO 2018 Background Paper, FAO, Rome.
extreme weather events and underlines the importance of structural transformation in adapting to climate change.
At the global level, the decrease in agricultural production due to climate change is expected to result in a relatively small increase in world food market prices. Nevertheless, across regions food price changes will differ depending on the uneven impact of climate change on agricultural production and the extent to which countries and regions adjust to changing climate in terms of GDP, wages and trade. Food consumer prices are expected to increase relative to the baseline in many regions, such as West Africa (5.6 percent), India (4.6 percent), the Rest of South Asia
(1.3 percent), and North Africa (1.2 percent)
(Figure 2.9). These changes in food prices will have an impact on food purchasing power – an indicator of access to food, calculated by the ratio of the price of food over the wage rate – posing a significant threat to food security. In West Africa for example, food purchasing power could decline by nearly 12 percent due to climate change
(Figure 2.10). In India, food purchasing power is expected to decline by 6.2 percent. Poor rural households are likely to be hit hardest by declines in food purchasing power. Specific interventions that can strengthen their capacity to adapt, such as linking climate-smart policies to social protection mechanisms, will be necessary. n
| 25 |
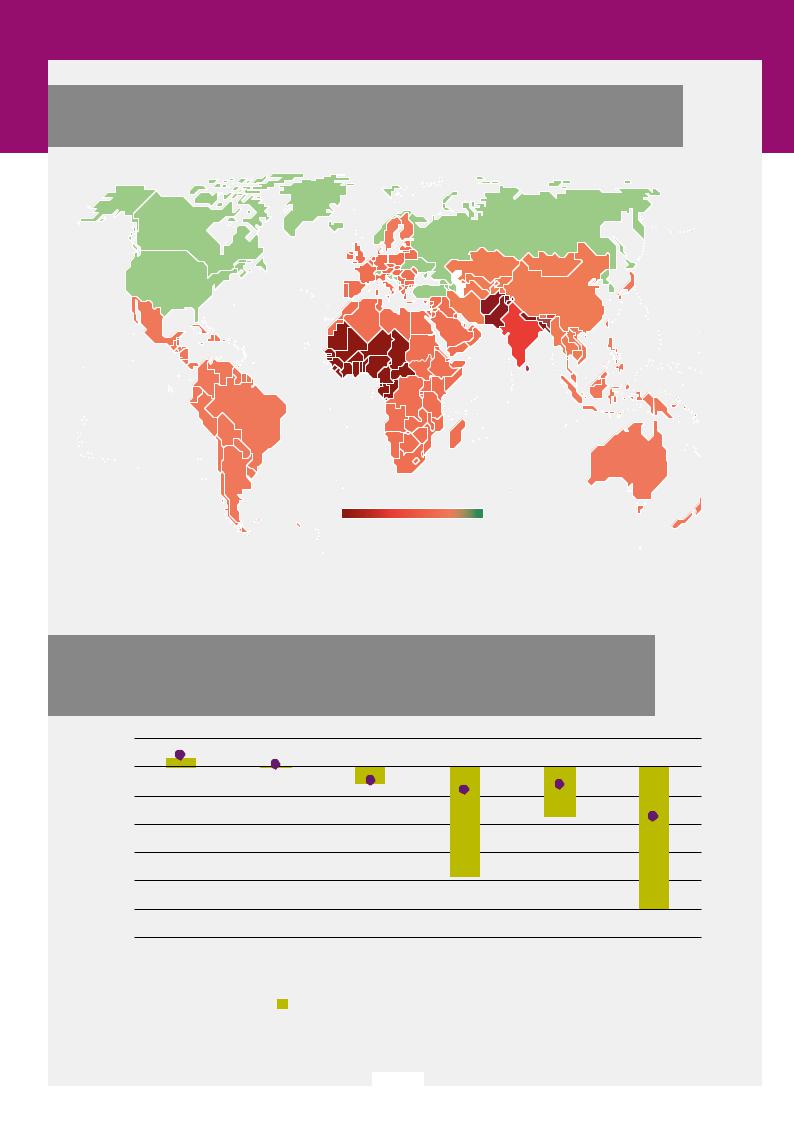
vk.com/id446425943
PART 2 THE LINKAGES BETWEEN AGRICULTURAL TRADE, FOOD SECURITY AND CLIMATE CHANGE
FIGURE 2.7
CHANGES IN GDP IN 2050: CLIMATE CHANGE SCENARIO RELATIVE TO THE BASELINE
Decrease |
Increase |
NOTE: The final boundary between the Republic of the Sudan and the Republic of South Sudan has not yet been determined. Final status of the Abyei area has not yet been determined.
SOURCE: Based on data provided by Wageningen Economic Research. 2018. Climate Change and Global Market Integration: Implications for global economic activities, agricultural commodities and food security. SOCO 2018 Background Paper, FAO, Rome.
FIGURE 2.8
CHANGES IN GDP IN SELECTED COUNTRIES AND REGIONS IN 2050: CLIMATE CHANGE SCENARIO RELATIVE TO THE BASELINE
PERCENT
0.5
0.0
-0.5
-1.0
-1.5
-2.0
-2.5
-3.0
Canada |
Russian Federation |
North Africa |
Rest of South Asia |
India |
West Africa |
|
and the Caucasus |
|
|
|
|
GDP  Climate-induced yield change weighted by crops output value share
SOURCE: Wageningen Economic Research. 2018. Climate Change and Global Market Integration: Implications for global economic activities, agricultural commodities and food security. SOCO 2018 Background Paper, FAO, Rome.
| 26 |
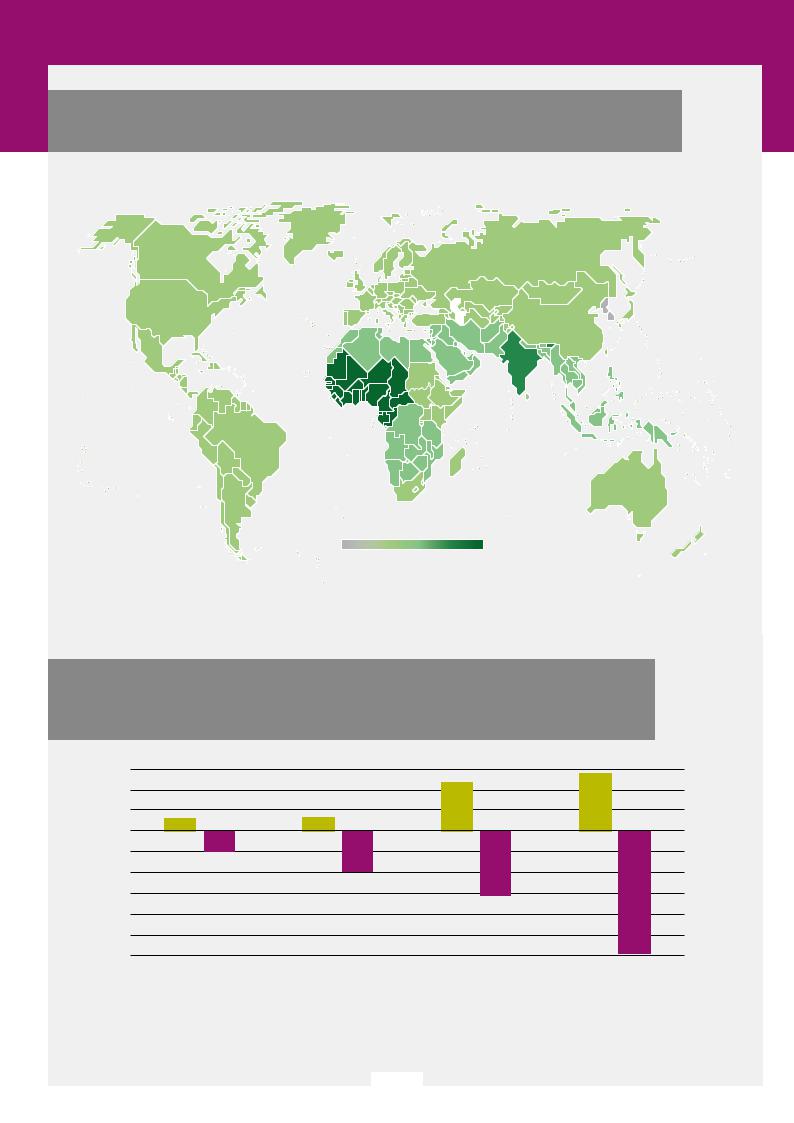
vk.com/id446425943
THE STATE OF AGRICULTURAL COMMODITY MARKETS 2018
FIGURE 2.9
CHANGES IN FOOD PRICES IN 2050: CLIMATE CHANGE SCENARIO RELATIVE TO THE BASELINE
Decrease |
Increase |
NOTE: The final boundary between the Republic of the Sudan and the Republic of South Sudan has not yet been determined. Final status of the Abyei area has not yet been determined.
SOURCE: Based on data provided by Wageningen Economic Research. 2018. Climate Change and Global Market Integration: Implications for global economic activities, agricultural commodities and food security. SOCO 2018 Background Paper, FAO, Rome.
FIGURE 2.10
CHANGES IN FOOD PRICES AND FOOD PURCHASING POWER IN SELECTED COUNTRIES/REGIONS IN 2050: CLIMATE CHANGE SCENARIO RELATIVE TO THE BASELINE
PERCENT
6
4
2
0
-2
-4
-6
-8
-10
-12
North Africa |
|
Rest of South Asia |
|
India |
West Africa |
|
|
Food consumer prices |
|
Food purchasing power |
|
|
|
|
|
SOURCE: Wageningen Economic Research. 2018. Climate Change and Global Market Integration: Implications for global economic activities, agricultural commodities and food security. SOCO 2018 Background Paper, FAO, Rome.
| 27 |

vk.com/id446425943
PART 2 THE LINKAGES BETWEEN AGRICULTURAL TRADE, FOOD SECURITY AND CLIMATE CHANGE
BOX 2.5
THE IMPACT OF CLIMATE CHANGE ON FISHERIES
Fish and fish products are among the most highly traded foods. In 2016, about 35 percent of global fish production was traded, and in general it is estimated that as much as 78 percent is exposed to foreign competition. International fish trade, measured in total real export value, has grown substantially over the past four decades. Between 1976 and 2016, total traded value increased fourfold from USD 33.1 billion to USD 142.5 billion. The international trade in fish made up 52 percent of total animal protein trade value in 2016.
The impacts of climate change on both fisheries and aquaculture are also expected to be significant, but are subject to uncertainty. Fish will be exposed to a complex mix of changing abiotic conditions, such as changes in temperature, salinity, oxygen and water pH. There will also be changes in biotic conditions, related to shifting distribution and migration patterns, species compositions, and abundance of predators and prey, among other things. These changes may affect the physiology, phenology, and behaviour of fish at any life-history stage, and can increase or reduce local abundance. However, adaptive capacity will vary across species. A recent study by FAO suggests that by 2050 climate change (as reflected by the Representative Concentration Pathway 2.6 [RCP2.6]) may result in decreases in the maximum catch potential in the world’s exclusive economic zones of between 2.8 percent and 5.3 percent. A more severe climate change scenario (RCP8.5) suggests decreases between 7.0 percent and 12.1 percent. The effects of climate change in catch potential are expected to vary substantially between regions. These projections reflect changes in the capacity of oceans to produce fish and do not take into account adaptation measures that may offset climate change effects.
In general, fish production is expected to increase at high northern latitudes, and less so at high southern latitudes, particularly in the South Pacific. Changes in production and distribution patterns have already started to create international jurisdiction issues and caused challenges to the governance structure of fisheries management at both international and
national level. Such is the case regarding the migration of cod and mackerel stocks in the north Atlantic and of fish stocks shifting to the management zone of new regional fisheries management councils in the United States of America.
Competition for scarce water resources often undervalues the significant contributions of inland fisheries to food security. Inland fisheries in Iraq, Morocco, Pakistan and Spain already face high stress levels that are expected to become even higher in future. In other countries – such as Cambodia, Colombia, Myanmar, the Central African Republic and the Congo – inland fisheries are, at present, characterized by low stress and it is expected that they will remain so in the future. The implications of climate change for individuals, communities and countries dependent on inland fisheries can be expected to be significant.
Aquaculture has been the world´s fastest growing food production system since the 1970s. Growth in aquaculture production has been supported by new technologies that have facilitated the domestication of new species and the development of more productive strains. Higher water temperatures due to climate change may increase the rate of growth of cultured stock, which may enhance aquaculture production. However, when temperatures rise above the optimal range, they could lead to reduced feed intake and feed utilization efficiency. For coastal species, extreme weather events and sea-level rises may be the most important challenges, and increases in temperature could also accelerate the rate of eutrophication and harmful algal blooms as well as the spread of bacterial diseases, negatively affecting fish health and production. For pond-raised species, the salinity of soil may create an additional challenge. In general, however, the adaptive capacity of aquaculture is perceived to be higher than in fisheries, as the control over the production processes facilitates the shift in production to more suitable locations and species.
Our knowledge of the impacts of climate change on livelihoods revolving around fisheries and aquaculture is more limited. However, a study on the
| 28 |

vk.com/id446425943
THE STATE OF AGRICULTURAL COMMODITY MARKETS 2018
BOX 2.5
(CONTINUED)
vulnerability of 132 national economies to the climate change impact on fisheries, suggests that the most vulnerable communities tend to be in tropical Africa, north-western South America and in Asia, where fish consumption makes up a very high share of the protein and nutrients in diet. These countries have also struggled with the additional challenges posed by overfishing and declining fisheries landings, underlining the fact that the effects of climate change on societies and food security are not confined to the direct physical impacts. More than 33 percent of global marine stocks monitored by FAO are being overexploited. There is
some evidence that severe overfishing makes stocks much more vulnerable to climate change, rendering fisheries management systems important in adaptation efforts. Fisheries and aquaculture are critically important for millions of people in coastal, riverine, insular and inland regions whose livelihoods depend on the sector. These population groups are the most vulnerable to the impacts of climate change, and particular attention needs to be given to them while designing adaptation measures if the fisheries sector is to continue to contribute to meeting global goals of poverty reduction and zero hunger.
SOURCE: Adapted from Asche, F. 2018. Impacts of climate change on the production and trade of fish and fishery products. SOCO 2018 Background Paper, Rome, FAO; Barange, M., Bahri, T., Beveridge, M.C.M., Cochrane, K.L., Funge-Smith, S. & Poulain, F., eds. 2018. Impacts of climate change on fisheries and aquaculture: synthesis of current knowledge, adaptation and mitigation options. FAO Fisheries and Aquaculture Technical Paper No. 627. Rome, FAO. 628 pp.; FAO, 2018. The State of World Fisheries and Aquaculture 2018. Rome.
| 29 |

vk.com/id446425943
VIET NAM
Early morning fish market ©FAO/TM Dien.

vk.com/id446425943
PART 3 AGRICULTURAL TRADE AND CLIMATE CHANGE: EXPLORING THE POLICY SPACE
Key points
1 In principle, there is no fundamental conflict between climate change policies
and multilateral trade rules. Various provisions of the WTO can accommodate the implementation of climate-related policies of the Paris Agreement.
2 There is scope for countries to pursue environmental protection objectives under
WTO rules. However, the interpretation and application of these rules with regard to the treatment of identical food products that differ solely in their carbon footprint remains untested. An internationally agreed definition of carbon footprint could facilitate the implementation of policies for climate change adaptation and mitigation.
3 Discussions should be pursued at the juncture of the Paris Agreement and the
WTO agreements to strengthen their mutually supportive approach. This can contribute to reducing agricultural emissions globally.

vk.com/id446425943
PART 3
AGRICULTURAL TRADE AND CLIMATE CHANGE: EXPLORING THE POLICY SPACE
PARIS AGREEMENT AND THE WORLD TRADE ORGANIZATION (WTO) AGREEMENTS
The uneven impact of climate change on agricultural production across regions will heighten the role of trade in adaptation and in contributing to food security. To a large extent, this potential will depend on a well-functioning trading system and consequently on domestic policies and border measures. The Paris Agreement has succeeded in reaching a political consensus around tackling the challenges of climate change collectively. However, its effectiveness in promoting adaptation and mitigation in agriculture will depend on specific actions that are yet to be discussed. This discussion will have to take place on the basis, inter alia, of the Paris Agreement and the WTO agreements – in particular the AoA, which covers agricultural policy instruments – and seek to identify how to strengthen the mutually supportive approach of both accords.35
Paris Agreement
The adoption of the Paris Agreement in December 2015 marked a major step forward in global efforts to tackle climate change. The landmark agreement, reached by 196 participating Parties to the United Nations Framework Convention on Climate Change (UNFCCC), was hailed as a fresh approach to international cooperation reflecting the evolving thinking on how countries can address climate change collectively.36 While the Kyoto Protocol – the predecessor climate accord scheduled to elapse at the end of 2020 – operated on a rigid
distinction in responsibilities between different groups of countries37 on account of past GHG emissions, the Paris Agreement marks a departure from this approach. This new climate accord acknowledges that the geographic distribution of global economic activities has changed (see Part 1), and that there is a need for the participation of a broader set of countries responsible for an increasing share of GHG emissions to effectively manage the threat of climate change in the future.
The Paris Agreement recognizes the growing role and potential of the developing world to contribute to climate change mitigation efforts, but it also remains true to the UNFCCC principle of “common but differentiated responsibilities and respective capabilities.”38 Specifically, the Agreement recognizes that countries differ not only in their historical and current emissions, in relative and absolute terms, but also in their priorities and capacity to pursue adaptation and mitigation measures in line with global efforts to address climate change.
The balance between universal participation and differentiated responsibilities in the Paris Agreement is achieved by allowing far greater autonomy in the way countries can contribute to the collective target of keeping the rise in global average temperature to significantly below 2 °C. This contrasts with the Kyoto Protocol, which laid out concrete individual targets (for developed countries) in terms of reducing emissions over a well-defined timeline, and
stipulated market-based instruments and enforcement mechanisms formulated through top-down decision-making processes (Box 3.1).
The flexibility allowed under the Paris Agreement is reflected in the system of Nationally Determined Contributions (NDCs) – national
| 32 |
vk.com/id446425943
THE STATE OF AGRICULTURAL COMMODITY MARKETS 2018
BOX 3.1
IMPLEMENTATION MECHANISMS UNDER THE KYOTO PROTOCOL AND PARIS AGREEMENT
While the Paris Agreement lacks common standards, enforcement mechanisms, or sanctions for non-compliance, the UNFCCC predecessor agreement, the Kyoto Protocol (2007), described in some detail both domestic and international Joint Implementation measures. Such measures included Emissions Trading Schemes (ETS) and their joint mechanism International Emissions Trading (IET), the Clean Development Mechanism (CDM), the Green Investment Scheme (GIS) and the Border Adjustment Measures (BAM).
At the same time, while the implementation mechanisms were far clearer, the binding nature of the commitment, along with the burden absorbed largely by the developed world, prevented a number of countries – including the United States of America, the world’s top emitter of GHGs at the time of signing
– from ratifying the legislation domestically.
The Paris Agreement is flexible with regard to the implementation tools; it leaves the choice – and the
responsibility to respect international trade and investment rules – to the countries. Effectively, it relies on incentives through peer pressure. The "global stocktake" every five years provides an opportunity to review national contributions and to encourage higher ambitions. Together with a standing committee on implementation and compliance and technical expert reviews, this mechanism enables a focus on political and technical aspects of performance.
Despite the lack of explicit guidance on instruments, however, the Paris Agreement encourages the use of market-based mechanisms by countries to meet their NDC commitments. It also acknowledges the important role of collective implementation and joint adaptation and mitigation approaches in achieving the collective target of keeping the rise in average temperature significantly below 2 °C.
SOURCE: Häberli, C. 2018. Potential Conflicts Between Agricultural Trade Rules and Climate Change Treaty Commitments. SOCO 2018 Background Paper, Rome, FAO; Giroud, J., Lancesseur, N. and Roulleau, T. 2016. Economic Analysis of the Paris Agreement. Trésor Economics, No. 187, December.
policy frameworks through which countries communicate their proposed climate actions to the international community and report on the progress made towards achieving them.39 It is not compulsory to meet the targets outlined in the NDCs, but countries are expected to pursue domestic mitigation measures with the aim of achieving their goals.40 Moreover, the Agreement urges countries to strengthen their efforts progressively through a “ratchet mechanism,” whereby countries are expected to update their commitments to reflect the highest possible ambition every five years, starting in 2020.
The NDCs will be assessed through periodic global stocktaking exercises, the first of which will take place in 2023, in preparation for a new set of policy frameworks to be implemented
during 2026–2030. While all countries are required to participate, the assessment will be based on the achievement of collective efforts at the global level. In addition, the stocktaking will also assess whether sufficient assistance is provided by developed countries to developing countries, reconfirming that although all countries participate in adaptation and mitigation efforts, developed countries are to take the lead on various areas of action outlined in the
accord.41
The importance of agriculture (crops and livestock) for climate change adaptation and mitigation efforts, and the sector’s vulnerability to climate-related shocks and changes is clearly recognized in NDCs submitted to date.42 Mitigation in agriculture features in close to
| 33 |

vk.com/id446425943
PART 3 AGRICULTURAL TRADE AND CLIMATE CHANGE: EXPLORING THE POLICY SPACE
80 percent of the Intended Nationally Determined Contributions (INDCs)43 submitted as of 2016, a share second only to the energy sector. Together, countries that include agriculture in their mitigation contributions account for over
90 percent of global agricultural emissions.44 Similarly, more than 90 percent of INDCs submitted by developing countries refer to priority areas for adaptation in the agricultural sector, underlining the role of agriculture in promoting food security and providing a primary source of rural income.
The bottom-up approach and flexibility of the Paris Agreement has allowed a broader set of countries to reach a political consensus. This has avoided the shortcomings of the Kyoto Protocol, where legally binding targets for lower emissions and enforcement mechanisms alienated key emitters from participating in the accord. However, this greater discretion has not escaped criticism. The absence of binding emissions reduction targets at a national level and the lack of enforcement tools have raised concerns about the ability of the accord to hold countries accountable and to provide incentive structures that align national actions.
In most INDCs that include agriculture in mitigation efforts, emissions targets are included as part of broader, often economy-wide targets, without reference to concrete actions in agriculture for achieving these goals. INDCs of developed countries tend to be particularly vague, often expressed as a general commitment on economy-wide targets.45 Developing country INDCs tend to offer greater detail, many of them specifying climate actions to be undertaken in agriculture, alongside a more ambitious target conditional on technology transfer, capacity building and financial support from developed countries.46
Even the NDCs that display greater sectoral focus do not specify the instruments that will be used to deliver on commitments. The NDC of New Zealand, a country where agriculture accounts for a relatively large share of the country’s economic activities, commits to reducing economy-wide emissions in absolute terms by 30 percent compared to 2005 levels, but leaves open the question of the specific policies that will be used
to achieve this target. Indonesia’s aim to promote sustainable agriculture and plantations or Pakistan’s intention to promote no-till farming to improve soil carbon storage are more specific but can likewise be pursued through a myriad of domestic policy measures, ranging from taxes and subsidies to regulations and standards.
Clearly, much of the work to translate the Paris Agreement and the NDCs into concrete climate action is in the making, and a comprehensive assessment of how effective these policy frameworks are in contributing to adaptation and mitigation efforts can only be carried out in time. Yet, the limited reference to specific instruments in the NDCs submitted so far may also be attributed to technical challenges in designing and implementing appropriate policies – which may also include interactions between climate accords and trade regimes.47 Under the flexibility granted through the Paris Agreement, global climate action will largely be driven by countries’ NDCs. How those commitments are pursued in practice – using measures ranging from subsidies to standards – will in turn affect production, emissions and trade flows and, in some cases, will need to be considered in the light of multilateral trade rules.48 Such concerns need to be well understood and discussed to provide guidance to policy-makers.
The flexibility permitted under the Paris Agreement provided the space to negotiate the trade-off between universal participation, on the one hand, and the precision and ambition of the commitments, on the other. Moving forward, it will be necessary to provide an incentive structure that cultivates mutual support and trust to build confidence and commitment for deeper collaboration.
The initial steps have been taken, as Parties to the Paris Agreement are working towards creating the space for collective consultation. Parties to the Agreement have expressed their commitment to work on standard setting, including for agriculture. For instance, the Koronivia Joint Work on Agriculture,49 established at the Twenty-third Conference of the Parties (COP 23) in November 2017, sets up a framework through which technical knowledge can be bridged with climate action. The Talanoa
| 34 |

vk.com/id446425943
THE STATE OF AGRICULTURAL COMMODITY MARKETS 2018
Dialogue, an initial stocktaking exercise spanning the course of 2018 (the first full global stocktake takes place in 2023), marks an important first step forward in the commitment to strengthening the ambition in the NDCs progressively in five-year steps.50
Given the broad spectrum of policy tools available to policy-makers in implementing the Paris Agreement on agriculture, it will be important to deepen the discussion on the impact of those measures not just on climate change but also on agricultural production, trade and food security, and their potential interaction with global trading rules. Such a discussion will be important to encourage implementation of NDCs and to reduce potential concerns. As countries begin to deliberate on the timeline and nature of NDC pledges and review processes, a better understanding of the interaction between the Paris Agreement and multilateral trade rules will be necessary to ensure that these agreements interact in productive ways to provide a mutually supportive environment for climate change adaptation and mitigation policies.
WTO principles and key disciplines relating to agriculture
Established in 1995 as the successor to the General Agreement on Tariffs and Trade (GATT), the WTO serves as an institutional umbrella for treaties governing international trade. The principal objective of the WTO is to create a transparent and predictable system of international trade rules and to promote progressive liberalization of trade by minimizing trade distortions.
This objective is pursued through a range of agreements covering trade in goods, trade in services and trade-related aspects of intellectual property rights, adopted as a whole and indivisible package. This includes the GATT, the AoA, and a number of other agreements, inter alia, on Subsidies and Countervailing Measures (SCM), Sanitary and Phytosanitary Measures (SPS) and Technical Barriers to Trade (TBT).
Central to WTO disciplines is the principle of non-discrimination, aimed at ensuring fair and equitable treatment of all participants. The
non-discrimination principle is elaborated for trade in goods through the most-favoured nation (MFN) obligation (Article I of GATT), prohibiting discrimination between like products of different foreign origins, and the national treatment (NT) obligation (Article III of GATT) which prohibits discrimination between like products of foreign and domestic origin. The principle of non-discrimination is also reflected in other WTO agreements, notably the TBT Agreement (see Part 6).
The WTO agreements recognize the importance of other objectives, notably through Article XX of GATT on General Exceptions, which allows Members to take all necessary measures “to protect public morals,”51 “to protect human, animal or plant life or health,”52 or “relating to the conservation of exhaustible natural resources if such measures are made effective in conjunction with restrictions on domestic production or consumption.”53 However, these measures may not be applied “in a manner which would constitute a means of arbitrary or unjustifiable discrimination between countries where the same conditions prevail, or a disguised restriction on international trade.”54 The legitimacy of non-trade policy objectives, including protection of public health or the environment, is also reflected in other WTO agreements.55
The main challenge likely to be faced by mitigation policies on agriculture relates to the non-discrimination principle, which prohibits discrimination, for example, of otherwise “like” products differing solely in their carbon footprint as a result of different processes and production methods (PPMs). In simple terms, based on this rule it may be asked whether a country where the domestic price of meat increases as a result of adopting policies to reduce emissions in its livestock sector – due to additional costs incurred by local producers in order to comply with the new policies – would be able to level the playing field by increasing the tariff rates on meat imports produced through methods generating higher emissions.
Clearly, a meaningful analysis under WTO rules would need to take account of the nature of the specific measures envisaged and the relevant obligations at issue. If climate-smart agricultural policy measures entailed differences in the
| 35 |

vk.com/id446425943
PART 3 AGRICULTURAL TRADE AND CLIMATE CHANGE: EXPLORING THE POLICY SPACE
treatment of products of different origins, then determining the WTO compatibility of such measures could involve an assessment of:
(i) whether the imported product, produced by a method resulting in a different level of emissions compared with the domestic product, is to be considered a ‘like’ product; and, (ii) whether a given measure accords ‘less favourable’ treatment of imports than on like domestic products, and if so to what extent the regulatory distinctions between the products at issue can be explained by the pursuance of a legitimate objective.56 Part of the challenge is that the definition and measurement of carbon footprint is not determined and agreed upon internationally.
The “like product” test generally applied in WTO case rulings comprises four categories of characteristics that the products involved might share:
i.the physical properties of the products;
ii.the extent to which the products are capable of serving the same or similar end-uses;
iii.the extent to which consumers perceive and treat the products as alternative means of performing particular functions in order to satisfy a particular want or demand; and
iv.the international classification of the products for tariff purposes.57
For so-called “non-product-related PPMs” (npr-PPMs) that leave no trace in the final product – as in the case of the carbon footprint of the product – and do not alter any of its main characteristics, environmental objectives can be pursued under GATT Article XX, provided that these do not constitute arbitrary or unjustifiable discrimination. However, the application of WTO provisions to differentiating products solely based on their carbon footprint58 and the question as to whether such products can be considered not “like”, has never been raised in a WTO legal dispute.
Regarding the other condition for a violation of the non-discrimination obligation – the “less favourable treatment” and its possible justification on legitimate environmental grounds – the way an environmental standard is applied to imports as compared to local products may come under WTO scrutiny (an example of which can be seen in Box 3.2).
The principle of non-discrimination has been further articulated in the TBT Agreement applicable to technical regulations on trade, standards and mutual recognition. This Agreement would be relevant for mitigation measures and policies that would take the form of technical regulations or standards (see Part 6).
The implication of the non-discrimination principle is also further articulated in the AoA, serving as the principal source of basic disciplines on trade in agricultural products regulating border measures and support policies under three main pillars:
Market access: under the market access rules, ordinary customs duties are the only form of border protection instruments allowed. These are subject to maximum binding levels that cannot be exceeded by applied tariffs. Scheduled tariff bindings cannot be increased without compensation (Article XXVIII of GATT). All non-tariff measures (NTMs), for example quantitative import restrictions, outright import bans, variable import duties, etc., are prohibited (Article 4 of the AoA; Article XI of GATT).
Market access rules for agricultural products do allow for time-limited exceptions if certain conditions are met. For example, Article 5 of the AoA lays out conditions under which price-based or volume-based safeguard measures may be temporarily applied to address import surges. WTO rules on anti-dumping or countervailing duties also allow governments to take remedial measures against dumped or subsidized imports. Moreover, time-limited border protection against imports threatening local production is permitted under Article XIX of GATT and the WTO Safeguard Agreement, allowing governments to either apply additional duties or impose temporary quantitative restrictions.
However, as long as climate change does not constitute a valid justification under these exceptions, the use of market access measures for adaptation and mitigation purposes would be limited, unless it could be shown that products can be differentiated based on the emissions generated in their productions processes, and are eligible for different tariff rates (see Part 5 for detailed discussion).
| 36 |
vk.com/id446425943
THE STATE OF AGRICULTURAL COMMODITY MARKETS 2018
TABLE 3.1
TOTAL DOMESTIC SUPPORT
Measures that are not subject to reduction commitments. These may be used without monetary limits on support, provided the relevant implementation criteria are met. Exemption of support measures from reduction commitments may fall under the following three basic policy categories or "boxes":
Green Box |
Development Box |
Blue Box |
(AoA Annex 2) |
(Article 6.2 AoA) |
(Article 6.5 AoA) |
|
|
|
Green Box measures |
Development Box |
Blue Box measures |
include domestic |
measures provide |
are similar to Amber |
policies that are |
developing countries |
Box measures but |
considered to have |
with additional |
require farmers to |
no or minimal |
flexibility in |
limit production, thus |
impact on trade and |
providing domestic |
limiting production |
production, such as |
support. The |
distortions. At |
government services |
category covers |
present, there are no |
on research and |
measures taken by |
limits on Blue Box |
development, |
developing countries, |
subsidies. |
extension, and |
whether direct or |
|
investment in |
indirect, that are an |
|
infrastructure. Also |
integral part of their |
|
included are direct |
development |
|
payments to |
programmes and |
|
producers of basic |
encourage |
|
agricultural |
agricultural and rural |
|
products, such as |
development. These |
|
income support that |
include investment |
|
is decoupled from |
subsidies that are |
|
production, |
generally available |
|
assistance to |
to agriculture, |
|
promote structural |
agricultural input |
|
adjustment in |
subsidies generally |
|
agriculture, and |
available to |
|
direct payments |
low-income or |
|
under environmental |
resource-poor |
|
and regional |
producers, and |
|
assistance |
domestic support to |
|
programmes. |
producers to |
|
|
encourage |
|
|
diversification from |
|
|
growing illicit |
|
|
narcotic crops. |
|
Measures that are subject to scheduled reduction commitments and bound limits. Measures that do not meet the exemption criteria of Green Box, Development Box, or Blue Box, are often referred to as Amber Box measures.
Amber Box
(Article 6 AoA)
|
De minimis |
The Amber Box |
De minimis levels are |
includes measures to |
minimal amounts of |
support prices or |
domestic support |
input subsidies |
that are allowed |
directly related to |
even though they |
production. This |
distort trade – up to |
support is subject to |
5 percent of the |
limits: 32 WTO |
value of production |
members that had |
for developed |
non-exempt domestic |
countries, 10 percent |
support during the |
for most developing |
base period |
countries. The de |
undertook reduction |
minimis provision |
commitments. |
applies both to |
Members without |
support associated |
such commitments |
with a specific |
must limit their |
product and |
Amber Box support |
non-product-specific |
within the de minimis |
support. |
levels. The reduction |
|
commitments are |
|
expressed in terms of |
|
the “Total Aggregate |
|
Measurement of |
|
Support” (Total |
|
AMS), which |
|
effectively bounds |
|
trade-distorting |
|
support. |
|
Domestic support: The AoA places a limit on the use of support measures in favour of agricultural producers that are considered to be productionand trade-distorting (so-called Amber Box); the magnitude of such support is assessed using the aggregate measurement of support (AMS) calculation methodology. The provision of support that is judged to be nonor minimally trade-distorting (so-called Green Box measures) in conformity with established criteria is not subject to monetary limits. Product-specific and non-product-specific amber support to agricultural producers is not accounted for in the
AMS if it does not exceed specified de minimis levels. Direct payments under production limiting programmes (so-called Blue Box measures) are not subject to monetary limits. Table 3.1 provides a more detailed description of WTO disciplines on domestic support.
Trade-distorting support that would otherwise be covered by Amber Box provisions is permitted without monetary limits if used by developing countries as investment subsidies generally available to agriculture, input subsidies targeting low-income or resource-poor producers, or
| 37 |

vk.com/id446425943
PART 3 AGRICULTURAL TRADE AND CLIMATE CHANGE: EXPLORING THE POLICY SPACE
measures to encourage diversification away from growing illicit narcotic crops (the so-called Development Box). However, adaptation to climate change is not directly cited as a motive for policies seeking relief under Article 6.2, and no case has been brought under the WTO dispute mechanism.
Export competition: At the Tenth WTO Ministerial Conference in Nairobi in 2015, a decision was taken to eliminate export subsidies in accordance with an agreed timetable. In parallel, new disciplines were also agreed on other potentially relevant export competition instruments, namely export credits, international food aid, and exporting state-trading enterprises. These disciplines complement other relevant WTO provisions notably under the Subsidies and Countervailing Measures Agreement, the AoA, and GATT Article XVII on state-trading enterprises. n
RELATIONSHIP BETWEEN WTO REGULATIONS AND THE PARIS AGREEMENT
In principle, there is no fundamental conflict between climate change policies and trade rules. UNFCCC explicitly states that measures taken to combat climate change should not constitute a means of arbitrary or unjustifiable discrimination or a disguised restriction on international trade. The 2030 Agenda for Sustainable Development reinforces the idea that an open, non-discriminatory, multilateral trading system and actions that protect the environment and promote sustainable development can and must be mutually supportive.
Within the WTO, countries are granted a large measure of autonomy in determining their environmental objectives and the environmental legislation they enact and implement, insofar as it respects the requirements of WTO principles. While the non-discrimination obligation is a guiding principle in the WTO, the importance of other objectives, including environmental ones, is recognized within its rules and regulations through exceptions that form an integral part of the WTO agreements and should be considered together with the basic disciplines. The preamble
to the Marrakesh Agreement, for instance, recognizes the importance of coordinating policies on trade and environment, stating that the WTO aims at:
allowing for the optimal use of the world’s resources in accordance with the objective of sustainable development, seeking both to protect and preserve the environment and to enhance the means for doing so in a manner consistent with their respective needs and concerns at different levels of economic development.59
Within the GATT 1994, Article XX on General Exceptions offers additional provisions intended to ensure that commitments undertaken by the members do not hinder the pursuit of legitimate policy objectives. These include the protection of human, animal or plant life or health and the conservation of exhaustible natural resources, so long as these are implemented in a manner consistent with the principle of
non-discrimination.
In this regard, under various WTO agreements, in principle the protection of the environment qualifies as a legitimate justification for climate change adaptation and mitigation policy measures that would otherwise violate WTO rules.60
For example, in the US — Gasoline case, the only fossil fuel case settled to date in a formal dispute,61 the Appellate Body (AB) ruled that the manner in which the air contamination standards were applied – providing for more stringent rules to imported gasoline than to domestic gasoline – constituted an unjustifiable discrimination and a disguised restriction on international trade, violating the non-discrimination condition of Article XX (Box 3.2).
Within the WTO, the AB and the Panels62 – the adjudicating bodies of the WTO’s Dispute Settlement Body (DSB) – clarify as relevant the existing agreements that define the policy space and respect internationally agreed values, including environmental norms and human rights. However, neither the Appellate Body nor the Panels themselves are allowed to make new rules. Instead, they must look at the various provisions foreseen in the WTO agreements and invoked by the parties.
| 38 |

vk.com/id446425943
THE STATE OF AGRICULTURAL COMMODITY MARKETS 2018
BOX 3.2
THE US — GASOLINE CASE
The US — Gasoline case, one of the first to be brought before the WTO dispute settlement mechanism, dealt with a regulation by the United States Environmental Protection Agency under the Clean Air Act of 1990, to control toxic and other pollution caused by the combustion of gasoline manufactured in or imported into the United States of America.
The regulation established certain compositional and performance specifications for reformulated gasoline. The point of contention was that the regulation set out different methods for establishing baseline figures for domestic and imported gasoline sold on the United States of America market – a case of “less favourable treatment”.
Clean air was recognized as constituting an exhaustible natural resource falling within the scope of Article XX(g) of GATT, which provides for exceptions on the basis of conserving exhaustible natural resources if such measures are made effective in conjunction with restrictions on domestic production or consumption. While the Appellate Body found that the regulation was a measure relating to the conservation of exhaustible natural resources, it nonetheless concluded that, as applied, the measure failed to meet the requirements of the chapeau of Article XX of the General Agreement because the so-called baseline establishment rules in the US regulation – whereby sellers of domestic gasoline were authorized to use an individual baseline, while sellers of (chemically identical) imported gasoline had to use the more onerous statutory baseline – “are not justified under Article XX of the General Agreement”.
SOURCE: Appellate Body Report, US – Gasoline, dated 29 April 1996, p.28 lit.a and c, cited in Häberli, C. 2018. Potential Conflicts Between Agricultural Trade Rules and Climate Change Treaty Commitments. SOCO 2018 Background Paper, Rome.
At the same time, although the Dispute Settlement Body findings constitute useful interpretation of WTO rules, each and every ruling only applies to the case at hand, and cannot be considered a final interpretation: litigating parties and adjudicators can always
argue in another case that a different interpretation is more appropriate. In turn, the authority to issue a legally binding interpretation rests with the Ministerial Conference and the General Council (Article IX:2 of the WTO Agreement), as opposed to an interpretation in dispute settlement.63
WTO provisions can also be the subject of amendments. The Ministerial Conference or the General Council take such decisions (Article X of the WTO AoA). There have only been three amendments to the WTO AoA since its inception. These include the “affordable drugs” amendment of the Trade-Related Aspects of Intellectual Property Rights (TRIPS) Agreement, which allowed a rules amendment to protect the public health needs of people in poor countries.64
A similar procedure applies to waivers, which can be used to exempt a particular WTO member or group of members from the duty of complying with specific rules and obligations. Although more frequent and somewhat easier to obtain than amendments, waivers are subject to time limits, and each extension must be justified.65 For example, the Kimberley Waiver was adopted in 2006 to allow importers to deny MFN market access rights to so-called “blood diamonds” (revenue from sales of which financed authoritarian regimes, oppression and conflict).66 It sits at the juncture of trade and human rights and is the only case involving “non-product-related PPM” of potential relevance for measures intended for climate change adaptation and mitigation.
The scope of existing exceptions, amendments and waiver clauses leaves room for accommodating the potential implications for the non-discrimination principle of measures aimed at climate change adaptation and mitigation. However, for effective adaptation and mitigation policies, a thorough discussion is needed on climate-smart measures and the corresponding WTO disciplines, particularly on the possibility of differentiating agricultural products based on non-product-specific PPM. n
| 39 |

vk.com/id446425943
PART 3 AGRICULTURAL TRADE AND CLIMATE CHANGE: EXPLORING THE POLICY SPACE
POLICY SPACE FOR EFFECTIVE IMPLEMENTATION OF NATIONALLY DETERMINED CONTRIBUTIONS (NDCs)
Discussions on the interpretation and application of WTO disciplines in the context of climate change adaptation and mitigation will be particularly important.
There is scope for WTO members to pursue legitimate environmental protection objectives. However, the application of the rules in regard to treatment of identical agricultural products that differ solely in their carbon footprint remains untested – a challenge for climate change measures, which often target processes and production methods. Depending on their design and application, certain measures, such as subsidies and taxes, which could be used to implement the Paris commitments, may potentially encounter challenges under the trade rules.
With few available INDCs/NDCs specifying the intention or policy measures to reduce emissions along food systems, translating the ambition of the Paris Agreement may be a challenge. At the same time, this challenge can present an opportunity for policy-makers to consider policies that will contribute towards reducing emissions globally.
In practice, this challenge stems in part from the lack of an internationally-agreed definition of carbon footprint, which could constrain the discussions.
While maximum policy space for discussions is needed on the juncture of the WTO agreements and the Paris Agreement, the policy space should also ensure that national measures do not negatively affect other countries or unduly restrict trade and investment, especially in developing countries. This development dimension poses a particular challenge under the multilateral trade rules. Developed countries and
those where agriculture is a relatively small sector are clearly in a different position in their choices to poor countries. This is especially true for poor countries with a high carbon footprint, as is often the case where small-scale and subsistence farmers, nomads, and fishers are representative of the agricultural sector.
The WTO agreements contain special provisions that give developing countries certain flexibilities, for instance longer time periods for implementing agreements and commitments, or measures to increase trading opportunities (see Box 3.3). While the Paris Agreement requires all countries to take the development dimension into account when formulating their NDCs, each country has the flexibility to select the policy tools that it considers climate smart or development friendly, taking account of prevailing conditions and individual circumstances.
As the multilateral peer review process of the NDCs has not yet taken place, it is difficult to propose solutions in concrete terms. In this regard, the discussion on the WTO rules and the Paris Agreement would help identify policy areas and measures:
i.that are not subject to commitments;
ii.where quick solutions for strengthening the mutual supportive approach might be available; and
iii.where a review of trade rules (or waivers thereof) and available international standards might be necessary.
Policy tools should only be chosen after a thorough review and assessment of the relative costs and benefits in a given context. For instance, incentives to promote climate-smart policies may not qualify for the Green Box, irrespective of their role in reducing emissions (see Part 4 for a discussion on domestic support). Similarly, a carbon tax might be climate-smart, yet more trade-restrictive than a subsidized sequestration programme (see Part 5 for a discussion on trade implications of a carbon tax).
Climate change is likely to affect agriculture even more than other sectors, and small-scale producers in developing countries – the majority of the world’s family farmers – will be among those facing the greatest challenge in the
| 40 |

vk.com/id446425943
THE STATE OF AGRICULTURAL COMMODITY MARKETS 2018
BOX 3.3
DEVELOPING COUNTRIES: SPECIAL AND DIFFERENTIAL TREATMENT
The different challenges faced by developing and developed countries are recognized in the Paris Agreement and in WTO agreements. The Paris Agreement recognizes differentiated responsibilities and capacities and stresses the role of international cooperation, in particular through its provisions on financial and technical assistance to help developing countries meet their mitigation and adaptation objectives. In the WTO agreements, the distinction is recognized through the special and differential treatment (SDT) for developing countries.
In recent years SDT has focused on helping developing countries seize opportunities to expand exports, most notably through Aid for Trade. In the context of climate change, the Aid for Trade initiative can be strengthened both to enhance resilience in the agricultural sectors of developing countries and to enable them to cope with the challenges and opportunities that might be created for the international trading system by climate change.
In the context of climate policy, SDT implies that developing countries, particularly LDCs, could be accorded longer adjustment periods to meet stringent obligations and product standards relating to carbon footprint. Priority could also be placed on capacity building and the provision of technical assistance that facilitate transitioning to a lower-emission food and agricultural system – for instance by implementing
technical standards and assistance with carbon accounting for certification. Labelling could be another useful mechanism to promote the sale of sustainable, low-carbon food products from developing countries in importing countries (see Part 6).
In some cases, international trade could adversely contribute to climate change by stimulating the production of agricultural products with high carbon footprint. Palm oil production in Asia provides a case in point, where global demand and trade resulted in widespread deforestation and increase in the use of high-emitting peatland. In the longer run, however, the transition to lower-emissions agricultural and food systems is less dependent on trade and more reliant on the transfer and adoption of improved technology and on adopting appropriate domestic policies that are land-sparing and stimulate improvements in agricultural productivity, so that emissions per unit of output are reduced.
In this regard, while it is important that trade provides sufficient mechanisms to help developing countries manage short-term weather-induced production shortfalls and emergencies, trade policy measures must also ensure that appropriate domestic measures are taken to increase the resilience of agriculture and the economy more generally, helping countries to increase stability in international markets for basic agricultural commodities.
SOURCE: Blandford, D. 2018. Border and related measures in the context of adaptation and mitigation to climate change. SOCO 2018 Background Paper, Rome, FAO.
absence of efficient, effective, and climateand trade-friendly solutions. In this regard, key issues identified in this report require consideration across multiple international platforms, including those around climate (UNFCCC/COP), development (Sustainable Development Goals), and multilateral trade. Intergovernmental cooperation will be particularly important for constructing a tradeand development-friendly framework for the elaboration of climate-smart policies under the Paris Agreement. On 14 November 2017, COP23 decided to “address issues related to agriculture,
[...] taking into consideration the vulnerabilities of agriculture to climate change and approaches to addressing food security.”67 If countries are to move forward with the implementation of policies that are effective in achieving climate change adaptation and mitigation, while at the same time meeting other international objectives – such as a fair multilateral trading system, and the implementation of the 2030 Agenda for Sustainable Development – an approach that strengthens the mutually supportive role of corresponding agreements will need to be discussed. n
| 41 |

vk.com/id446425943
PERU
Native women in the field sifting quinoa ©FAO/Heinz Plenge (FAO/MINAG)
vk.com/id446425943
PART 4 ADAPTING TO CLIMATE CHANGE AND MITIGATING ITS IMPACT: DOMESTIC POLICIES AND SUPPORT MEASURES
Key points
1 Many government measures can promote adaptation, mitigation and food security
and have no or minimal distortionary impact on trade. These include research and development, extension, training, technical assistance and investments that can all promote the adoption of climate-smart agriculture practices.
2 Appropriate incentives may nevertheless be necessary to further facilitate
adaptation and mitigation in agriculture. For example, some types of subsidies can promote large-scale adoption of climate-smart agriculture practices. While discussions may have to focus on their potential impact on production and trade, consideration should also be given to their effectiveness in adaptation and mitigation.
3 Agricultural insurance will be increasingly necessary to protect against climate risk,
but its cost is likely to rise. While the use of insurance subsidies may, in certain cases, be trade distorting, the need to hedge against climate risk should be considered.
4 Emergency humanitarian food reserves at the regional level can promote
adaptation to climate change and contribute to food security. These can enhance efficiency and reduce costs by pooling resources across countries.

vk.com/id446425943
PART 4
ADAPTING TO CLIMATE CHANGE AND MITIGATING ITS IMPACT: DOMESTIC POLICIES AND SUPPORT MEASURES
Agricultural policies address a broad array of objectives. They promote efficiency and correct market failures, such as constraints faced by farmers in adopting new technologies due to lack of information. They support equity, helping to achieve and maintain a level of farm income that keeps pace with income in other economic sectors and is in line with society’s aspirations. They strive to ensure the provision of public goods to society at large. And in many developing countries, they promote food security through measures aimed at both producers and consumers.
Countries provide various types of support to farmers, ranging from direct payments that contribute towards maintaining farm incomes without affecting output; to subsidies for inputs such as electricity, water and fertilizer that can increase production. All these measures shape agriculture’s adaptation and mitigation to climate change. Domestic support measures are also subject to the rules and disciplines of WTO agreements, particularly the AoA, which aims to reduce trade distortions and establish a fairer agricultural trading system that will increase market access and improve the livelihoods of farmers around the world. n
POLICIES TARGETING ADAPTATION AND MITIGATION IN PRODUCTION UNDER THE AGREEMENT ON AGRICULTURE
Climate change will likely affect the relative prices of agricultural products and those of inputs (see Part 2). These changes may prompt farmers to change the crops they grow and the types of livestock they raise in order to increase returns and reduce risk. Farmers may also alter their management practices, and some of the actions they take to enhance productivity could reduce emissions.
Policies will be necessary to facilitate such autonomous adaptation and mitigation efforts. Provided farmers have the necessary information and access to markets and technology and do not face institutional barriers to adoption, such as lack of finance, they are likely to take advantage of new technologies and practices that are both cost reducing and climate friendly.
More than 30 countries, mostly in sub-Saharan Africa, specifically refer to climate-smart agriculture (CSA) in the INDCs they submitted to the UNFCCC. Climate-smart agriculture is an approach that helps to guide actions to transform and reorient agriculture and food systems (including fisheries and aquaculture) to support development and to ensure food security in a changing climate. CSA has three main objectives: sustainably increasing agricultural productivity and incomes; adapting
| 44 |

vk.com/id446425943
THE STATE OF AGRICULTURAL COMMODITY MARKETS 2018
and building resilience to climate change; and reducing and/or removing GHG emissions, where possible.68
A wide range of policies and regulations creates a set of incentives and disincentives for achieving progress across the three objectives, but making the transition to climate-smart agriculture requires balancing trade-offs across economic, social and environmental goals. Central to CSA is the development and adoption of innovative technologies and practices that promote productivity growth, adaptation and mitigation. Other measures include improvements in agricultural risk management and safety nets such as emergency food reserves and social protection, but also measures and regulations that promote mitigation in agriculture through reduced emissions or increased carbon sequestration.
Clearly, CSA requires policy coherence across sector-specific and economy-wide interventions. It also involves higher costs related to funding climate-smart investments and providing the capacity and necessary incentives to producers to adjust to a changing climate, especially small-scale family farmers in developing countries where food security and rural development are priorities.
Trade-distorting policies: Market price support and input subsidies
Price support or payments linked to production fall in the Amber Box and are subject to limits, with specific exemptions for developing countries (see discussion in Part 3). Within these limits, countries might use such policies to influence the production of commodities that are important for food security or to diversify production to reduce the potential vulnerability of food supplies under climate change.
For example, the Price Loss Coverage (PLC) programme or the Agricultural Risk Coverage (ARC) programme in the United States of America, introduced with the 2014 Farm Bill, are reported as Amber support. Under PLC, participating grain and oilseeds producers receive a payment when national season-average farm prices fall below fixed reference prices. Under ARC, payments occur when county or farm-level revenues per acre fall below 86 percent of a benchmark.69 In India, price policies aim to support farmers, promote rural development, and at the same time address food insecurity. The Food Corporation of India provides market support by setting minimum prices that ensure returns for farmers, while subsidizing food distribution to help poor consumers, in line with the 2013 National Food Security Act.70
Market price support, often used in conjunction with trade policies, has been shown to increase production, thus contributing to domestic food availability. But such support can also result in food surpluses, which in the case of large producing countries can significantly distort trade. Within the context of climate change, unless measures are taken to improve agriculture’s emissions efficiency (that is to reduce emissions per unit of output), the increase in production due to market price support would also result in an increase in total emissions. A reduction in this production-coupled domestic support could reduce output and emissions in a manner similar to the imposition of a carbon tax.71
Like market price support, input subsidies can also lead to higher production. Input subsidies are subject to Amber Box provisions, but not if used by developing countries to benefit low-income or resource-poor producers (see Table 4.1). Indeed, in developing countries input subsidies can promote food security by redressing, at least temporarily,
| 45 |

vk.com/id446425943
PART 4 ADAPTING TO CLIMATE CHANGE AND MITIGATING ITS IMPACT: DOMESTIC POLICIES
market failures such as missing markets for credit and inputs, and a lack of knowledge of the benefits of using technologies, such as drought-resistant seeds and fertilizers.
For example, in Africa, where fertilizer consumption averages about 22 kilograms of nutrients per hectare – that is only 15 percent of the world’s average – many countries have implemented large-scale, multi-year fertilizer subsidies.72 The Agricultural Input Subsidy Programme in Malawi and the Fertilizer Support Programme in Zambia are examples of this. These programmes aim to address cash constraints faced by farmers and strengthen the demand for inputs to increase production and enhance food security. They target small-scale family farms through vouchers and grants and attempt to promote private sector solutions for the provision and distribution of inputs, with the goal of consolidating input marketing systems, which currently suffer from a lack of economies of scale.73
Available evidence suggests that subsidies have been effective in raising fertilizer use, average yields and agricultural production. But their success depends strongly on implementation performance, and cannot be entirely separated from exogenous factors such as favourable weather.74 Climate change may compromise the effectiveness of these programmes, but there is also a trade-off between food security objectives and adaptation and mitigation targets. Subsidies can encourage production, but also the inefficient use of fertilizer: if inputs are underpriced they will tend to be overused, which over the long term can result in maladaptation to climate change. However, with fertilizer having a high marginal productivity in parts of Africa (small amounts of fertilizer can result in proportionally larger amounts of output), such subsidies could result in both increased production and emissions efficiency. In order to increase production and reduce emissions per unit of output, subsidy programmes should encourage the efficient uptake of inputs as part of an integrated package of sustainable production practices. For example in the case of fertilizer subsidies, programmes must promote the judicious use of fertilizers and enhance farmers’ knowledge on soil properties and site-specific nutrient management.75
Domestic support with minimal trade-distorting effects
Domestic support measures that are covered by the Green Box (Annex 2 of the AoA) include programmes that are decoupled from production. These measures include expenditure on research and development (R&D) and extension, payments under structural and regional investment programmes, support for food reserves and agricultural risk management. These measures have no (or at most minimal) distorting effects on trade (see Table 4.1).
Research and development, and extension programmes
R&D, training and extension, and advisory services are highly relevant for pursuing climate change adaptation and mitigation objectives (Table 4.1, paragraph 2). Improvements in technology and their adoption by farmers are crucial. Productivity in agriculture has benefited enormously from changes in technology brought about by R&D. From the early 1950s to the late 1970s, the Green Revolution in Asia – driven by technology improvements targeting small farms – more than doubled food production, although at the same time it caused environmental damage.
Technology adoption and improvements in crop and livestock management have resulted in major increases in Total Factor Productivity (TFP) in many regions.76 It is estimated that the growth in TFP accounted for roughly two-thirds of the increase in global agricultural output during the period 2001–14, with growth in inputs such as land, labour, fertilizer, energy and irrigation accounting for the remainder (see Figure 4.1).
Technology and farm management improvements should not only promote productivity but also foster adaptation and reduce emissions per unit of output, as for example CSA practices do.
Technological change, extension and training will play a vital role in promoting CSA approaches and ensuring sustainability in agriculture in the face of climate change. Climate-smart technologies adopted today will make a huge difference in the future. For example, in Mali and Malawi, half of the population engaged in
| 46 |

vk.com/id446425943
THE STATE OF AGRICULTURAL COMMODITY MARKETS 2018
TABLE 4.1
ANNEX 2 OF THE AGREEMENT ON AGRICULTURE: GREEN BOX SUPPORT MEASURES.
Paragraph
2
Description
Provision of general services that provide benefits to agriculture or the rural community, such as research and extension, pest and disease control, inspection services, marketing and promotion services and infrastructural services, including those associated with environmental programmes.
Key provisions
Must not involve direct payments to producers or processors. Support for infrastructural services limited to capital costs, not operating costs.
3 |
Public stockholding programmes for food security |
May include aid for private storage. Purchases and |
|
purposes. |
sales must be at current market prices. |
||
|
|||
|
|
|
|
|
|
Can be direct provision of food or at subsidized |
|
4 |
Domestic food aid programmes. |
prices. Government purchases must be at current |
|
|
|
market prices. |
|
|
|
|
|
|
|
Payments must not relate to production, prices or |
|
5&6 |
Decoupled income support to producers. |
factors of production. No production required to |
|
|
|
receive payment. |
|
|
|
|
|
7 |
Government financial participation in income |
Compensation for maximum of 70 percent of income |
|
loss and triggered by an income loss that exceeds |
|||
insurance and income safety-net programmes. |
|||
|
30 percent compared to a reference period. |
||
|
|
||
|
|
|
|
|
|
Triggered by a production loss greater than |
|
|
Payments (made either directly or by way of |
30 percent with respect to an average in prior years |
|
8 |
government financial participation in crop insurance |
and limited to replacement cost. Combined payments |
|
|
schemes) for relief from natural disasters. |
under paragraphs 7 and 8 not to exceed |
|
|
|
100 percent of total loss. |
|
|
|
|
|
9 |
Structural adjustment assistance provided through |
Conditional on total and permanent retirement. |
|
producer retirement programmes. |
|||
|
|
||
|
|
|
|
10 |
Structural adjustment assistance provided through |
Requires land retirement for minimum of three years |
|
resource retirement programmes. |
or permanent disposal of livestock. |
||
|
|||
|
|
|
|
11 |
Structural adjustment assistance provided through |
No linkage of aid to specific products or to their |
|
investment aid. |
prices is allowed. |
||
|
|||
|
|
|
|
|
|
Payment limited to the extra costs or loss of income |
|
12 |
Payments under environmental programmes. |
involved in complying with conditions on production |
|
|
|
methods or inputs. |
|
|
|
|
|
|
|
Payments limited to extra costs or loss of income |
|
13 |
Payments to producers in disadvantaged regions |
involved in agricultural production in a prescribed |
|
under regional investment programmes. |
area. These cannot be based on production or prices |
||
|
in any year after a base period.
agriculture are women who, as a result of gender inequality, have significantly less access to land, information, finance and agricultural inputs. The challenges they face will only worsen in light of climate change; CSA programmes in these countries are working to leverage information and communication technologies (ICTs) to provide them with access to agricultural inputs.77
In Zambia, investments have been made in extension and training aimed at promoting conservation agriculture (CA) – a climate-smart
practice based on minimum soil disturbance, crop rotation and soil organic cover.78 CA holds tremendous potential for all sizes of farms and agro-ecological systems. It can facilitate adaptation through increased water infiltration that allows soils to absorb most of the rainwater even during extreme rainfall events, and improve water-holding capacity which increases the ability of plants to survive during drought periods. At the same time, CA can reduce emissions from fossil fuels compared to conventional agriculture by up to 60 percent, and
| 47 |
vk.com/id446425943
PART 4 ADAPTING TO CLIMATE CHANGE AND MITIGATING ITS IMPACT: DOMESTIC POLICIES
FIGURE 4.1
SOURCES OF GROWTH IN GLOBAL AGRICULTURAL OUTPUT
AVERAGE ANNUAL GROWTH RATE OVER PERIOD
3.0%
2.5%
2.0%
1.5%
1.0%
0.5%
0.0%
1961–70 |
1971–80 |
1981–90 |
1991–00 |
2001–14 |
|
New land |
|
Irrigation |
|
Input/Area |
|
Total Factor Productivity |
|
|
|
|
SOURCE: USDA, Economic Research Service, International Agricultural Productivity data products, as of October 2017. Inputs include fertilizer, machinery, labour, and other inputs per acre of cropland.
limit the use of fertilizer and agrochemicals in the long term by 20 percent. However, CA’s largest contribution in mitigating climate change can be obtained from carbon sequestration – under humid temperate conditions,
0.1–0.5 tonnes of organic carbon can be captured on average per hectare of land.79
Investments in training and extension in Zambia have benefited approximately 16 percent
of small-scale family farmers in the country, enhancing not only production levels and food security, but also soil organic matter content. This brought about increases in soil nitrogen, and improvements in water-holding capacity and infiltration.80
In Canada, the dairy Agricultural Greenhouse Gas Program aims to reduce methane emissions from cows through: diet optimization; the use of lipids in cattle diets to decrease enteric emissions; and harvesting forages at optimum maturity to maximize their digestible energy. The
research programme also focuses on the use of improved technology for manure management (storage and treatment of animal waste) to reduce emissions of nitrous oxide.81
Evidence on the impact of climate-smart agriculture approaches on adaptation and mitigation is being built up. In Zambia, where efforts to apply conservation agriculture have been significant, studies suggest that its adoption improves the level of sustainable crop productivity and income, and that individual CA components (minimum tillage, permanent soil cover and diversified rotation) have specific effects on improving soil fertility.82
More generally, agricultural R&D has a very high social value. Annual internal rates of return on investments in agricultural R&D range between 20 and 80 percent.83 In developing countries, the dollar-for-dollar impact of such investments on the value of agricultural production is generally within the range of 6 to 12 percent across
| 48 |

vk.com/id446425943
THE STATE OF AGRICULTURAL COMMODITY MARKETS 2018
countries.84 Countries that have heavily invested in agricultural research while simultaneously investing in extension services have had the strongest productivity growth.85 A climate-smart stimulus on R&D and extension services could have an enormous benefit on productivity and climate change adaptation and mitigation.
Support for risk management
Climate change is likely to increase the frequency and severity of extreme weather events. It is almost certain that the frequency and magnitude of warm daily temperature extremes will increase by the end of the century. It is very likely that the length, frequency and/or intensity of heatwaves will also increase, as will the frequency of heavy precipitation events. There is medium confidence that droughts will intensify in some seasons and areas. It is difficult to predict the impact of extreme weather events on major crops, however most analyses suggest that the variability for key food staples such as rice, maize and wheat will increase as the century progresses.86 These increased risks will negatively affect the economic returns of agriculture, farmers’ livelihoods, and the capacity of the sector to invest and innovate. Strengthening the capacity to manage risks will be important.
Farmers manage variations in production and prices as part of their regular business. In developed countries where agriculture is adequately integrated with financial markets, price risk can be managed through the use of futures markets and related financial instruments. Forward contracting may also be possible, through which a producer locks in a selling price with a future purchaser at the time production decisions are made. In developing countries for instance, the Purchase for Progress programme of the United Nations World Food Programme (WFP) uses forward contracts to purchase food produced by small-scale family farmers through farmers’ organizations. Farm households also manage risks by diversifying production or their income sources, for example through off-farm employment.
These private risk-management strategies can be used to manage short-term price risk, but they are unlikely to be suitable for managing
production risks due to extreme weather events. For this, agricultural insurance is often used or disaster assistance may be provided by the government – Annex 2 of the AoA involves several programmes oriented towards promoting such risk management instruments (see Table 4.1, paragraphs 7 and 8).
Agricultural insurance is generally characterized by indemnity-based programmes that cover losses against named perils (such as hail) or multiple perils (such as drought or excessive moisture, hail, wind, frost, insects and disease). Indemnity-based insurance involves high costs associated with administering contracts and determining losses with large numbers of dispersed farmers. It is also prone to moral hazard and adverse selection problems, which add to these costs.87
Because costs are generally high relative to other risk-management strategies, such as income diversification, the demand for agricultural insurance products, in the absence of subsidies, tends to be low. This makes insurance markets commercially unviable, and insurance programmes in developed countries are generally highly subsidized. According to a survey of agricultural insurance programmes in 65 developed and developing countries, almost two-thirds of the countries subsidized premium costs with an average subsidy rate of 47 percent.88 For example, the public costs of the programme in the United States of America are projected to exceed USD 8 billion annually over the period 2017–27, an expenditure of almost 90 cents for every USD 1 premium written.89
The high cost of conventional, indemnity-based insurance makes it difficult for developing countries to provide subsidized coverage for numerous and geographically-dispersed
small-scale family farmers. Innovations such as weather-index-based insurance seek to address this challenge. With index-based programmes, farmers are paid whenever rainfall or temperature is lower or higher than specific thresholds that are likely to cause a significant fall in crop yields. Events such as droughts, frost, or precipitation can also have specific thresholds assigned; measurements are then taken by weather stations or even satellite technology.
| 49 |

vk.com/id446425943
PART 4 ADAPTING TO CLIMATE CHANGE AND MITIGATING ITS IMPACT: DOMESTIC POLICIES
Index-based insurance can be provided at lower costs – insurers do not need to make field-level assessments and therefore operational costs (and thus insurance premiums) are reduced.
In India, the Weather-based Crop Insurance Scheme (WBCIS) provides insurance to over
13 million farmers for various climatic risks such as deficit rainfall, dry spells, excess rainfall, low temperature, high temperature, high humidity, and high wind. The Agriculture and Climate Risk Enterprise (ACRE) in sub-Saharan Africa is now the largest index insurance programme in the developing world in which the farmers pay a market premium, and the first agricultural insurance programme worldwide to reach smallholders using mobile technologies. Subsidies do, however, continue to play a crucial role.90 For WBCIS, premium subsidies vary by insurance programme and by state, but in general the government provides between 60 and 75 percent of the premium.
Agricultural insurance has witnessed a dramatic growth, largely as a result of substantial government subsidies. In the United States of America, for example, average coverage levels for most row crops have grown significantly and continuously since the late 1990s, when subsidies were increased for higher coverage levels.91 However, agricultural insurance is not entirely neutral when it comes to production distortions. Crop insurance subsidies have had minor impacts on production in areas where insurance is broadly available across crops. Impacts are likely to be larger on crop choice when insured crops compete for land against uninsured crops, or when crops where revenue insurance is available compete against crops where only yield insurance is available.92
At the same time, the link between production and insurance, although weak, has raised concerns that subsidies not only help reduce risks but may also distort production and trade, especially in developed countries. Government support for crop and income insurance, as well as disaster assistance, is exempt from reduction commitments under the AoA. To be exempt, such programmes must meet certain criteria relating to production loss thresholds, payment limits in respect of losses of income, livestock, land or
other production factors, as well as to the calculation of such payments. Both paragraphs 7 and 8 (see Table 4.1) establish limits on compensation payments.
These criteria make it difficult to report insurance programmes in the Green Box. Most area-based yield programmes or weather index-based derivative products tend to offer coverage for losses higher than 70 percent of income or yield. These coverage levels are often based on expected yield or income outcomes, which may differ from averages of past outcomes. Another important point is that the 70 percent coverage limit under paragraph 7 of Annex 2 may be overly stringent for index-based insurance: the effects of perils on individual yield or revenue vary widely across farmers, but index variability is typically substantially lower.
Agricultural insurance forms an important component of CSA. However, because of discrepancies between programmes that are actually in place and the conditions needed to meet Annex 2 criteria, most countries that notify insurance programmes to the WTO do so as Amber Box support. It is likely that increased yield variability due to climate change will increase the costs of insurance and premiums. This may reduce the attractiveness of agricultural insurance as an adaptation option, unless governments continue to subsidize a large share of the premium costs. Insurance companies may also be less willing to underwrite risks without large public support in the form of reinsurance. Consequently, the amount of support that should be notified as Amber Box under the AoA is likely to increase with climate change, unless changes are made in the conditions that govern this.
Stabilizing domestic markets – support for stockholding
While agricultural insurance is important, the need for risk management extends beyond the farm to the broader population, since both availability and access to food can be affected by shocks induced by climate change. In many developing countries spending on food is a major share of total consumer expenditure, and short-term price spikes due to climate-induced reductions in production can have serious
| 50 |

vk.com/id446425943
THE STATE OF AGRICULTURAL COMMODITY MARKETS 2018
implications for food security, especially for the poor and the vulnerable.
In this context, food stocks can contribute to climate change adaptation. Holding food stocks such as grain costs money both through the expense involved in maintaining and operating storage facilities and the opportunity cost of delaying the sale of the commodity. Private stockholders will hold inventories in line with their expectations on the price, purchasing food when prices are low and releasing stocks onto the market when prices are high. In this manner, stocks, much like trade, tend to buffer the impacts of fluctuations in supply.
Public stockholding programmes have a long history. In many cases, their primary objective is to ensure food security and address emergency food shortages. In other cases, buffer stocks – large public stockholding programmes that operate through domestic procurement to stabilize prices within a predetermined band and in combination with trade measures – are used to support producer prices.
Such large-scale public stockholding programmes have been criticized for a number of reasons. First, they tend to be costly, in terms of both procurement and storage. The longer food commodities are held in storage, the costlier it becomes given the risk of deterioration and the need to rotate existing stocks. Second, procurement prices are often set at higher levels relative to market prices, leading to large stock acquisitions and distorting production decisions. Third, buffer stocks can distort international markets if governments decide to dispose of stocks through exports.
In fact, public spending on the operating losses of large-scale stockholding programmes in many countries has been higher than investment in agricultural R&D. In India for example, public spending on stockholding programmes in 2008–09 amounted to
1.5 percent of GDP, compared with 0.06 percent dedicated to agricultural R&D. In Zambia the cost of maintaining public stocks was estimated at 1.9 percent of GDP in 2011, while spending
on agriculture as a whole in 2010 accounted for 0.6 percent of GDP.93
Unlike large-scale buffer stock schemes, relatively small public food reserves designed exclusively for meeting emergency food needs minimize distortionary impacts while helping to mitigate the impact of production shortfalls, particularly in countries where transportation costs may delay imports in times of supply shortages. In addition, such food emergency reserves are less likely to disrupt private sector storage activity, and if linked to social protection mechanisms can effectively target the poor and the vulnerable.
The costs of emergency reserves can be reduced through regional collaboration in stockholding policy and by combining physical stocks with financial resources that allow countries to purchase additional supplies in times of need.94 Rather than requiring each country to hold sufficient food stocks to meet a shortfall in its domestic production, regional emergency food stockholding schemes, such as the ASEAN Plus Three Emergency Rice Reserve (APTERR) and the Economic Community of West African States (ECOWAS) Regional Food Security Reserve, can allow countries to pool risks (see Box 4.1).
Provided they also meet policy-specific criteria laid out in paragraph 3 of Annex 2 of the AoA, expenditures associated with the acquisition and holding of stocks for food security purposes can qualify under the Green Box (see Table 4.1). Buffer stocks and price stabilization mechanisms in which procurement is based on pre-announced statutory prices that exceed base-period reference prices could be considered as trade-distorting support. In such a case, expenditures that cover their operating losses could be considered as subsidies to be reported under the Amber Box.95
The provisions in paragraph 3 of Annex 2 have been controversial in the WTO, with a number of members seeking to relax the criteria to allow developing countries’ public stockholding programmes that incorporate price support to qualify for the Green Box. The proposed changes have been strongly opposed by a number of exporting countries on the basis that if administered prices are set too high they will »
| 51 |

vk.com/id446425943
PART 4 ADAPTING TO CLIMATE CHANGE AND MITIGATING ITS IMPACT: DOMESTIC POLICIES
BOX 4.1
REGIONAL FOOD RESERVES
ECOWAS Regional Food Security Reserve
The ECOWAS Regional Food Security Reserve was established following a decision at the Economic Community of West African States (ECOWAS) Heads of State Conference in February 2013. The reserve has a physical component composed primarily of cereals (millet, sorghum, maize and rice) and tubers (cassava). There is also a financial component, equal to approximately two-thirds of total resources. The reserve is intended to be the third line of defence in preventing and managing food crises, complementing local stocks in villages and communities and national food security stocks in member states. It has a planned intervention capability of 410 000 tonnes and its financing plan is based on a combination of national, regional and international resources, while initial funding for the acquisition of stocks was provided by the European Union (Member Organization). A special unit within the Regional Agency for Agriculture and Food (RAAF), which is headquartered in Lomé, Togo, is responsible for the technical management of the reserves with the involvement of the Network of National Food Security Storage Companies and Agencies (RESOGEST). The Regional Food Security Reserve strengthens the forward position of assistance relying on existing storage infrastructure in four subspaces: (i) Northern Benin, Niger, Nigeria (East Subspace); (ii) Southern Burkina Faso, Northern Côte d’Ivoire, Northern Ghana, Southern Mali, Northern Togo (Central Subspace);
(iii)Cabo Verde, the Gambia, Guinea-Bissau, Senegal (West Atlantic Subspace); and,
(iv)Guinea, Liberia, Sierra Leone (Atlantic Gulf Subspace).
The ASEAN Plus Three Emergency Rice Reserve (APTERR)
The ten member countries of the Association of Southeast Asian Nations (ASEAN), in partnership with the People’s Republic of China, Japan and the Republic of Korea, agreed on the creation of APTERR in October 2011. APTERR became operational in July 2012 and is composed of earmarked pledges and physical pledges (rice exclusively allocated to the reserve). The total volume of rice earmarked under the scheme is 787 000 tonnes. The agreement does not require distinct physical stocks of rice, as long as a member makes its earmarked stock available to other members, as a permanent commitment. APTERR is governed by a council composed of 13 members, one from each of the signatories to the agreement. Day-to-day management is performed by a secretariat based in Thailand, with operations supported by an initial endowment and annual financial contributions provided by APTERR Parties.
There are three programmes or "Tiers" under which APTERR stocks can be released. Under Tier 1, in case of an emergency, earmarked reserves can be released under the terms of a forward contract, which is valid for three years and can be renewed. Under Tier 2, stocks can be released to requesting countries on a voluntary basis through long-term loan agreements or
grants. Tier 3 covers the release of donated stocks and cash donations for the procurement of rice to meet acute (and likely localized) emergencies.
The regional reserve is not deployed to achieve a target price or even a price band, but only to meet food requirements of a member country in extremis. The agreement contains a commitment that the operations of the reserve will not distort normal international trade in rice.
Source: USAID and ECOWAS Commission. 2012. Methodological guide to the operations of the Regional Agency for Agriculture and Food; Briones, R.M. 2011. Regional Cooperation for Food Security: The Case of Emergency Rice Reserves in the ASEAN Plus Three. Sustainable Development Working Paper Series No. 18, Asian Development Bank.
| 52 |
vk.com/id446425943
THE STATE OF AGRICULTURAL COMMODITY MARKETS 2018
»distort production decisions, potentially leading to surpluses and exports that could depress world market prices.
Other non-trade distorting support under Green Box
Infrastructure investments and resource management
Climate-smart agriculture applications can benefit from a range of activities identified in Annex 2 (see Table 4.1, paragraph 2), including capital expenditures for the development of off-farm infrastructure that could be required to promote climate change adaptation and mitigation, roads and other transport infrastructure, water supply facilities, dams and drainage schemes, and infrastructure associated with environmental programmes.96
In sub-Saharan Africa – a region already vulnerable to climate change – investments in rural roads and irrigation are considered to be most urgent in view of the need to move away from rainfed agricultural systems to irrigated systems. For example in the Gambia – where changes in rainfall and temperature as well as soil salinization are expected to limit crop productivity – the National Agricultural Investment Plan is focused on improving water management. It is doing this through the construction of water control structures and irrigation facilities to boost rice production, while at the same time promoting carbon sequestration through forest and rangeland management.97
Environmental programmes
Another category of relevance under Annex 2 relates to environmental programmes and ecosystem services (see Table 4.1, paragraph 12). In developed countries, such programmes have become increasingly popular for rewarding farmers for supplying environmental goods and for addressing some of the negative external effects of agricultural production.
Some programmes designed to encourage the adoption of practices that reduce emissions or encourage carbon sequestration could fall under this heading, but in order to be considered as Green Box support, they must satisfy specific
criteria. The key provision is that such payments must be limited to the extra costs or loss of income incurred in complying with the government programme. If payments under environmental programmes included an incentive component (a subsidy) to encourage the adoption of best practices in excess of these limits, it would make them ineligible for the Green Box exemption.
Structural adjustment assistance
Climate change may require more fundamental adjustments in agriculture than simply changing practices. In some regions agriculture may become highly disadvantaged or may no longer be viable. Several programmes identified in Annex 2 could be used to address these issues. Aid could be provided on a sustained basis to producers in disadvantaged regions under paragraph 13 of Annex 2 (see Table 4.1). Producers who are in a position to retire could be aided through the provisions under paragraph 9. Producers engaged in crop or livestock activities that become non-viable under climate change could receive aid under paragraph 10. Investment aid to restructure operations due to the effects of climate change could be provided under paragraph 11.
While the primary focus in many countries will be to ensure the continued viability of agriculture under climate change, this may not be possible for some areas that are already disadvantaged and that will be particularly affected by climate change. In these cases, sufficient financial resources may be required to facilitate more radical adjustment. n
POLICIES FOR EMISSIONS REDUCTION
GHG emissions by agriculture and other environmental externalities (such as water pollution) can in theory be addressed through taxation. Taxes directly tackle the failure of the market to take the social costs of climate change into account. They ‘internalize’ the cost of an environmental externality so that people can base their production and consumption decisions on the full costs of a product.
| 53 |

vk.com/id446425943
PART 4 ADAPTING TO CLIMATE CHANGE AND MITIGATING ITS IMPACT: DOMESTIC POLICIES
Environmental damage can also be reduced through regulation. Environmental regulations reflect rules and requirements controlling pollution or the release of undesirable materials – for example, performance standards set by ceilings on the amount of emissions by vehicles.
Carbon taxes and carbon pricing
Many analysts propose carbon taxes to address the societal externalities caused by GHG emissions through global warming. Indeed, carbon taxes or carbon pricing schemes are found in many countries.98 There are two major challenges in using taxes: first, there are difficulties in determining the appropriate level of the tax; and second, there are problems in applying the tax to emissions from agriculture.
Estimating the potential economic cost of climate change is extremely difficult. Economists would argue that the size of the tax should be based on the costs that emissions impose on society. That would require estimates of: (i) the effect of emissions over time on global warming; (ii) the value of the damage created by global warming; and, (iii) the tax rate required to avoid that damage. Making these calculations requires the use of climate models, as well as physical and economic models. In practice, most studies estimate the tax required to reduce emissions to a certain level or to limit the projected increase in global temperature to a certain amount. This is not the same with estimating the economic value of the damage caused by GHGs, but in practice a tax calculated in this way would reduce the emitting activity, and thus emissions.
Applying the tax is also complex. Because agriculture and associated changes in land use involve emissions of all three major GHGs – carbon dioxide, nitrous oxide and methane – structuring a carbon tax for agriculture is very complicated.99 At the same time, carbon sequestration could presumably merit a subsidy. The application of a tax on agricultural activities is also challenging due to the non-point source nature of emissions. Taxing emissions from point sources, such as power
plants that burn fossil fuels, is feasible. Emissions from the smokestack can be monitored and a tax can be applied to the amount of carbon dioxide discharged to the atmosphere. The tax per unit of carbon dioxide can also be transformed to a tax per litre of fuel, in line with the fuel’s carbon footprint.
In agriculture and land use, however, sources of emissions are often diffuse and difficult to monitor. For example, fertilizer use is a major source of nitrous oxide emissions, but measuring the emissions from a given area of land is complicated, since it depends on factors other than the amount of fertilizer applied, many of which are site-specific (e.g. management practices, soil types, and weather). In order to overcome these technical challenges, taxes could be applied on agricultural products on the basis of estimates of the direct emissions involved in their production. Unlike fuel consumption, however, agricultural production involves many sources of emissions that would need to be covered. For crops, this would include emissions resulting from the use of organic or inorganic fertilizer, depletion of soil carbon through tillage, burning of crop residues, and water management (especially for rice). For livestock, it would include emissions from enteric fermentation and manure management.
However, irrespective of how a carbon tax on agriculture was structured, its immediate effect would be to raise prices of agricultural products in line with the emissions that correspond to their production. Table 4.2 shows the effects of a USD 20 tax per tonne of carbon dioxide equivalent on wheat, rice, beef and chicken for selected countries, underlining the trade-offs between food security and climate change targets, especially for developing countries.
Since extensive livestock production emits high levels of GHGs per unit of output, beef prices would rise relative to grains and poultry, which would be likely to shift consumption towards beef substitutes. Price impacts would be lower for countries where agricultural production is more emissions-
| 54 |

vk.com/id446425943
THE STATE OF AGRICULTURAL COMMODITY MARKETS 2018
TABLE 4.2
EFFECTS OF A USD 20 TAX PER TONNE OF CARBON DIOXIDE EQUIVALENT ON SELECTED AGRICULTURAL PRICES FOR SELECTED COUNTRIES (PERCENT INCREASE)
Country |
Wheat |
Rice |
Beef |
Sheep meat |
Chicken |
Australia |
3.0 |
3.4 |
11.0 |
13.4 |
0.2 |
|
|
|
|
|
|
Brazil |
2.2 |
2.5 |
16.5 |
16.7 |
0.2 |
|
|
|
|
|
|
China |
2.6 |
4.0 |
12.5 |
5.9 |
0.6 |
|
|
|
|
|
|
Ethiopia |
1.2 |
7.1 |
71.5 |
25.2 |
2.8 |
|
|
|
|
|
|
European Union |
2.4 |
13.1 |
8.2 |
10.1 |
0.2 |
|
|
|
|
|
|
India |
3.6 |
3.5 |
54.4 |
22.4 |
0.5 |
|
|
|
|
|
|
Indonesia |
2.4 |
5.6 |
22.6 |
22.3 |
2.9 |
|
|
|
|
|
|
New Zealand |
2.4 |
- |
8.9 |
8.1 |
0.2 |
|
|
|
|
|
|
United States of America |
2.4 |
5.6 |
6.0 |
- |
0.2 |
SOURCE: Blandford, D. and Hassapoyannes, K. 2018. The role of agriculture in global GHG mitigation. OECD Food, Agriculture and Fisheries Papers No. 110. OECD Publishing.
efficient. In the example, the impact of a USD 20 tax per tonne of carbon dioxide equivalent would have a proportionately greater price impact on grassand range-fed beef producers (in Ethiopia, India, and Indonesia) than in countries where confined feeding is more prevalent (in the European
Union [Member Organization] and the United States of America).
While these estimates of the impact of a carbon tax are useful for illustrative purposes, there are still problems with this approach. For example, if the tax were applied on the basis of average emissions generated in the production of a tonne of grain or a kilogramme of meat, it would result in a decline in production, but not necessarily reduce emissions. Individual producers might have no incentive to reduce emissions through changes in production practices. In fact, they could use production methods that generate higher than average emissions without facing a penalty.
Agricultural production is much more likely to be influenced by carbon taxes on energy through their impact on fossil fuels. Food and agriculture is an energy-intensive sector in many countries, both in terms of the
energy used in the production of agricultural inputs, such as fertilizer, and of the fuel and energy used on farms and in processing, storage, transportation and delivery of food to consumers.
While taxes are imposed directly on fossil-fuel energy in some countries (e.g. on transportation fuels or natural gas used for heating), a more comprehensive approach to pricing emissions is through cap-and-trade schemes (see Box 4.2). Cap-and-trade schemes penalize producers of higher emitting products and services by forcing them to pay for emissions permits, while providing incentives for the adoption of lower-emission technologies.
Even with cap-and-trade schemes, however, configuring agriculture into the system is challenging due to the high costs of monitoring emissions to ensure the integrity of the trading scheme. Nevertheless, emissions reduction credits for agriculture, forestry and other land uses (AFOLU), such as for on-farm production of bioenergy or tree planting, are already included in some schemes. Like a carbon tax, the value of carbon offsets would be subject to similar uncertainty in
measurement, as well as presenting issues for »
| 55 |

vk.com/id446425943
PART 4 ADAPTING TO CLIMATE CHANGE AND MITIGATING ITS IMPACT: DOMESTIC POLICIES
BOX 4.2
CAP-AND-TRADE SCHEMES
Cap-and-trade (emissions trading) uses a mixture of regulatory and market instruments to reduce emissions, with the government setting a limit (cap) on the total volume of emissions for an industry or sector over a particular period of time. In order to emit a pollutant (e.g. a GHG), firms that are covered by the cap are required to obtain permits to cover the volume of their emissions. Often firms are given a permit allocation equal to baseline emissions (the volume prior to the imposition of the cap), although the allocation can be determined by other means (e.g. through an auction). Once the scheme is in operation, firms that need to obtain additional permits to cover the volume of their emissions have to purchase permits from other firms. The permit price corresponds to a tax on emissions. Since there is an incentive for an individual firm to reduce costs, there is an incentive to reduce emissions through the adoption of emissions-reducing technologies. Unlike a carbon tax, which has an uncertain impact on the volume of emissions, cap-and-trade has the advantage of focusing directly on achieving a quantitative emissions target. It is therefore easier to implement in the context of global targets for reductions in emissions to constrain an increase in global temperature.
The emissions price generated under cap-and-trade is heavily influenced by how the magnitude of the cap relates to total emissions. When the cap implies a substantial (modest) reduction in emissions, permit prices will be high (low). Permit prices under most cap-and-trade schemes are relatively low, e.g. permit prices under the largest current scheme, the European Union’s Emissions Trading Scheme (ETS) have generally fluctuated around USD 6 per tonne of carbon dioxide equivalent. This was mainly due to a surplus of emissions permits accumulated due to the economic crisis that started in 2008. However, permit prices have recently increased to about
USD 18. New measures to be introduced as part of the EU ETS reform package which will address the imbalance between the supply and demand of permits are expected to further drive this upward trend. In order to meet the temperature goal of the Paris Agreement, it is estimated that global carbon prices would need to be in the range of
USD 40–80 in 2020 and USD 50–100 by 2030. The use of cap-and-trade was prompted by the
Kyoto Protocol of 1997, under which most developed nations agreed to legally-binding GHG emissions targets. Emissions trading schemes (ETS) have been introduced in 36 countries – with an additional 5 under consideration – and 15 of those countries are using emissions trading in combination with carbon taxes. Trading schemes are also used at the subnational level by cities, states and provinces.
A number of cap-and-trade schemes involve cross-border cooperation. The ETS of the European Union (Member Organization) is a regional carbon market involving 31 countries, with an additional linkage scheduled to the ETS in Switzerland. Carbon markets in California and Québec are linked, with Ontario planning to join in 2018. Most cap-and-trade schemes cover a limited range of industries, particularly power plants and heavy industry and other large emitters of GHGs from which emissions can be monitored relatively easily. Some national schemes allow for the purchase of land-use carbon offsets at the national level (e.g. forestry in the New Zealand ETS). Some allow for the purchase of international offsets (e.g. EU ETS). The UN Environmental Programme administers two international offset programmes: the Clean Development Mechanism (CDM) and the Reducing Emissions from Deforestation and Forest Degradation (REDD) programme. No current cap-and-trade scheme includes emissions from agriculture, although proposals were made to include emissions from pastoral agriculture in the New Zealand ETS.
SOURCES: Schmalensee, R. and Stavins, R.N. 2015. Lessons learned from three decades experience with cap-and-trade. Discussion Paper 15−51. Resources for the Future, Washington, DC; World Bank/Ecofys/Vivid Economics. 2016. State and Trends of Carbon Pricing. Washington, DC. https://openknowledge.worldbank.org/bitstream/handle/10986/25160/9781464810015.pdf?sequence=7&isAllowed=y
| 56 |

vk.com/id446425943
THE STATE OF AGRICULTURAL COMMODITY MARKETS 2018
BOX 4.3
REGULATORY POLICIES: DEFORESTATION AND BIOFUELS
Agriculture, forestry and other land uses (AFOLU) generates about one-fifth of GHG emissions. Agriculture contributes to climate change directly by emitting methane, nitrous oxide and carbon dioxide through crop and livestock production and the use of fossil-fuel energy, and indirectly by affecting net carbon emissions through its impact on soil, forests and other land uses, particularly through the deforestation of land for conversion to agriculture. In contrast, soil and the biomass of growing trees and plants can act as natural carbon sinks reducing the anthropogenic effect of GHG emissions.
Deforestation
Despite agriculture’s capacity to sequester carbon, net total (direct and indirect) GHG emissions from AFOLU are positive. In addition to taxation and emissions trading schemes, their reduction could also be pursued solely through regulation. Restrictions could be placed on certain practices in order to reduce emissions, for example on how manure is managed. Regulations on land use in AFOLU could be used to reduce emissions or to increase carbon sequestration. Examples include placing restrictions on the conversion of wetlands or on deforestation. Most countries prohibit the clearing of forests in protected areas, such as national parks and wildlife reserves. In other cases, legal provisions prescribe the reasons that may justify conversion of forest land to agricultural use, the associated conditions, and the institutions responsible for implementing and enforcing the law. For example, the requirement for an environmental impact assessment is common when investors acquire forest land and wish to convert it to agriculture. Countries with such requirements include Cambodia, Cameroon, Gabon, Ghana, Indonesia and Viet Nam, and the Members of the European Union (Member Organization).
Biofuels
As of the beginning of 2018, 65 countries (including the Members of the European Union [Member Organization]) had consumption mandates or targets on
the use of biofuels in place or under consideration. Biofuel mandates have been considered as climate-smart policies, since they are viewed as a mechanism for promoting the substitution of sustainable sources of energy for fossil fuels. However, biofuels remain controversial because of the potential impact on GHG emissions when agricultural production practices and direct and indirect land-use effects are considered. First generation biofuels that rely on agricultural crops – such as maize and sugarcane to produce ethanol or oilseeds to produce biodiesel – have been subject to particular criticism for being competitive with food uses, thereby putting upward pressure on food prices and potentially increasing their volatility. Depending on the costs of ethanol production, high oil prices can strengthen the demand for biofuels and increase crop prices. When oil prices are low relative to costs of biofuel production, crop prices are determined only by supply and demand for food, unless mandates are in force.
Global demand for liquid fuels for transportation is likely to decline in the future due to advances in the use of alternative power sources, such as electricity. But in cases where liquid fuels are likely to continue to play a major role, it is probable that biofuels will be important. If prices for oil fall as a result of a shift away from fossil fuels, it may be difficult for biofuels to be competitive in the absence of consumption mandates or carbon taxes that make oil expensive to use. Consumption mandates for agricultural products are not explicitly covered in the AoA. However, WTO domestic support issues may potentially be raised if subsidies are used to encourage biofuel production or consumption, which in turn can affect crop production. As such, biofuel policies distort crop production and thus are Amber Box in nature. Under its Biomass Crop Assistance Program (BCAP), the United States of America provides financial assistance to owners and operators of agricultural and non-industrial private forest land who wish to establish, produce, and deliver biomass feedstocks – expenditures related to BCAP fall within the Amber Box.
SOURCES: FAO. 2016. State of the World’s Forests 2016. Forests and agriculture: land-use challenges and opportunities. Rome; Smith, P., Bustamante, M. et al. 2014. Agriculture, Forestry and Other Land Use (AFOLU). In Climate Change 2014: Mitigation of Climate Change, Contribution of Working Group III to the Fifth Assessment Report of the Intergovernmental Panel on Climate Change. Cambridge University Press New York; Biofuels Digest. 2018. Biofuels mandates around the world; USDA. 2016. Building blocks for climate smart agriculture and forestry. Washington, DC; Balcombe, K. G. & Rapsomanikis, G. 2008. Bayesian Estimation and Selection of Nonlinear Vector Error Correction Models: The Case of the Sugar-Ethanol-Oil Nexus in Brazil. American Journal of Agricultural Economics, 90(3): 658−668.
| 57 |

vk.com/id446425943
PART 4 ADAPTING TO CLIMATE CHANGE AND MITIGATING ITS IMPACT: DOMESTIC POLICIES
»monitoring and enforcement. For some countries, especially those that experience fast population growth, offsets could also present food security concerns, for example if cropland were taken out of production for carbon sequestration purposes. n
ASSESSING THE POLICY SPACE FOR DOMESTIC SUPPORT: ADAPTATION AND MITIGATION IN THE CONTEXT OF THE AGREEMENT ON AGRICULTURE
Agriculture has to contribute towards meeting multiple objectives across the economic, social and environmental dimensions of sustainability, and policy-makers will have to balance trade-offs between objectives and between shortand long-term needs. Domestic support instruments should promote productivity increases but also adaptation and mitigation, ensuring food security as well as safeguarding the environmental sustainability of agriculture in the face of climate change. The policy space is affected by technical challenges, in particular the difficulties of internalizing the cost of emissions in production and consumption. It is also supported and shaped by WTO disciplines that aim to establish a fairer agricultural trading system that will increase market access and improve the livelihoods of farmers around the world.
Economically viable and sustainable farm technologies and practices are available, but barriers to their adoption must be overcome. Wide adoption of practices such as conservation agriculture can enhance productivity and promote adaptation and mitigation. A lot can be done within the present rules and commitments in Annex 2 of the AoA – e.g. promoting R&D and the dissemination of transformative technologies that are included in the Green Box.
Significant technical assistance to farmers and coordination in R&D, as well as investments in
green infrastructure are required to develop high-impact, quickly implementable and easily accessible technical options for enhancing sustainability and improving productivity, especially in developing countries. Moreover, significant improvements are needed in extension, training and information and communication systems to promote large-scale adoption of climate-smart agriculture practices that will enhance productivity, promote adaptation to climate change and reduce emissions.
Nevertheless, on their own expenditures on such general services may not be sufficient to promote climate-smart agricultural technologies. In developing countries in particular, family farmers face significant cash constraints. Moreover, introducing new technologies to large numbers of farmers – who are risk averse and face different constraints and incentives – will be challenging without additional incentives. A key requirement for environmental payment programmes to qualify under the Green Box is that such programmes have a minimal effect on production, and that payments should not exceed the additional costs of adoption or a resulting loss of income incurred by farmers. It may be difficult to induce producers to adopt practices that have clear adaptation or mitigation benefits from society’s perspective, but that generate little or no private gain in the short term. In some cases, there may be a need to discuss the rules that govern the use of climate-smart farm practices that have a high social payoff in terms of reducing emissions intensity in production, and identify a set of options that would be eligible for an exemption on the use of incentive payments to stimulate their adoption. Appropriate incentives to adopt
productivity-enhancing and emissions-reducing CSA practices and technologies could promote both effectiveness and equity.
Agricultural insurance can aid farmers in managing increasing climate risks and in investing in their farms. But such insurance can be unaffordable, particularly for small-scale family farmers, in the face of climate change. The use of subsidies to promote innovative crop insurance programmes may therefore be justified in the context of likely increases in the frequency and intensity of extreme weather events. For
| 58 |

vk.com/id446425943
THE STATE OF AGRICULTURAL COMMODITY MARKETS 2018
example, a de minimis level of insurance subsidies (a maximum percentage of policy cost) that promotes insurance uptake but at the same time reduces the likelihood of distortions, could be discussed for a Green Box exemption. In addition, regional agricultural insurance programmes, such as the Agriculture and Climate Risk Enterprise in Eastern and Southern Africa, could help reduce costs for providers as they span diverse geographical areas with a high incidence of uncorrelated risk.
Regional efforts can also promote emergency food reserves, such as the ECOWAS Regional
Food Security Reserve. Given the risk of production shocks due to climate change, such food reserves should be integrated into the food security strategies of vulnerable developing countries. Regional schemes can improve efficiency and reduce costs over national reserves by pooling resources across countries. Such reserves would function best when linked to early warning systems that identify climate and price risks and their impacts on food security and livelihoods. Moreover, linking these reserves to social protection systems could also provide targeted intervention to those in need.100 n
| 59 |

vk.com/id446425943
KANO, NIGERIA
A sugar cane vendor at the sugar cane market in Kano where an FAO project aims to increase productivity and food production on an economically and environmentally sustainable basis, reduce year-to-year variability in agricultural production, and improve people’s access to food.
©FAO/Pius Ekepi

vk.com/id446425943
PART 5 ADAPTING TO CLIMATE CHANGE AND MITIGATING ITS IMPACT: THE ROLE OF TRADE POLICIES
Key points
1 Trade can contribute towards improving food security. In the short term, trade can
provide a mechanism for addressing production shortfalls due to extreme weather events. In the long term, it can contribute towards adjusting agricultural production in an efficient manner across countries.
2 Well-functioning international markets provide a reliable source of food. Sound,
transparent and predictable trade policies can contribute towards international market stability and support climate change adaptation efforts.
3 Trade could support mitigation efforts and contribute to reducing global agricultural
GHG emissions. Consensus on how to define and calculate carbon footprint and measures to facilitate trade in low-carbon footprint products would be helpful.

vk.com/id446425943
PART 5
ADAPTING TO CLIMATE CHANGE AND MITIGATING ITS IMPACT: THE ROLE OF TRADE POLICIES
Trade is key for economic growth and an essential component of any food security strategy. In many countries, there is significant potential for increasing agricultural production at a relatively low cost. For other countries with different production costs, supplying all their own food needs could be prohibitively expensive. Generally, every country has a comparative advantage in some goods and services, and all countries could potentially gain when engaging in trade. With climate change expected to alter the comparative advantage of agriculture across regions and countries, trade has an important role to play in facilitating both shortand long-term adaptation.
In the short term, trade helps to offset the impact of localized fluctuations in production by providing a mechanism for accessing additional supplies. In the long term, trade helps to facilitate changes in the location of production across regions necessitated by climate change (see Part 2). The impact of climate change on the comparative advantage of agricultural production in some countries means that pursuing self-sufficiency in food is not always an efficient solution. Countries should assess all available options and employ a range of measures and investments to promote adaptation (see Part 4), including trade and the adoption of innovative technologies to enhance productivity and maintain or increase their comparative advantage in order to ensure continued viability of agriculture, vibrant rural areas and food security. n
THE ROLE OF TRADE AND TRADE POLICIES IN CLIMATE CHANGE ADAPTATION
Agricultural trade policies, such as tariffs and export restrictions, are commonly used along with domestic policies by countries to protect local producers from international competition. In developing countries, these policies are also used to reduce import dependence or to promote self-sufficiency in staple foods. In some countries, tariffs and export taxes provide an important source of government revenue.
In turn, trade and trade policies will also play an important role in shaping adaptation to climate change and to extreme weather events and in ensuring food security in times of weather-induced production shortfalls. In 2008, Kenya increased imports to meet demand when faced with a 20 percent decline in maize production vis-à-vis the five-year average due to unfavourable weather conditions coupled with political instability. More recently, South Africa – a traditional producer and net exporter of maize – has increased imports to dampen the effect of successive droughts (see Figure 5.1).
In Bangladesh, the damage caused to the agricultural sector by severe floods in 2017 led to an increase in retail rice prices by over
30 percent. In order to stabilize the market, rice imports are estimated to have climbed to about 1.3 million tonnes (a considerable increase from the 2016 volume of 62 000 tonnes, when inventories were ample and tariffs high), with the government reducing custom duties on rice
| 62 |
vk.com/id446425943
THE STATE OF AGRICULTURAL COMMODITY MARKETS 2018
FIGURE 5.1
MAIZE IMPORTS, 2000–2016 (BILLION USD)
USD BILLIONS
Maize imports, Kenya
0.5
0.45
0.4
0.35
0.3
0.25
0.2
0.15
0.1
0.05
0
2000 |
2001 |
2002 |
2003 |
2004 |
2005 |
2006 |
2007 |
2008 |
2009 |
2010 |
2011 |
2012 |
2013 |
2014 |
2015 |
2016 |
USD BILLIONS
Maize imports, South Africa
0.7
0.6
0.5
0.4
0.3
0.2
0.1
0
2000 |
2001 |
2002 |
2003 |
2004 |
2005 |
2006 |
2007 |
2008 |
2009 |
2010 |
2011 |
2012 |
2013 |
2014 |
2015 |
2016 |
SOURCE: FAO calculations using data from World Integrated Trade Solution (accessed March 2018)
from 25 percent to 10 percent in June 2017 and from 10 percent to 2 percent in mid-August.101
Indeed, regions that could be affected by extreme weather events will have to import food to cover the production shortfall and ensure food security in the short term. Importing food requires financial resources, and it is possible that LDCs and NFIDCs may experience balance of payments problems due to climate change. In this case, international safety net mechanisms will have an important role to play (see Box 5.1).
Generally, in a closed economy where high import tariffs or import restrictions insulate the domestic market from international trade, weather-induced shocks in domestic food production can lead to significant variations in food prices. In the case of staple foods in developing countries, such as rice in Asia and maize in Eastern and Southern Africa, for which demand cannot swiftly respond to price changes, price increases will undermine access to food by poor and vulnerable population groups.
In an open economy, international markets can help create a buffer to fluctuations in domestic
| 63 |

vk.com/id446425943
PART 5 ADAPTING TO CLIMATE CHANGE AND MITIGATING ITS IMPACT: TRADE POLICIES
food production and exert a stabilizing effect on domestic prices. Openness to trade can contribute to short-term adaptation, but it does not guarantee that prices in an individual country will be more stable. This is because production shocks in large players can result in world market price fluctuations. At the same time, trade policies can also influence the magnitude and frequency of fluctuations in world market prices and thus affect the role of global markets as a reliable and stable source of food
On the one hand this takes place through the transmission effect, whereby policies allow variability in domestic production to be channelled to international markets through variations in imports or exports. In this case, a country responding to a production shortfall by importing food can ‘export’ its variability to the world market. On the other hand, the impact of trade on a given economy would also depend on the strength of the absorption effect, indicative of the extent to which the variability in international prices is absorbed in domestic markets. The extent to which countries ‘import’ world market variability through trade, in turn, depends on the level of border measures and how linked or insulated the economy is from world price fluctuations.102
In this regard, trade policies matter in promoting stability in international markets and in enhancing buffer capacity in the context of climate change. Actions by countries that have significant volumes of exports or imports relative to the volume of world trade, in particular, can have a large potential impact on international price instability. Yet the importance of exercising prudence in using trade policies is not confined to large market players, as high transmission and low absorption can have a cumulative effect also across small countries. Weather-induced fluctuations in production, for instance, can often be positively correlated across countries in a given geographical region, compounding the impact on the international market.
Moreover, openness to world markets is not only useful for ensuring international price stability in the short term but can also facilitate long-term adaptation. With climate change affecting agricultural production across countries, the
BOX 5.1
IMPORT FINANCING FOR DEVELOPING
COUNTRIES
Importing food requires funds, and it is possible that LDCs and food-importing NFIDCs may experience balance of payments problems due to climate change. Many NFIDCs export cash crops
– such as cotton, coffee, cocoa and sugar – production of which could also decline due to changing climate, resulting in export revenue losses. The issue of balance of payments problems arising from food imports was also included in the WTO Marrakesh Decision on measures concerning the possible negative effects of the reform programme on LDCs and NFIDCs.
While there is a long-term need to transform agriculture and the broader economy (see Part 2), in the short term, countries that experience balance of payments problems due to extreme weather events and production shortfalls can resort to international safety net mechanisms provided by the International Monetary Fund (IMF).
For example, the Rapid Credit Facility provides outright disbursement without programme-based conditionality; the Standby Credit Facility provides support for short-term financing and adjustment needs caused by policy slippages or shocks; and the Extended Credit Facility allows for assistance for underlying imbalances expected to be resolved over the medium term.
elimination of distortions in production and consumption created by border measures and export subsidies would increase trade globally, enhancing its adaptive role by facilitating the movement of agricultural products from surplus to deficit regions (see Box 5.2).
Consequently, trade policies need to be considered carefully against their potential impact on shaping the role of world markets for agricultural goods in facilitating adaptation to the effects of climate change. The use of trade measures, such as export subsidies, import tariffs and export restrictions, which limit the openness of domestic agricultural markets and alter the »
| 64 |
vk.com/id446425943
THE STATE OF AGRICULTURAL COMMODITY MARKETS 2018
BOX 5.2
THE EFFECTS OF GLOBAL AGRICULTURAL MARKET INTEGRATION
Part 2 of this report underlined the uneven impact of changing climate on agricultural production and trade. Generally, trade is projected to increase in order to offset the impact on food availability due to production declines in low-latitude regions. But affected regions are found to be faced with declining food purchasing power and an increasing need to import food.
If an opening of markets through the removal of all border measures on agricultural products (including import tariffs, export taxes and subsidies) is introduced into the model, global agricultural trade is likely to expand. Market integration and freer trade reinforces the adaptive role of trade to climate change, although it results in both gains and losses.
For many net food-importing regions (such as most of Africa), open markets will deepen their net importing position further than that projected under the climate change scenario. For those regions that are expected to have a comparative advantage in agricultural production under the climate change scenario and are significant net exporters (for example, South America and Oceania), the elimination of border measures and subsidies will further increase their net exports. Bilateral trade flows will also increase between all regions. For example, Latin America is expected to significantly increase its exports to all other regions, including to
sub-Saharan Africa and South and Southeast Asia.
FIGURE 5.2
IMPACT OF OPEN MARKETS ON NET TRADE POSITIONS UNDER CLIMATE CHANGE IN 2050
|
|
|
|
|
|
|
|
|
|
|
|
|
|
|
|
|
|
|
|
|
|
|
|
|
|
|
|
|
|
|
|
|
|
|
|
|
|
|
|
|
|
|
|
|
|
|
|
|
|
|
|
|
|
|
|
|
|
|
|
|
|
|
|
|
|
|
|
|
|
|
|
|
|
|
|
|
|
|
|
|
|
|
|
|
|
|
|
|
|
|
|
|
|
|
|
|
|
|
|
|
|
|
|
|
|
|
|
|
|
|
|
|
|
|
|
|
|
|
|
|
|
|
|
|
|
|
|
|
|
|
|
|
|
|
|
|
|
|
|
|
|
|
|
|
|
|
|
Russian Federation |
|
|
|
|
|
|
|
|
|
|
|||||||||||||
|
|
|
|
|
|
|
Canada |
|
|
|
|
|
|
|
|
|
|
|
|
|
|
|
|
|
|
|
|
|
|
|
|
|
|
|
|
|
|
|
|
|
|
|
|
|
|
|
|
|
|
|
|
|
|
|
|||||||||||||||||||||||||||||||
|
|
|
|
|
|
|
|
|
|
|
|
|
|
|
|
|
|
|
|
|
|
|
|
|
|
|
|
|
|
|
|
|
|
|
|
|
|
|
|
|
|
|
|
and the Caucasus |
|
|
|
|
|
|
|
|
|
|
|||||||||||||||||||||||||||||||
|
|
|
|
|
|
|
|
|
|
|
|
|
|
|
|
|
|
|
|
|
|
|
|
|
|
|
|
|
|
|
|
|
|
|
|
|
|
|
|
Rest of Eastern |
|
|
|
|
|
|
|
|
|
|
|
|
|
|
|
|
|
|
|
|
|
|
|
|
|
|
|
|
|
|
|
|
|
||||||||||||
|
|
|
|
|
|
|
|
|
|
|
|
|
|
|
|
|
|
|
|
|
|
|
|
|
|
|
|
|
|
|
|
|
|
|
|
|
|
|
|
|
|
|
|
|
|
|
|
|
|
|
|
|
|
|
|
|
|
|
|
|
|
|
|
|
|
|
|
|
|
|
|
||||||||||||||
|
|
|
|
|
|
|
|
|
|
|
|
|
|
|
|
|
|
|
|
|
|
|
|
|
|
|
|
|
|
|
|
|
|
|
|
|
|
|
|
|
|
|
|
|
|
|
|
|
|
|
|
|
|
|
|
|
|
|
|
|
|
|
|
|
|
|
|
|
|
|
|
|
|||||||||||||
|
|
|
|
|
|
|
|
|
|
|
|
|
|
|
|
|
|
|
|
|
|
|
|
|
|
|
|
|
|
|
|
|
|
|
|
|
|
|
|
Europe |
|
|
|
|
Central |
|
|
|
|
|
|
|
|
|
|
|
|
|
|
|
Rest of |
||||||||||||||||||||||||
|
|
|
|
|
|
|
|
|
|
|
|
|
|
|
|
|
|
|
|
|
|
|
|
|
|
|
|
|
|
|
|
|
|
|
|
|
|
|
|
|
|
|
|
|
|
|
|
|
|
|
|
|
|
|
|
|
|
|
|
|
|
|
|
|
|
|
|
|
|
|
|
||||||||||||||
|
|
|
United States of America and |
|
|
|
|
|
|
|
|
|
|
|
|
|
|
|
|
|
|
|
Western |
|
|
|
|
|
|
|
|
|
Eastern |
|
|
|
|
|
|
|
|
Asia |
|
|
|
|
|
|
|
|
|
|
|
|
|
|
|
||||||||||||||||||||||||||||
|
|
|
|
|
|
|
|
|
|
|
|
|
|
|
|
|
|
|
|
|
|
|
|
|
|
|
|
|
|
|
Europe |
|
|
|
|
|
|
|
|
|
|
|
|
|
|
|
|
|
|
|
|
|
|
|
|
East Asia |
|||||||||||||||||||||||||||||
|
|
|
|
Rest of North America |
|
|
|
|
|
|
|
|
|
|
|
|
|
|
|
|
|
|
|
Europe |
|
|
|
|
|
|
|
|
|
|
|
|
|
|
|
|
|
|
|
|
|
|
|
|
|
|
|
|
|
|
|
|
|
|
|
|
|
|
|
|
|
|
|
|
|
|
|
|
|
|
|
|
|
|
|||||||
|
|
|
|
|
|
|
|
|
|
|
|
|
|
|
|
|
|
|
|
|
|
|
|
|
|
|
|
|
|
|
|
|
|
|
|
|
|
|
|
|
|
|
|
|
|
|
|
|
China and |
|
|
|
|
|
|
|
|
Japan |
|||||||||||||||||||||||||||
|
|
|
|
|
|
|
|
|
|
|
|
|
|
|
|
|
|
|
|
|
|
|
|
|
|
|
|
|
|
|
|
|
|
|
|
|
|
|
|
|
|
|
|
|
|
|
|
|
|
|
|
|
Turkey |
|
|
|
|
|
|
|
|
|
|
|
|
|
|
||||||||||||||||||
|
|
|
|
|
|
|
|
|
|
|
|
|
|
|
|
|
|
|
|
|
|
|
|
|
|
|
|
|
|
|
|
|
|
|
|
|
|
|
|
|
|
|
|
|
|
|
|
|
|
|
|
|
|
|
|
|
East Asia |
|
|
|
|
|
|
|
|
|
|
||||||||||||||||||
|
|
|
|
|
|
|
|
|
|
|
|
|
|
|
|
|
|
|
|
|
|
|
|
|
|
|
|
|
|
|
|
|
|
|
|
|
|
|
|
|
|
|
|
|
|
|
|
|
|
|
|
|
|
Middle |
|
|
|
|
|
|
|
|
|
Rest of |
|
|
|
|
|
|
|
|
|
|
|||||||||||
|
|
|
|
|
|
|
|
|
|
|
|
|
|
|
|
|
|
|
|
|
|
|
|
|
|
|
|
|
|
|
|
|
|
|
|
|
|
|
|
|
|
|
|
|
|
|
|
|
|
|
|
|
|
|
|
|
|
|
|
|
|
|
|
|
|
|
|
|
|
|
|
|
|||||||||||||
|
|
|
|
Mexico |
|
|
|
|
|
|
|
|
|
|
|
|
|
|
|
Central |
|
|
|
|
|
|
|
North |
|
|
|
|
|
|
|
|
|
|
|
|
|
|
|
|
|
East |
|
|
|
|
|
|
|
|
|
|
|
|
|
|
|
|
|
|
|
|
|
||||||||||||||||||
|
|
|
|
|
|
|
|
|
|
|
|
|
|
|
|
|
|
|
|
|
|
|
|
|
|
|
|
|
|
|
|
|
|
|
|
|
|
|
|
|
|
|
South Asia |
|
|
|
|
|
|
|
|
|
|
||||||||||||||||||||||||||||||||
|
|
|
|
|
|
|
|
|
|
|
|
|
|
|
|
|
|
|
|
America |
|
|
|
|
|
|
|
Africa |
|
|
|
|
|
|
|
|
|
|
|
|
|
India |
|
|
|
|
|
|
|
|
|
|
|
|
|
|
|
|
|
|
|
|
Southeast |
||||||||||||||||||||||
|
|
|
|
|
|
|
|
|
|
|
|
|
|
|
|
|
|
|
|
|
|
|
|
|
|
|
|
|
|
|
|
|
|
|
|
|
|
|
|
|
|
|
|
|
|
|
|
|
|
|
|
|
|
|
|
|
|
|
|||||||||||||||||||||||||||
|
|
|
|
|
|
|
|
|
|
|
|
|
|
|
|
|
|
|
|
|
|
|
|
|
|
|
|
|
|
|
|
|
|
|
|
|
|
|
|
|
|
|
|
|
|
|
|
|
|
|
|||||||||||||||||||||||||||||||||||
|
|
|
|
|
|
|
|
|
|
|
|
|
|
|
|
|
|
|
|
|
|
|
|
|
|
|
|
|
|
|
|
|
|
West |
|
|
|
|
|
|
|
|
|
|
|
|
|
|
|
|
|
|
|
|
|
|
|
|
|
||||||||||||||||||||||||||
|
|
|
|
|
|
|
|
|
|
|
|
|
|
|
|
|
|
|
|
|
|
|
|
|
|
|
|
|
|
|
|
|
|
|
|
East |
|
|
|
|
|
|
|
|
|
|
|
|
|
|
|
|
|
|
|
|
Asia |
||||||||||||||||||||||||||||
|
|
|
|
|
|
|
|
|
|
|
|
|
|
|
|
|
|
|
|
|
|
|
|
|
|
|
|
|
|
|
|
|
|
|
|
|
|
|
|
|
|
|
|
|
|
|
|
|
|
|
|
|
|
|
|||||||||||||||||||||||||||||||
|
|
|
|
|
|
|
|
|
|
|
|
|
|
|
|
|
|
|
|
|
|
|
|
|
|
|
|
|
|
|
|
|
|
Africa |
|
|
Africa |
|
|
|
|
|
|
|
|
|
|
|
|
|
|
|
|
|
|
|
|
|
|
|
|
||||||||||||||||||||||||
|
|
|
|
|
|
|
|
|
|
|
|
|
|
|
|
|
|
|
|
|
|
|
|
|
|
|
|
|
|
|
|
|
|
|
|
|
|
|
|
|
|
|
|
|
|
|
|
|
|
|
|
|
|
|
|
|
|
|
|
|
|
|
|
|
|
|
|
|
|
|
|
|
|
|
|
|
Indonesia and |
||||||||
|
|
|
|
|
|
|
|
|
|
|
|
|
|
|
|
|
|
|
|
Brazil |
|
|
|
|
|
|
|
|
|
|
|
|
|
|
|
|
|
|
|
|
|
|
|
|
|
|
|
|
|
|
|
|
|
|
|
|
|
|
|
|
|
|
|
|
|
|
|
|
|
|
|
|
|||||||||||||
|
|
|
|
|
|
|
|
|
|
|
|
|
|
|
|
|
|
|
|
|
|
|
|
|
|
|
|
|
|
|
|
|
|
|
|
|
|
|
|
|
|
|
|
|
|
|
|
Rest of |
|
|
|
|
|
|
|
|
|
|
|
|
|
|
|
Southeast Pacific |
|||||||||||||||||||||
|
|
|
|
|
|
|
|
|
|
|
|
|
|
|
|
|
|
|
|
|
|
|
|
|
|
|
|
|
|
|
|
|
|
|
|
|
|
|
|
|
|
|
|
|
|
|
|
|
|
|
|
|
|
|
|
|
|
|
|
|
|
|
|||||||||||||||||||||||
|
|
|
|
|
|
|
|
|
|
|
|
|
|
|
|
|
|
|
|
|
|
|
|
|
|
|
|
|
|
|
|
|
|
|
|
|
|
|
|
|
|
|
|
|
|
|
|
|
|
|
|
|
|
|
|
|
|
|
|
|
|
|
|
|
|
|
|
|
|
|
|
|
|
|
|
|
|||||||||
|
|
|
|
|
|
|
|
|
|
|
|
|
|
|
|
|
|
|
|
|
|
|
|
|
|
|
|
|
|
|
|
|
|
|
|
|
|
|
|
|
|
|
|
|
|
|
|
|
|
|
|
|
|
|
|
|
|
|
|
|
|
|
|
|
|
|
|
|
|
|
|
|
|
|
|
|
|||||||||
|
|
|
|
Net Exporters |
Rest of |
|
|
|
|
|
|
|
|
|
|
|
|
|
|
|
|
|
|
|
|
|
|
|
|
|
|
|
|
|
|
|
|
|
Southern Africa |
|
|
|
|
|
|
|
|
|
|
|
|
|
|
|
|
|
|
|
|
|
|
|
|
||||||||||||||||||||||
|
|
|
|
|
|
|
|
|
|
|
|
|
|
|
|
|
|
|
|
|
|
|
|
|
|
|
|
|
|
|
|
|
|
|
|
|
|
|
|
|
|
|
|
|
|
|
|
|
|
|
|
|
|
|
|
|
|
|
|
|
|||||||||||||||||||||||||
|
|
|
|
|
|
|
|
|
|
|
|
|
|
|
|
|
|
|
|
|
|
|
|
|
|
|
|
|
|
|
|
|
|
|
|
|
|
|
|
|
|
|
|
|
|
|
|
|
|
|
|
|
|
|
|
|
|
|
|
|
|
|
|
|
|
|
|
|
|
||||||||||||||||
|
|
|
|
Net Importers |
|
|
|
|
|
|
|
|
|
|
|
|
|
|
|
|
|
|
|
|
|
|
|
|
|
|
|
|
|
|
|
|
|
|
|
|
|
|
|
|
|
|
|
|
|
|
|
|
|
|
|
|
|
|
|
|
|
|
|
|
|
|
|
|
|
|
|||||||||||||||
|
|
|
|
South America |
|
|
|
|
|
|
|
|
|
|
|
|
|
|
|
|
|
|
|
|
|
|
|
|
|
|
|
|
|
|
|
|
|
|
|
|
|
|
|
|
|
|
|
|
|
|
|
|
|
|
|
|
|
|
|
|
|
|
|
|
|
|
|
|
|
|
|||||||||||||||
|
|
|
|
|
|
|
|
|
|
|
|
|
|
|
|
|
|
|
|
|
|
|
|
|
|
|
|
|
|
|
|
|
|
|
|
|
|
|
|
|
|
|
|
|
|
|
|
|
|
|
|
|
|
|
|
|
|
|
|
|
|
|
|
|
|
|
|
|
|||||||||||||||||
|
|
|
|
|
|
|
|
|
|
|
|
|
|
|
|
|
|
|
|
|
|
|
|
|
|
|
|
|
|
|
|
|
|
|
|
|
|
|
|
|
|
|
|
|
|
|
|
|
|
|
|
|
|
|
|
|
|
|
|
|
|
|
|
|
|
|
|
|
|
|
|
|
|
||||||||||||
|
|
|
|
Increase in net exports |
|
|
|
|
|
|
|
|
|
|
|
|
|
|
|
|
|
|
|
|
|
|
|
|
|
|
|
South |
|
|
|
|
|
|
|
|
|
|
|
|
|
|
|
|
|
|
|
|
|
|
|
|
|
|
|
|
|
|
|
|
|
|
|
|
|
|
|
|
|
|
|
||||||||||
|
|
|
|
|
|
|
|
|
|
|
|
|
|
|
|
|
|
|
|
|
|
|
|
|
|
|
|
|
|
|
|
|
|
|
|
|
|
|
|
|
|
|
|
|
|
|
|
|
|
|
|
|
|
|
|
|
|
|
|
|
|
Oceania |
|||||||||||||||||||||||
|
|
|
|
Decrease in net exports |
|
|
|
|
|
|
|
|
|
|
|
|
|
|
|
|
|
|
|
|
|
|
|
|
|
|
|
Africa |
|
|
|
|
|
|
|
|
|
|
|
|
|
|
|
|
|
|
|
|
|
|
|
|
|
|
|
|
|
|
|
|
|
|
|
|
|
|
|||||||||||||||
|
|
|
|
|
|
|
|
|
|
|
|
|
|
|
|
|
|
|
|
|
|
|
|
|
|
|
|
|
|
|
|
|
|
|
|
|
|
|
|
|
|
|
|
|
|
|
|
|
|
|
|
|
|
|
|
|
|
|
|
|
|
|
|
|
|
|
|
|
|
|
|
|
|
|
|
|
|
|
|
||||||
USD billions |
|
|
|
|
|
|
|
|
|
|
|
|
|
|
|
|
|
|
|
|
|
|
|
|
|
|
|
|
|
|
|
|
|
|
|
|
|
|
|
|
|
|
|
|
|
|
|
|
|
|
|
|
|
|
|
|
|
|
|
|
|
|
|
|
|
|
|
|
|
|
|
|
|
|
|
|
|||||||||
(Constant prices 2011) |
|
|
|
|
|
|
|
|
|
|
|
|
|
|
|
|
|
|
|
|
|
|
|
|
|
|
|
|
|
|
|
|
|
|
|
|
|
|
|
|
|
|
|
|
|
|
|
|
|
|
|
|
|
|
|
|
|
|
|
|
|
|
|
|
|
|
|
|
|
|
|
|
|
|
|
|
|||||||||
| 65 |

vk.com/id446425943
PART 5 ADAPTING TO CLIMATE CHANGE AND MITIGATING ITS IMPACT: TRADE POLICIES
BOX 5.2
(CONTINUED)
Open markets bring about lower food prices in almost all regions. Increasing GDP and wages and decreasing food prices lead to an overall improvement in food purchasing power, thus increasing access to food.
It is important to underline that trade policies form part of a wide range of measures that can be employed to strengthen adaptation to climate change. Although opening markets will have positive impacts on food security, producers in regions that are expected to be negatively affected by climate change
will face intense competition. Trade policies should strike a balance between rural development objectives, sustainable agricultural production targets and food security needs. A broad spectrum of policies will be needed to enhance sustainable agricultural productivity and offset climate change impacts on the comparative advantage of agriculture, including policies that promote innovative climate-smart technology adoption by small-scale family farmers; market integration; and, importantly, access to agricultural insurance and credit markets.
NOTE: The final boundary between the Republic of the Sudan and the Republic of South Sudan has not yet been determined. Final status of the Abyei area has not yet been determined.
SOURCE: Wageningen Economic Research. 2018. Climate Change and Global Market Integration: Implications for global economic activities, agricultural commodities and food security. SOCO 2018 Background Paper, FAO, Rome.
»linkages between domestic and international prices, is restricted by the AoA.
Export subsidies, surplus disposal and international food aid
Export subsidies are the most trade-distorting policy instruments, and since 1995 the AoA had limited the amount of export subsidies and the volume of subsidized exports. At the Tenth Ministerial Conference of WTO in Nairobi in December 2015, agreement was reached to eliminate export subsidies in parallel with new disciplines on the use of export credits, credit guarantees, insurance programmes, international food aid and exporting state trading enterprises that can provide implicit export subsidies.103
These changes will eliminate potential distortions in international markets created by the disposal of surplus commodities. In the short term, they also eliminate instability in international prices created by variations in subsidized exports generated by fluctuations in domestic production. In the long term, they reduce the price-depressing effect of the disposal of stocks accumulated through high domestic price supports.
Surplus disposal is also relevant to discussions on international food aid. Developing countries, particularly the least-developed ones that are vulnerable to climate change, will be concerned about the availability of sufficient aid to meet weather-induced emergencies in supply. Adaptation will also require focusing on the relevant provisions. In 2015 the Nairobi WTO Ministerial Decision on export competition reaffirmed the need to maintain an adequate level of international food aid, to take into account the interests of the recipients and to address unintentional impediments to the delivery of food aid in emergency situations, commitments which can usefully support emergency food reserves while preventing or at least minimizing the risk of commercial displacement. The outcome also included a helpful set of rules creating a new operational framework for food aid, with defined criteria such as limiting monetization, taking account of local market conditions or encouraging Members to increasingly procure food from local or regional markets.104
Import tariffs
Countries that face a production shock and a domestic price surge can rely on the international
| 66 |

vk.com/id446425943
THE STATE OF AGRICULTURAL COMMODITY MARKETS 2018
market to secure supplies and address the food needs of their citizens. Providing that applied tariffs are not prohibitively high, imports can vary in response to changes in international prices. Depending on their food security requirements, countries can influence both the availability and the domestic price of food by adjusting the applied tariff rates.
Nevertheless, regardless of production or other domestic shocks, many countries tend to vary their import tariffs in a counter-cyclical manner to changes in world prices. They decrease import tariffs when world prices are high and increase them when world prices are low – effectively using tariffs as an instrument to protect the domestic markets. Such a
counter-cyclical adjustment of import tariffs partially insulates the domestic market from changes in international prices. By reducing the absorption effect, it can contribute to greater international price variability – strengthening demand on international markets when world prices are high and decreasing it when world prices are low. In this manner, larger country trade policies can increase world price variability and create negative externalities for smaller countries.105
International trade is a powerful mechanism to even out supply fluctuations across the globe and its beneficial pooling function cannot serve climate change adaptation efforts if policies in place do not allow goods to flow smoothly between countries. Trade policy is thus important for facilitating the efficient functioning of world markets and ensuring food security by increasing the adaptive role of trade (see Box 5.2).
The AoA imposes limits on maximum tariffs that can be applied to imports. Negotiations to reduce agricultural tariffs further have been ongoing since the launch of the Doha Round in 2001, but limited progress has been achieved. One of the contentious issues has been the establishment of a Special Safeguard Mechanism (SSM) that would allow developing countries to increase agricultural import tariffs temporarily if there were surges in imports or declines in import prices.106 Indeed, domestic price declines associated with significant increases in import
volumes, or “import surges”, can be particularly harmful to small-scale family farmers in developing countries, weakening incentives for investment.
Import surges can be the outcome of factors specific to the domestic economy such as domestic production shortfalls due to climatic events. They can also be the result of external, global market factors, such as low world prices due to an exporter subsidizing exports, which can be potentially disruptive to domestic agriculture.107
Since 2005 when discussions on SSM actively began, the global market environment has changed significantly. World prices and developing country aggregate import volumes have increased (see discussion in Part 1): a 2014 study utilizing different methods to identify potential import surges in 103 countries suggested that during 2004–11, the incidence of volume surges fell significantly compared with the period 1983–2004. Furthermore, between 2004 and 2011 the incidence of price depressions fell to zero in most agricultural commodity groups.108
The effects of climate change on agriculture are expected to put upward pressure on world prices but also to reinforce the increasing trend in imports and their variability, particularly in low-latitude countries in which production will be negatively affected by changes in temperature and precipitation, as well as by extreme weather events. These expected trends in prices and imports, in conjunction with the elimination of export subsidies, may weaken the relevance of such a safeguard mechanism in the future. Instead, reductions in trade-distorting measures, combined with reductions in bound tariffs for agricultural products and a broad range of policies to enhance the comparative advantage of agriculture sustainably, could help to facilitate long-term shifts in the pattern of trade that will be needed to adapt to climate change.
Export restrictions
There is a marked asymmetry between international disciplines on export taxes, which
are unbound, and import tariffs, which are bound »
| 67 |

vk.com/id446425943
MAHABERIYATHENNA, SRI LANKA
A row of cattle waiting to be fed at the National Livestock Development Board Farm, where an FAO-led project is assisting Sri Lanka in obtaining rinderpest infection-free status. ©FAO/Ishara Kodikara
| 68 |

vk.com/id446425943
THE STATE OF AGRICULTURAL COMMODITY MARKETS 2018
»in WTO schedules. Export restrictions – taxes, and in some cases quantitative export limits or export bans – have been widely used in the past and continue to be used to manage agricultural markets. Countries may apply these measures to contain the increase in domestic prices and boost domestic food supplies. One study indicates that out of 105 countries analysed, 31 percent resorted to one or more export restriction instruments during the period 2007–11.109
Export restrictions are covered by Article XI of GATT, which allows recourse to export taxes but generally prohibits quantitative restrictions. However, the same article provides for an exemption for “export prohibitions or restrictions temporarily applied to prevent or relieve critical shortages of foodstuffs or other products essential to the exporting contracting party.” Since the phrase ‘critical shortages’ is not clearly defined, there may be divergent views on how ‘critical shortages’ should be interpreted by countries when making policy decisions about quantitative export restrictions.
Export restrictions contribute to international price instability, particularly if they are imposed when world prices are rising. For example, in India and Viet Nam the imposition of an export ban on rice during the 2008 price surge dampened domestic market volatility but contributed to increased price volatility in the international rice market. Completely banning food exports was also a common reaction to the 2008 food price surge across Africa. During the height of the food price surge, the National Cereals and Produce Board, the state marketing board of Kenya, faced difficulties in importing sufficient quantities of maize mainly due to export bans implemented by a number of countries in the region.110 Concerted implementation of export bans by major exporters will render the world market unreliable as a source of food, harming net food importers and traditional trading partners.111
In the context of climate change, there is a need to discuss strengthening WTO export restriction disciplines in order to avoid disruption and a collapse of confidence in international food markets. Strengthening current disciplines could involve elements such as:
i.developing an operational definition of a critical food shortage situation that might justify consideration of an export-restricting measure; and
ii.the need to define the limits of an export ban as a last resort, one to be used only when other measures have been exhausted and taking into account the food security needs of LDCs and NFIDCs.112 n
THE ROLE OF TRADE IN MITIGATING THE IMPACT OF CLIMATE CHANGE
Reducing GHG emissions in agriculture requires the application of climate-smart agriculture practices and investments in technology, extension and infrastructure (see Part 4). Trade can play a role in adapting to climate change, however increases in production and expansion of trade, although expected to promote food security, could increase global emissions.
From a global perspective, addressing the dual challenge of meeting food demand growth in the future and reducing emissions may also require that agricultural production be reallocated to regions where emissions efficiency is highest (that is where emissions per unit of output is lowest). In theory, international trade could provide the necessary signals to facilitate the reallocation of production to producers that are more efficient in economic terms (they produce more food using relatively fewer resources) and operate at higher emissions efficiency (they emit relatively lower emissions per unit of food produced).
In practice, however, such a reallocation is far less straightforward. If a country imposes a carbon tax on agricultural products, domestic prices would increase (see discussion in Part 4 and Table 4.2 on the effect of a carbon tax on food prices). Without trade, the increase in price would weaken demand, resulting in a decline in production and possibly in emissions. With trade, however, the unilateral action to impose a carbon tax could put the mitigating country at a competitive disadvantage. The carbon tax (or a cap-and-trade scheme) may simply result in the
| 69 |

vk.com/id446425943
PART 5 ADAPTING TO CLIMATE CHANGE AND MITIGATING ITS IMPACT: TRADE POLICIES
TABLE 5.1
IMPACT OF EMISSIONS LEAKAGE THROUGH TRADE
Relative emissions efficiency |
|
|
(between imports that displace domestic |
Impact on global emissions |
Result of emissions leakage |
products) |
|
|
Imports are produced in systems with |
|
|
lower emissions efficiency (higher |
Increase in global emissions |
Emissions misallocation |
emissions per unit of output) |
|
|
|
|
|
Imports are produced in systems with |
|
|
higher emissions efficiency (lower |
Decrease in global emissions |
Emissions reallocation |
emissions per unit of output) |
|
|
|
|
|
displacement of lower carbon footprint domestic products by cheaper and higher carbon footprint imports from countries that do not take similar measures to reduce emissions.113
Consequently, emissions generated as a result of increasing production elsewhere and supplying additional imports to the mitigating country would result in emissions leakage (also referred to as carbon leakage). In this case, the impact of this leakage on global emissions may be positive (emissions reallocation) or negative (emissions misallocation) depending on the relative emissions efficiency of domestic production
vis-à-vis imports (see Table 5.1).
Given the demands that will be placed on global agricultural resources by an expanding world population and growing incomes, it is important that increased production be accompanied by enhanced emissions efficiency. The possibility of emissions leakage also indicates that internalizing emissions costs in agriculture unilaterally, although justified, may not be effective without concerted global action if imports from countries that do not mitigate can simply displace low carbon footprint domestic products.
In this regard, focusing on both the economic and emissions efficiency of agricultural production in each country individually may not be the most effective way to achieve a reduction in global emissions. The Paris Agreement recognizes the need for joint action and cooperative approaches that involve the use of internationally transferred mitigation outcomes on a voluntary basis.114 However, in the absence
of a mechanism that reflects differences in emissions efficiency, cooperative action may not be effective.
In theory, mitigating countries may try to minimize emissions leakage through the use of trade measures. However, efforts to address differences in emissions efficiency through trade policies should comply with WTO provisions, such as those that provide for most-favoured-nation (MFN) treatment, regulate the levels of tariffs on imports, and provide for equality of national treatment. In this regard, trade disciplines need to be taken into account together with the internalization of the social cost of emissions (see discussion in Part 4).
Tariff adjustments
Countries that try to internalize the cost of GHGs, for example by imposing a carbon tax, may inadvertently confer a competitive advantage on others that do not impose a similar measure, potentially leading to emissions leakage and misallocation. To prevent this from undermining mitigation efforts at the global level, countries may pursue tariff adjustment measures that level the playing field.
Under WTO agreements, the ability of countries to increase their tariffs to address emissions leakage is subject to bound tariffs and the principle of non-discrimination. Tariffs could be increased to discourage additional imports of products with higher carbon footprint as long as the applied tariff rates remain below the bound rates (see Part 3 on market access). However, this
| 70 |

vk.com/id446425943
THE STATE OF AGRICULTURAL COMMODITY MARKETS 2018
should be implemented in ways that would be judged non-discriminatory.
Alternatively, reductions in tariffs under regional trade agreements or for developing countries through special and differential treatment (see Box 3.3) could be used to promote trade in low carbon footprint products. However, yet again, to avoid potential challenges under the WTO dispute settlement mechanism, reductions could not be implemented in a way that could be viewed as discriminatory.
Tax adjustments
The imposition of a carbon tax on agricultural products means that the mitigating country’s farmers will be disadvantaged unless imports face the same tax. At the same time, exports by the mitigating country will be also disadvantaged except if corresponding domestic products are taxed in the country of destination.
There has been considerable interest in the potential use of Border Tax Adjustments (BTAs) that could be based on carbon footprint. Adjusting for the carbon tax means that the same rate applying to the carbon footprint of domestic products would be applied to imports. Low-emitting suppliers would face a low tax and would be able to compete with the domestic product. High-emitting suppliers would face a high tax, which could potentially make them uncompetitive. Imposing a BTA in this case would address emissions leakage, but would not necessarily result in carbon reallocation.
A major technical challenge in determining and applying a BTA is to calculate the carbon footprint of domestic products and imports, and apply an appropriate tax on domestic products and a corresponding BTA on imports in order to level the playing field (see Box 6.1 on the estimation of carbon footprint). Where an explicit carbon tax is applied domestically, it would seem to be relatively straightforward to apply a corresponding BTA on imports, providing that their carbon footprint (emissions generated in producing and supplying the imports) can be determined.
Problems arise in calculating the BTA where import suppliers have internalized emissions costs. If a country has imposed a carbon tax on its producers, equivalent to or higher than that in the importing country, no BTA should be applied. If a BTA were applied, this could be viewed as protectionism. If the import supplier applied a carbon tax at a rate lower than in the importing country, the BTA should reflect the differential rate of taxation. Similarly, if the tax applied in an exporting country exceeded that applied by an importer, a case could be made for a tax rebate on imports.
The use of BTAs is more complicated when measures other than a carbon tax are used domestically and in exporting countries, such as the promotion of climate-smart agriculture practices or regulations on performance standards (these may increase production costs and thus imply a tax). In this case, it would be necessary to determine the per unit carbon tax equivalent of these measures. This is not necessarily straightforward, as determining the implicit level of taxation domestically and in import suppliers could be a major undertaking.
Similarly, exporting food that is subject to a carbon tax is complex. Rebates have often been applied for exports in the context of value added taxes, so that domestic exporters are not at a competitive disadvantage. But it is difficult to apply the same logic to carbon taxes, since the purpose of the tax is to internalize the social costs of emissions that would otherwise not be accounted for by producers and consumers. In this sense, rebates of carbon taxes for products that are exported would be harmful from the perspective of global mitigation.
There are major technical challenges in determining BTAs. Any approach to tax adjustments faces the challenge of determining the carbon footprint for domestic and imported products in order to apply the adjustment in the context of Article XX of GATT.
Import bans
Rather than attempting to address increases in imports due to differential carbon tax rates through the use of tariffs and BTAs, another
| 71 |

vk.com/id446425943
PART 5 ADAPTING TO CLIMATE CHANGE AND MITIGATING ITS IMPACT: TRADE POLICIES
approach might be to ban imports of products that have a high carbon footprint and are likely to hinder efforts to reduce emissions nationally.
Article XX of GATT provides exceptions for the use of border measures that complement the basic disciplines of GATT in cases of measures necessary to protect human, animal or plant life or health, and those relating to the conservation of exhaustible natural resources (see Part 3 for a detailed discussion on exceptions).
The use of measures relating to these exceptions has generated a limited number of dispute settlement cases, such as the Shrimp — Turtle case brought against the United States of America.115 Under the US Endangered Species Act of 1973, the United States of America required that American shrimp trawlers use “turtle excluder devices” in their nets when fishing in areas where there was a significant likelihood of encountering sea turtles. Shrimp imports harvested with technology that could adversely affect certain sea turtles would not be imported into the United States of America, unless the supplier was certified to have a comparable regulatory programme in their own country. The ruling in the case was that a prohibition on imports of products that could cause injury or death to sea turtles as a result of shrimp fishing was permissible in principle, but only if applied in a non-discriminatory way. Indeed, following the decision, the American Government amended its policy certifying suppliers that have programmes in place that are effective in protecting turtles in order not to discriminate against imports in an unjustifiable and arbitrary manner. This seems to open the possibility that non-discriminatory import restrictions could be imposed.
Although this particular case may provide guidance on how Article XX of GATT could be used to impose non-discriminatory import restrictions, a total ban on imports in the case of a climate-smart carbon tax or other comparable mitigation measures would be subject to difficulties in determining and agreeing on the carbon footprint of domestic and imported products. n
ASSESSING THE POLICY SPACE FOR TRADE POLICIES: ADAPTATION AND MITIGATION IN THE CONTEXT OF WTO OBLIGATIONS
Trade will be important in contributing to food security, as the effects of climate change on agricultural production will be uneven across countries. In the short term, trade provides the mechanism for addressing production shortfalls due to extreme weather events. In the long term, well-functioning international markets will provide the price signals necessary to adjust agricultural production in line with changes in comparative advantage.
Reallocating production in line with comparative advantage will benefit all. This does not mean that countries where agriculture will face deteriorating conditions due to climate change have to import to meet most of their food needs. Rather it means that countries will have to assess all available options and employ a range of measures and investments to promote sustainable agricultural productivity and adaptation, including through trade. This should ensure both food security and sustainability in agriculture, as well as increases in the sector’s comparative advantage. Improvements in sustainable productivity growth and resilience, together with better-functioning and deeper international markets, will allow countries in the most vulnerable areas to effectively adapt to climate change.
Trade policies are key in enhancing the buffer capacity of international markets. The 2015 WTO Ministerial Decision to eliminate export subsidies will contribute to a more level playing field in international trade. Lower import tariffs can contribute to short-term adaptation to climate change, but this does not guarantee that prices in an individual country will be more stable. In many countries, tariff levels contribute to determining food prices. And prices reflect the economic incentives that determine productivity,
| 72 |
vk.com/id446425943
THE STATE OF AGRICULTURAL COMMODITY MARKETS 2018
consumption, investment and rural employment. They can also influence the use of natural resources such as land and water and their allocation across sectors. Prices also have significant implications for income and its distribution across producers and consumers. In the context of climate change, when designing trade policies, policy-makers will have to meet food security objectives while at the same time providing incentives for sustainable agricultural growth and rural development. Discussions on trade policy will also have to focus on export bans, which can harm NFIDCs, rendering the international market unreliable as a source of food.
While the bottom-up approach to mitigation adopted in the Paris Agreement facilitated consensus, the lack of a mechanism for
determining a global carbon price creates difficulties for the international trading system to play a role in mitigating efforts. Trade can lead to lower emissions globally, but can also increase them when the social costs of such emissions are not reflected in prices.
While the use of border measures might seem to offer a mechanism to correct for potential trade distortions due to differential carbon pricing, this is extremely challenging technically and opens up the possibility of protectionism. Although technical difficulties related to measuring carbon footprint of agricultural products are not insurmountable, policy-makers will have to discuss how trade agreements could be supportive of such market-based solutions to mitigation. n
| 73 |

vk.com/id446425943
CORDONCILLO,
PUNTARENAS,
COSTA RICA
Farmers working in a pineapple plantation, applying good agricultural and phytosanitary practices throughout the production process and packaging of the fruit. ©FAO/Ezequiel Becerra

vk.com/id446425943
PART 6 NON-TARIFF MEASURES (NTMs): REGULATIONS AND STANDARDS
Key points
1 Carbon labelling could help shape consumer preferences, contributing to the
transition to a low-emissions economy. This would require an internationally-recognized approach in setting the related standards.
2 Climate change could result in a considerable increase in the uncertainty
surrounding sanitary and phytosanitary (SPS) threats. This would hinder trade especially for developing countries, unless appropriate risk assessment, surveillance, monitoring, diagnostics and border infrastructure are in place.
3 Additional costs associated with labelling and standards could place a burden particularly on family farmers and small-scale
food processors in developing countries. Assistance for capacity building would be necessary.

vk.com/id446425943
PART 6
NON-TARIFF MEASURES (NTMs):
REGULATIONS AND STANDARDS
Every country has the right to ensure the protection of human, animal or plant health and the environment through the implementation of regulations and standards. Sanitary and phytosanitary (SPS) measures are used to ensure food safety and protect animal or plant health, while other technical regulations, standards and conformity assessment procedures are sometimes referred to as technical barriers to trade (TBT). These measures have different policy objectives, including environmental protection, human health and safety, and prevention of deceptive practices. Such policy measures, also known as non-tariff measures (NTMs), can have a significant impact on international trade.
While most measures may be put in place due to genuine concerns, it is possible that some are unjustified and implemented in order to protect domestic producers and industry from competition. Since its establishment in 1995, the WTO has responded to this risk through the Agreement on the Application of Sanitary and Phytosanitary Measures and the Agreement on Technical Barriers to Trade (TBT Agreement). These two agreements aim to ensure that such measures are not arbitrary, unjustifiable, or more trade-restrictive than is necessary to achieve their policy objectives.
Climate change will have a substantial impact on agricultural productivity, and subsequently, on trade volume and flows. The many related uncertainties will create significant challenges for national regulatory authorities in their efforts to adopt SPS measures appropriate for emerging climate change issues. These uncertainties could result in the implementation of overly cautious measures and potentially unjustified barriers to trade. They may also lead to inadequate measures and the subsequent increase of pests and diseases. In addition, TBT measures may be increasingly
used as part of mitigation efforts, resulting in further increases in the use of NTMs. n
TECHNICAL BARRIERS TO TRADE (TBT) AND ENVIRONMENTAL PROTECTION
Product standards, carbon labelling and international trade
The application of environmental standards to food products and the use of environmental labelling are becoming popular in many countries. In fact, an increasing number of bilateral and regional trade agreements embody provisions that support cooperation on the use of environmental standards. Product standards and labelling have supported the creation of a market for ‘organic’, ‘fair trade’ and sustainably-sourced wood and paper products. If products could be distinguished from one another in terms of emissions generated by their production, the same could be done to create a market for food with a low carbon footprint. Indeed, shaping consumer preferences towards agricultural and food products that are produced by low-emitting methods could provide the necessary incentives for agriculture to further contribute towards mitigation efforts.
The treatment of product standards, technical regulations and conformity assessment procedures is covered by the TBT Agreement. The TBT Agreement provides disciplines to ensure equitable treatment in these measures for imported products and ‘like products’ of national origin (Article 2:1). An increasing
| 76 |

vk.com/id446425943
THE STATE OF AGRICULTURAL COMMODITY MARKETS 2018
awareness of climate change issues among consumers could lead to demand for carbon labelling. When considering this, it would be important to examine whether the environmental provision would permit countries to impose technical regulations associated with the environmental characteristics of products, such as their carbon footprint. While the TBT Agreement does allow countries to establish their own requirements for imported products, it requires that these be non-discriminatory – i.e. the treatment of imported products should not be less favourable than that accorded to ‘like’ domestic products.
If a country were to require that all domestic and imported products be labelled on the basis of their carbon footprint – since labelling is required for both domestic and imported products – this would seem to be in line with the national treatment provisions of the TBT Agreement. However, since carbon footprint is not in essence a physical part of products (but rather a consequence of the method of production, processing and transport) the implications of the TBT Agreement requirement for the equal treatment for imports of ‘like’ products remain untested.
In addition, accurately determining carbon footprint would be challenging and might even lead to trade disputes unless a mechanism for assessing this could be agreed upon between trading countries (see also Part 5). A minimum requirement would be the development of an objective approach to the quantification of carbon footprint and international acceptance of its use as a basis for carbon labelling. In many countries, private companies such as supermarkets currently take the lead in developing product standards and labels. However, the potential lack of transparency and harmonization in the
development and application of private standards for carbon labelling may lead to disagreements among trading partners.
Development and use of international standards
WTO agreements place a particular emphasis on the harmonization of national regulations on the basis of international standards. The SPS Agreement, for example, explicitly references the international standards developed under the auspices of the FAO/WHO Codex Alimentarius Commission (Codex), the International Plant Protection Convention (IPPC) Secretariat (governed by the Commission on Phytosanitary Measures [CPM]), and the World Organization for Animal Health (OIE). Importantly, measures that are based on the standards, guidelines and recommendations developed by Codex, the IPPC Secretariat and OIE are presumed to be in conformity with the SPS Agreement. The role of international standards is also central to the TBT agreement, although it does not refer to any specific standard-setting organization. The use of relevant international standards as a basis for technical regulations is presumed by the TBT Agreement as not creating an unnecessary obstacle to international trade (Article 2.5). An international approach to identifying the environmental characteristics of goods, such as their carbon footprint, would reduce the likelihood of challenges through the WTO to the use of measures on labelling requirements, and could help to limit the tendency for the proliferation of private standards.
The International Organization for Standardization (ISO), a non-governmental international organization with a membership of 162 national standards bodies, has developed a series of standards for environmental labelling
| 77 |

vk.com/id446425943
PART 6 NON-TARIFF MEASURES (NTMs): REGULATIONS AND STANDARDS
(the ISO 14020 series). FAO collaborates actively with ISO in some 40 technical committees – for example with regard to climate change and other environmental impacts – building on the environmental management standards (ISO 14000 family of standards) to develop guidelines providing a comprehensive and sound assessment of environmental performance. The ISO 14021, in particular, covers the evaluation and verification of claims relating to GHG emissions. It requires the use of verifiable Life Cycle Analysis measurement (see Box 6.1) for labels relating to carbon footprint. ISO 14067, currently under development, covers requirements and guidelines for the quantification and communication of the carbon footprint of products.
Unlike Codex, CPM, or OIE, ISO is not an intergovernmental organization, although the technical committees that develop ISO standards often include a wide range of experts from industry as well as consumer associations, academia, NGOs, government and, in some cases, even representatives from one of the international standard setting bodies. Agreement on the adoption of objective methods for determining implied emissions, such as those developed by ISO, and their fair application to domestic and imported products, may encourage countries to pursue a collective approach to the use of carbon labelling, potentially contributing towards a lower emissions agricultural and food system.
However, the use of carbon standards and labelling and the associated processing, monitoring and verification requirements are likely to impose additional costs on suppliers. This could put some family farmers and
small-scale producers, particularly in developing countries, at a disadvantage, especially when they are not able to pass on these costs to the consumer. Aid and technical assistance may be needed to overcome these issues (see Box 3.3 on Special and Differential Treatment).
It should be noted that carbon labelling does not require that any information be provided on whether countries have taken steps through the use of carbon taxes or any other means to reduce the carbon footprint of products. Some countries might be low-carbon producers due to natural advantages (e.g. resource endowment), while
others have to use policy measures to reduce their carbon footprint, including non-tax measures. Nonetheless, to the extent that increased emissions efficiency is reflected in a reduced carbon footprint, labelling provides a way to capture the emissions-competitive standing of food and agricultural products and to guide consumers in the direction of lowemissions choices. It could also support emissions reallocation through international trade by providing a non-price competitive advantage to international suppliers of low-emissions products (see Part 5 for a discussion on emissions reallocation). Naturally, for labelling to be effective consumers must be adequately informed about the implications of the choices they make.
As with ‘organic’ or ‘animal-welfare-friendly’ versus conventional products, consumers could always choose to ignore ‘climate-friendly’ product characteristics and make their purchasing decisions based on other reasons. They must be willing to pay a possible price premium for low-carbon footprint products. The only way to ensure that price and carbon labelling work in a mutually supportive way (i.e. to promote lower emissions in global food and agriculture) is for the prices of labelled products to reflect fully and credibly the internalized cost of emissions involved in their production and delivery to consumers. In addition, consumers would need to consider the carbon footprint when making their purchases, which would be easier for those with higher income. As such, labelling is not a panacea and policies are still needed to reduce emissions of agricultural production by promoting emissions efficiency. The use of a cooperative approach in carbon labelling could however play an important part in the transition to a low-emissions economy. n
SANITARY AND
PHYTOSANITARY
MEASURES (SPS)
AGREEMENT
The SPS Agreement aims to ensure that SPS measures are used solely to protect against SPS risks, and not for protectionist purposes. »
| 78 |

vk.com/id446425943
THE STATE OF AGRICULTURAL COMMODITY MARKETS 2018
BOX 6.1
ESTIMATING THE CARBON FOOTPRINT OF AGRICULTURAL PRODUCTS
The carbon footprint of agricultural products generally refers to the cumulative carbon equivalent of the emissions generated by all stages of their production throughout the supply chain (the amount of carbon dioxide equivalent or CO2e per kilogram of product). The analysis of impacts associated with all the stages of a product’s life is known as the Life Cycle Assessment (LCA). A complete LCA of a product would consider the emissions generated in the production and supply of inputs used by farmers (primarily CO2), direct and indirect emissions generated in agricultural production processes (CH4, N2O and CO2, including net emissions associated with land use and land-use change), and subsequent emissions associated with transportation, processing, storage, and delivery of products to consumers. It would also count emissions associated with waste along the supply chain and at the point of final consumption (primarily CO2).
Guidelines for estimating emissions associated with agriculture through LCAs are provided in the 2006 IPCC Guidelines for National Greenhouse Gas Inventories for Agriculture, Forestry and Other Land Use (AFOLU). These guidelines cover GHG emissions and removals through cropland (arable and tillable land, rice fields, and agroforestry systems), as well as through livestock production and manure management. Emissions associated with upstream and downstream activities relating to agriculture, as well as on-farm energy use, are not included in AFOLU estimates, but indirect emissions relating to energy use in AFOLU are counted in the energy sector.
The IPCC methodology is used by Parties to the Paris Agreement in preparing the national inventory reports of anthropogenic emissions by sources and removals by sinks of GHGs. The methodology is classified into three Tiers that involve increasing levels of complexity, both in terms of data requirements and methods. Tier Three yields the most accurate GHG estimates and should be used for key sectors. Work is
currently underway on refining the 2006 guidelines to take into account new scientific and technical knowledge, relating particularly to emissions factors for some categories of activities and gases.
LCAs are also key to carbon labelling. The International Organization for Standardization (ISO), for example, requires that the carbon footprint communicated on environmental labels be quantified by a life cycle assessment based on ISO standards. Carbon labelling should therefore represent the complete carbon story of the product, including both storage and transportation. This is unlike, for example, Food Miles labelling – which provides information on the distance food has travelled from producer to consumer to reflect the energy used for its transportation – which could be said to provide an oversimplified picture.
LCAs of emissions intensity in food and agriculture remain extremely challenging due to methodological issues and data requirements. For certain objectives a partial analysis – e.g. evaluating the carbon footprint of a product at a particular point in the supply chain
– can also be useful.
FAO generates estimates of carbon footprint equivalent (FAOSTAT Emissions Intensities) for a range of commodities, based on their efficiency of production, by country and over time. These estimates facilitate national and regional agri-environmental trends analysis. Data are available for a set of agricultural commodities (such as cereals, rice, meat, milk, eggs) and expressed in kg of CO2e per kg of agricultural commodity. The computation is limited to emissions generated within the farm gate. Additional emissions from upstream and downstream production and consumption processes and trade are excluded, hence the analytical data are not comparable to a full LCA although they provide an excellent basis for LCA work.
SOURCES: Blandford, D. 2018. Border and related measures in the context of adaptation and mitigation to climate change. SOCO 2018 Background Paper, Rome, FAO; IPCC. 2006. Guidelines for National Greenhouse Gas Inventories. Volume 4. Agriculture, Forestry and Other Land Use (http://www.ipcc-nggip.iges.or.jp/public/2006gl/vol4.html); FAO. 2017. Emissions intensities. In FAOSTAT. [online] http://www.fao.org/faostat/en/#data/EI/visualize
| 79 |

vk.com/id446425943
PART 6 NON-TARIFF MEASURES (NTMs): REGULATIONS AND STANDARDS
»However, in light of the issues emerging from the effects of climate change in relation to SPS matters, it is necessary to examine whether the SPS Agreement provides sufficient policy space for members to adopt appropriate SPS measures in a timely manner.
Climate change will affect plant and animal health and food safety, and WTO members should have the flexibility and capacity to adopt and implement the necessary SPS measures in response to these expected impacts under the SPS Agreement.
Impacts of climate change on plant and animal health and food safety
In relation to plant health, it is generally expected that shifting crop ranges, changing wind patterns and extreme weather will lead to a change in the distribution of pests. Warmer temperatures in particular may allow for better survival of certain pests, and in some cases there may be increased virulence and changing pest population dynamics, which could lead to larger-scale damage. Indirect impacts of climate change – for example, devastation of mangroves and natural forests – may lead to pest and disease outbreaks, and consequent transboundary movements. Plant health is extremely vulnerable to the effects of climate change, given the immense diversity in plant and pest species and the numerous intricate and complicated interactions between host, pest, ecosystem and human response (e.g. pest management activities). Indeed, the diversity of plant pests is so huge that predicting which species pathogenicity, distribution or epidemiology will be affected is very difficult, if not impossible.
In animals, the distribution of vector-borne diseases, the vector’s ecology and its pathogen development rate will depend strongly on environmental conditions. The effects have already been seen with the distribution of bluetongue disease (BT) in ruminants, which has been widely attributed to climate change. Pathogens may turn more aggressive in settings where hosts have become more abundant or immune-compromised. This may also occur when pathogens perform a host species jump, possibly in response to increased host species mixing.116
In the case of zoonotic infectious diseases, such a jump could have a direct and detrimental impact on human health. Human health could also be affected by a decline in the nutritional content of livestock products due to increased instances of pathogens and diseases in feed and animals.
Non-vector-borne animal diseases such as avian influenza could also be influenced indirectly by climate change, for example, through changes in migratory routes of birds or the increasing prevalence of host animals. In fact, changes in livestock production systems – such as fewer cattle and increased numbers of small ruminants and camels in arid and semi-arid locations – may be the reason for a rise in the distribution of peste des petits ruminants, also known as sheep and goat plague and a major disease affecting these animals. There may also be increasing adjustments in livestock production systems, as certain types or breeds of animal are favoured for their suitability to changing climatic conditions or availability of feed.
As in the case of plant and animal health, the climatic impacts on micro-organisms affecting food safety are thought to be substantial. In fact, the Intergovernmental Panel on Climate Change (IPCC) has reported that warmer climate in combination with inappropriate food behaviour may contribute to increased incidences of food-borne diseases. In particular, the carriers of food-borne pathogens and major hygienic pests in the domestic environment, such as flies, cockroaches, and rodents, could increase in response to climatic changes. There may also be increases or shifts in mycotoxinand biotoxin-producing organisms that are highly dependent on appropriate temperatures. Mycotoxins are produced by certain fungi that predominantly contaminate staple cereals; biotoxins, on the other hand, are produced by certain phytoplankton species that can accumulate in various marine species. Changes in the levels and dispersion of these toxins could have a direct impact on human health and food security.
Finally, human responses to climate change could also increase the contamination of food sources with chemicals. For example, the use of plant protection products or veterinary drugs may increase as a result of climate change-induced
| 80 |

vk.com/id446425943
THE STATE OF AGRICULTURAL COMMODITY MARKETS 2018
adjustments to agricultural practices, and an expected increase in pressure from pests and diseases. Moreover, inappropriate application or storage of such products could lead to excessive residues and raise food safety risks.117
Challenges for the international regulatory framework in dealing with climate-change-related SPS matters
Climate change will alter pest and disease distributions and agricultural trade flows in ways that cannot be easily predicted. The number of notified SPS measures has been steadily increasing, probably reflecting both an increase in transparency (more measures are being notified) and an increase in the numbers of new or changed SPS measures. Climate change may require WTO members to adapt their existing SPS measures or develop new ones in response to changes in pest or disease risks and to the growing uncertainty about these risks, thus contributing to increased regulatory activity. The SPS Agreement is now more important than ever to ensure the implementation of fair measures that protect human, animal and plant health but also facilitate international trade. The obligation to base SPS measures on scientific principles is at the core of the SPS Agreement, yet the implications for many biological processes under different climate change scenarios are simply unknown. Scientific research concerning pests and diseases and their behaviour under climate change is in its infancy and knowledge gaps compound challenges for the efficient implementation of SPS measures.
The Agreement advocates, among other principles, the international harmonization118 of SPS measures. To attain this objective, WTO member countries are strongly encouraged to base their SPS measures as much as possible on SPS recognized international standards, guidelines or recommendations.119 WTO members rely on the scientific and technical competence of three international standard-setting bodies to set SPS standards relevant to international trade, namely:
}} the World Organization for Animal Health (OIE), for animal health;
}} the International Plant Protection Convention (IPPC) Secretariat, for plant health; and
}} the FAO/WHO Codex Alimentarius Commission (Codex), for food safety issues.
These three organizations and the SPS Agreement comprise the current international regulatory framework with regard to SPS matters.
The standards developed by the OIE, IPPC Secretariat and Codex cover a wide range of products and traded commodities. It would be helpful for WTO members, especially developing countries, if these included references to possible adaptations needed in light of climate change. The absence of targeted international standards, guidelines or recommendations for situations arising from climate change, or delays in the development of such standards, could have negative repercussions for the SPS aim of harmonization. It may also increase the number of disputes between trading partners. However, standard setting can be a lengthy process and delays could arise in situations where the impact of changing climate on biological conditions is unpredictable, as this could prove challenging for the core scientific work upon which the standard is based.
When countries establish measures that do not conform to international standards, guidelines or recommendations, such measures need to be scientifically justified. The justification must be carried out through a scientific risk assessment (Article 5 of the SPS Agreement). Risk assessment stands at the heart of the international regulatory framework and the need to adopt technically justified SPS measures. It has also been central to every major SPS dispute dealt with through the WTO dispute settlement procedure. However, the alteration of biological processes due to climate change may impact risk assessment work for SPS measures.
Even in the absence of climate change, all risk assessments need to factor in scientific uncertainty to some degree. However, the current scarcity of dependable underlying scientific data renders risk assessments more speculative, making it more difficult to establish SPS measures that are scientifically justified,
| 81 |

vk.com/id446425943
PART 6 NON-TARIFF MEASURES (NTMs): REGULATIONS AND STANDARDS
consistent and least likely to restrict trade. Unfortunately, an absence of specific SPS measures could result in provisional measures being taken under Article 5.7 of the SPS Agreement, which could result in an increase in trade restrictions.120
As pests and diseases are not distributed uniformly around the world – many areas are free from certain pests and diseases – the least trade-restrictive and most secure way of trading products is often to import certain commodities from areas that are free from pests and diseases. The SPS Agreement specifically promotes this concept in Article 6, which states that countries shall recognize the concept of pestor disease-free areas and areas of low pest or disease prevalence.121 However, changing trade patterns and animal production configurations in response to climate change may lead to alterations in the international dissemination of pests and diseases. This could lead importing countries to implement new SPS requirements for products from areas that were previously pest free.
When designating pestor disease-free areas or areas of low pest or disease prevalence for animal and plant pests and diseases, countries will have to take into account the evolving risk of introductions due to climate change. One important factor in the establishment and maintenance of these areas is appropriate surveillance and monitoring.
Capacity required for the implementation of SPS measures in light of climate change
It is important to address whether countries have the tools to counter the threats posed by climate change and to implement and adapt their SPS framework appropriately.122 The lower latitudes will bear the brunt of climate change disadvantages,123 meaning that countries in Africa, Asia and Latin America will be disproportionally at risk and in need of further capacity to mitigate and adapt to SPS risks related to climate change.
Surveillance and monitoring
Surveillance and monitoring for pests and diseases is one of the fundamental activities of veterinary and phytosanitary services. Only
sufficient surveillance activities can detect newly introduced pests early and allow for immediate control and eradication actions. As mentioned, surveillance and monitoring is also an important tool for the implementation of measures that promote frictionless trade, for example the declaration of pestor disease-free areas or areas of low pest or disease prevalence.
Surveillance is one of the major activities to be undertaken and strengthened to address the risk posed by climate change. It may be necessary for the surveillance of specific pests and diseases to be undertaken at a regional or subregional level. Surveillance could even be performed for animal diseases and food-borne pathogens at the same time.124
Contingency and emergency measures
Climate change may accelerate and diversify outbreaks of animal and plant pests and diseases, as well as the incidence of food-borne pathogens. It may also cause outbreaks of new pests or diseases. The only way to deal with these new situations adequately is early detection and immediately implementing measures to eradicate the threat. The availability of predefined contingency plans and available eradication methods assists in the swift eradication of new threats. Strengthening rapid response capabilities will be a necessary measure to counter the effects of climate change.125 While considerable information has been provided for animal disease preparedness,126 contingency planning for the plant health sector has not been addressed prominently. Guidance is needed on how new plant pest outbreaks, in particular, could be eradicated in a timely manner.
Capacity building
The SPS regulatory framework recognizes the need to provide capacity-building assistance to developing countries where SPS risks are the greatest. The FAO Legal Office provides support to governments by preparing draft laws and capacity-development activities for lawyers and regulators. FAO has also implemented numerous SPS technical assistance projects including on animal health, plant health or food safety and continues to apply its extensive knowledge of food systems to develop integrated and
| 82 |
vk.com/id446425943
THE STATE OF AGRICULTURAL COMMODITY MARKETS 2018
sustainable solutions to food safety issues. Working directly with small-scale family farmers and governments, such projects have helped to successfully improve traceability and disease control, enable swift quarantining of disease outbreak areas, and facilitate the determination of catchment areas for export.127
Both national and international coordination are needed to ensure the efficiency and impact of the assistance provided. The Standards and Trade Development Facility (STDF)128 is a global partnership between FAO (representing Codex and the IPPC Secretariat), WTO, the World Health Organization (WHO), the OIE and the World Bank. The STDF supports developing countries in building their capacity to implement international SPS standards, guidelines, and recommendations in order to improve human, animal, and plant health and thereby gain or maintain access to markets.129 In recent years, the IPPC Secretariat has focused its work increasingly on implementation issues and the World Bank130 has established the Global Food Safety Partnership (GFSP) to tackle food safety issues.
However, developing countries in particular will require further capacity building in almost all SPS-relevant areas, including:
Diagnostic capacity
Diagnostics are a fundamental underlying discipline for SPS-related activities, be it for testing samples from surveillance activities or at borders. Many developing countries lack the technical capacity to set up state-of-the-art pest and disease diagnostic or toxicological laboratories, which are essential for the rapid identification of pests and diseases and food-borne hazards. Reliable testing and diagnostics also facilitate trade flows and avoid trade losses from misidentifications.
SPS-relevant border points
With regard to SPS control or inspection procedures, Annex C of the SPS Agreement requires that “such procedures are undertaken and completed without undue delay and in no less favourable manner for imported products than for like domestic products.”131 SPS border inspection points are the “first line of defence” against pests and diseases being unintentionally introduced through trade and determine the speed and ease at which trade flows. Good SPS border posts with sufficient infrastructure limit trade flow delays and associated costs, while ensuring effective protection against SPS risks. In many developing countries, border points need investments to prepare them for the challenges of climate change and increased trade, particularly in countries with extensive land borders.
Developing countries will be most affected by evolving SPS risks. Many will require assistance to upgrade weak SPS infrastructure, and capacity building should include risk assessment, surveillance, monitoring, diagnostics and border infrastructure. Novel approaches such as regional laboratories or centres of excellence should be explored to economize on resources and facilitate cooperation.
Climate change has changed the way SPS-relevant authorities at national, regional and international levels need to view decision-making processes and competencies, since it will not be possible to design future actions based on historical precedents.132 It is vital that SPS issues regarding climate change receive adequate attention in the broader policy debate surrounding climate change. Political weight and subsequent support for SPS needs at national, regional and international levels will only be available when SPS issues are recognized as an important component of the climate change debate. n
| 83 |

vk.com/id446425943
HERAT, AFGHANISTAN
Wheat harvest at the Urdo Khan Research Station, which conducts variety testing trials, seed purification and breeder seed production as part of an FAO project to meet the needs of farmers to enhance agricultural productivity and ensure food security. ©FAO/Giulio Napolitano
| 84 |

vk.com/id446425943
GLOSSARY
Carbon footprint:
Carbon footprint provides a measure of the total amount of carbon dioxide emissions (or other greenhouse gas emissions in carbon equivalent) directly and indirectly caused by an activity or accumulated over the life stages of a product.
Carbon labelling:
Carbon labelling provides information on the carbon dioxide emissions (or other greenhouse gas emissions in carbon equivalent) generated as a by-product of the manufacturing, transporting or disposing of a product. The labelling system is intended to encourage behaviour that would contribute to a reduction in greenhouse gas emissions.
Carbon leakage (also known as Emissions leakage):
A shift in CO2 emissions away from countries taking stringent GHG mitigation actions towards countries taking less stringent or no mitigation actions.
Climate-smart agriculture (CSA):
Agriculture that sustainably increases productivity, resilience (adaptation); reduces/removes GHGs (mitigation); and enhances achievement of national food security and development goals.
Decoupling:
In the context of agricultural support policies, decoupling refers to support given to eligible recipients that is not linked to prices or production decisions, and thus has no or minimal distorting effect on the type or volume of agricultural production.
Emissions:
See GHGs.
Emissions efficiency:
Emissions per unit of output.
Emissions misallocation:
Emissions misallocation refers to the outcome of carbon leakage when the overall impact at the global level is negative.
Emissions reallocation:
Emissions reallocation refers to the outcome of carbon leakage when the overall impact at the global level is potentially positive.
Greenhouse gases (GHGs):
Greenhouse gases refer to carbon dioxide, nitrous oxide, methane, ozone, chlorofluorocarbons and other gases occurring either naturally or resulting from human (production and consumption) activities, and contributing to the greenhouse effect (global warming).
| 85 |

vk.com/id446425943
NOTES
1 World Trade Organization (WTO). 2017. World Trade Statistical Review 2017. Geneva, Switzerland.
2 Constantinescu, C., Mattoo, A. & Ruta, M. 2015. The Global Trade Slowdown: Cyclical or Structural. World Bank Policy Research Working Paper No. 7158. Washington, DC, IMF and World Bank.
3 For further information on tariff rates imposed on rice, see: Sekhar, C.S.C. 2018. Climate change and the rice economy in Asia: Implications for trade policy. SOCO 2018 Background Paper, Rome, FAO.
4 OECD. 2016. Evolving Agricultural Policies and Markets: Implications for Multilateral Trade Reform. Paris, OECD Publishing. In this case, trade-distorting support follows OECD definitions, which are not necessarily similar to what WTO regards as distorting.
5 IPCC. 2013. Climate change 2013: the physical science basis.
Contribution of Working Group I to the Fifth Assessment Report of the Intergovernmental Panel on Climate Change. Cambridge, UK, and New York, USA, Cambridge University Press.
6 IPCC. 2014. Climate change 2014: impacts, adaptation, and vulnerability. Contribution of Working Group II to the Fifth Assessment Report of the Intergovernmental Panel on Climate Change. Cambridge, UK, and New York, USA, Cambridge University Press.
7 Purola T., Lehtonen, H., Liu, X. & Palosuo, T. 2018. Production of Cereals in Northern Marginal Areas: An Integrated Assessment of Climate Change Impacts at the Farm Level. Agricultural Systems, 162(c): 191–204.
8 For the carbon dioxide fertilization effects on rice, see Sekhar, C.S.C. 2018. Climate change and the rice economy in Asia: Implications for trade policy. SOCO 2018 Background Paper, Rome, FAO.
9 Ahammad, H., Heyhoe, E., Nelson, G., Sands, R.D., Fujimori, S., Hasegawa, T., van der Mensbrugghe, D. et al. 2015. The Role of International Trade under a Changing Climate: Insights from Global Economic Modelling. In A. Elbehri, ed. Climate Change and Food Systems: Global Assessments and Implications for Food Security and Trade. Rome, FAO; Schmidhuber J. & Tubiello, F.N. 2007. Global Food Security under Climate Change. Proceedings of the National Academy of Sciences of the United States of America, 104(50): 19703–19708; Baldos, U.L.C. & Hertel, T.W. 2015. The Role of International Trade in Managing Food Security Risks from Climate Change. Food Security, 7(2): 275–90. https://doi.org/10.1007/s12571-015-0435-z.
10 FAO. 2016. The State of Food and Agriculture. Climate change, agriculture and food security. Rome; Campbell, B. M., Vermeulen, S. J., Aggarwal, P. K., Corner-Dolloff C., Girvetz E., Loboguerrero A. M., Ramirez-Villegas J., Rosenstock T., Sebastian L., Thornton,
P. K. & Wollenberg, E. 2016. Reducing Risks to Food Security from
Climate Change. Global Food Security, 11: 34–43, 2nd International Global Food Security Conference; Schmidhuber J. & Tubiello, F.N. 2007. Global Food Security under Climate Change.
Proceedings of the National Academy of Sciences of the United States of America, 104(50): 19703–19708.
11 Nelson, G.C., Valin, H., Sands, R.D., Havlik, P., Ahammad, H., Deryng, D., Elliott, J. et al. 2014. Climate Change Effects on Agriculture: Economic Responses to Biophysical Shocks.
Proceedings of the National Academy of Sciences of the United States of America, 111(9): 3274–79. https://doi.org/10.1073/ pnas.1222465110.
12 von Lampe, M., Willenbockel, D., Ahammad, H., Blanc, E., Cai, Y., Calvin, K., Fujimori, S. et al. 2014. Why Do Global Long-Term Scenarios for Agriculture Differ? An Overview of the AgMIP Global Economic Model Intercomparison. Agricultural Economics, 45(1): 3–20. https://doi.org/10.1111/agec.12086.
13 Ahammad, H., Heyhoe, E., Nelson, G., Sands, R.D., Fujimori, S., Hasegawa, T., van der Mensbrugghe, D. et al. 2015. The Role of International Trade under a Changing Climate: Insights from Global Economic Modelling. In A. Elbehri, ed. Climate Change and Food Systems: Global Assessments and Implications for Food Security and Trade. Rome, FAO; OECD. 2015. The Economic Consequences of Climate Change. Paris, OECD Publishing. http://dx.doi.org/10.1787/9789264235410-en.
14 Havlík, P., Valin, H., Gusti, M., Schmid, E., Leclère, D., Forsell, N., Herrero, M., et al. 2015. Climate Change Impacts and Mitigation in the Developing World. Policy Research Working Paper 7477. Washington, DC, World Bank. http://documents. worldbank.org/curated/en/866881467997281798/pdf/ WPS7477.pdf.
15 Nelson, G.C., Valin, H., Sands, R.D., Havlik, P., Ahammad, H., Deryng, D., Elliott, J. et al. 2014. Climate Change Effects on Agriculture: Economic Responses to Biophysical Shocks.
Proceedings of the National Academy of Sciences, 111(9): 3274– 79, https://doi.org/10.1073/pnas.1222465110.; von Lampe, M., Willenbockel, D., Ahammad, H., Blanc, E., Cai, Y., Calvin, K., Fujimori, S. et al. 2014. Why Do Global Long-Term Scenarios for Agriculture Differ? An Overview of the AgMIP Global Economic Model Intercomparison. Agricultural Economics, 45(1): 3–20. https://doi.org/10.1111/agec.12086.
16 von Lampe, M., Willenbockel, D., Ahammad, H., Blanc, E., Cai, Y., Calvin, K., Fujimori, S. et al. 2014. Why Do Global Long-Term Scenarios for Agriculture Differ? An Overview of the AgMIP Global Economic Model Intercomparison. Agricultural Economics, 45(1): 3–20, https://doi.org/10.1111/agec.12086; Ahammad, H., Heyhoe, E., Nelson, G., Sands, R.D., Fujimori, S., Hasegawa, T., van der Mensbrugghe, D. et al. 2015. The Role of International Trade under a Changing Climate: Insights from Global Economic Modelling. In A. Elbehri, ed. Climate Change and Food Systems: Global Assessments and Implications for Food Security and Trade. Rome, FAO; OECD. 2015. The Economic Consequences of Climate Change. Paris, OECD
| 86 |

vk.com/id446425943
Publishing. http://dx.doi.org/10.1787/9789264235410-en; Havlík, P., Valin, H., Gusti, M., Schmid, E., Leclère, D., Forsell, N., Herrero, M. et al. 2015. Climate Change Impacts and Mitigation in the Developing World. Policy Research Working Paper 7477. Washington, DC, World Bank. http://documents.worldbank.org/ curated/en/866881467997281798/pdf/WPS7477.pdf; Blanco, M., Ramos, F., Van Doorslaer, B., Martínez, P., Fumagalli, D., Ceglar, A., Fernández, F.J. et al. 2017. Climate Change Impacts on EU Agriculture: A Regionalized Perspective Taking into Account MarketDriven Adjustments. Agricultural Systems, 156(c): 52–66, https://doi. org/10.1016/j.agsy.2017.05.013; Baldos, U.L.C, and Hertel, T.W. 2015. The Role of International Trade in Managing Food Security Risks from Climate Change. Food Security, 7(2): 275–90, https://doi.org/10.1007/s12571-015-0435-z.
17 Porfirio L.L., Newth, D., Cai, Y. & Finnigan, J.J. 2017. Economic shifts in agricultural production and global trade from climate change
– Technical Report. CSIRO Climate Science Centre; Oceans & Atmosphere Business Unit, Australia.
For further information on agricultural trade and climate change, please see: Zimmermann, A., Benda, J., Webber, H. & Jafari, Y. 2018. Trade, food security and climate change: conceptual linkages and policy implications. SOCO 2018 Background Paper, Rome, FAO; Hertel T. W. 2018. Climate change, agricultural trade and global food security. SOCO 2018 Background Paper, Rome, FAO.
18 Wiebe, K., Lotze-Campen, H., Sands, R., Tabeau, A., van der Mensbrugghe, D., Biewald, A., Bodirsky, B. et al. 2015. Climate Change Impacts on Agriculture in 2050 under a Range of Plausible Socioeconomic and Emissions Scenarios. Environmental Research Letters, 10(8), https://doi.org/10.1088/17489326/10/8/085010.
19 Stevanovic‘, M., Popp, A., Lotze-Campen, H., Dietrich, J.P., Müller, C., Bonsch, M., Schmitz, C. et al. 2016. The Impact of High-End Climate Change on Agricultural Welfare. Science Advances, 2(8): e1501452, https://doi.org/10.1126/sciadv.1501452.
20 Gouel, C., & Laborde, D. 2017. “The Crucial Role of International Trade in Adaptation to Climate Change.” Paper Presented at the International Technical Conference on Climate Change, Agricultural Trade and Food Security. 16 November 2017.
21 Costinot A., Donaldson D., and Smith C. Evolving Comparative Advantage and the Impact of Climate Change in Agricultural Markets: Evidence from 1.7 Million Fields around the World.
Journal of Political Economy, 124(1): 205–48, https://doi. org/10.1086/684719.
22 Stevanovic‘, M., Popp, A., Lotze-Campen, H., Dietrich, J.P., Müller, C., Bonsch, M., Schmitz, C. et al. 2016. The Impact of High-End Climate Change on Agricultural Welfare. Science Advances, 2(8): e1501452, https://doi.org/10.1126/sciadv.1501452.
23 Baldos, U.L.C, and Hertel, T.W. 2015. The Role of International Trade in Managing Food Security Risks from Climate Change. Food Security, 7(2): 275–90, https://doi.org/10.1007/s12571-015-0435-z.
24 Huang, H., von Lampe, M., & van Tongeren, F. 2011. Climate Change and Trade in Agriculture. Food Policy, 36(1): S9–S13, https://doi.org/10.1016/j.foodpol.2010.10.008.
25 Schmitz, C., Kreidenweis, U., Lotze-Campen, H., Popp, A., Krause, M., Dietrich, J.P. & Müller, C. 2015. Agricultural Trade and Tropical Deforestation: Interactions and Related Policy Options. Regional Environmental Change, 15(8): 1757–72, https://doi.org/10.1007/s10113-014-0700-2.; Dellink, R., Hwang H., Lanzi E. & Chateau J. 2017. International trade consequences of climate change. OECD Trade and Environment Working Papers, 2017/01, OECD Publishing, Paris.
26 Elbehri, A., Elliott, J. & Wheeler, T. 2015. Climate Change, Food Security and Trade: An Overview of Global Assessments and Policy Insights. In A. Elbehri ed. Climate Change and Food Systems: Global Assessments and Implications for Food Security and Trade. Rome, FAO.
27 FAO. 2016. The State of Agricultural Commodity Markets 2015–16. Trade and Food Security: Achieving a Better Balance between National Priorities and the Collective Good. Rome.
28 Wageningen Economic Research. 2018. Climate Change and Global Market Integration: Implications for global economic activities, agricultural commodities and food security. SOCO 2018 Background Paper, Rome, FAO.
29 The discussion follows the geographically motivated country and region classification of MAGNET and not that of FAO. In addition, agricultural trade and production include all edible crops, livestock, processed food, and fish. Please see Wageningen Economic Research. 2018. Climate Change and Global Market Integration: Implications for global economic activities, agricultural commodities and food security. SOCO 2018 Background Paper, Rome, FAO.
30 See also Palazzo, A., Vervoort, J.M., Mason-D’Croz, D., Rutting, L., Havlik, P., Islam, S., Bayala, J. et al. 2017. Linking Regional Stakeholder Scenarios and Shared Socioeconomic Pathways: Quantified West African Food and Climate Futures in a Global Context. Global Environmental Change, 45: 227–242; Sultan, B. and Gaetani, M. 2016. Agriculture in West Africa in the Twenty-First Century: Climate Change and Impacts Scenarios, and Potential for Adaptation. Frontiers in Plant Science, 7: 1262; Phalkey, R.K., Aranda-Jan, C., Marx, S., Höfle, B. & Sauerborn, R. 2015. Systematic Review of Current Efforts to Quantify the Impacts of Climate Change on Undernutrition. Proceedings of the National Academy of Sciences of the United States of America, 112(33): E4522–9.
31 Knox, J., Hess, T., Daccache, A. & Wheeler, T. 2012. Climate Change Impacts on Crop Productivity in Africa and South Asia.
Environmental Research Letters, 7(3).
32 Sánchez M. V. 2018. Climate Impact Assessments with a Lens on Inequality. Journal of Environment and Development. (Available at: https://doi.org/10.1177/1070496518774098.)
| 87 |

vk.com/id446425943
NOTES
33 Islam, S., Cenacchi, N., Sulser, T.B., Gbegbelegbe, S., Hareau, G., Kleinwechter, U., Mason-D‘Croz, D. et al. 2016. Structural Approaches to Modeling the Impact of Climate Change and Adaptation Technologies on Crop Yields and Food Security. Global Food Security, 10: 63–70, https://doi.org/10.1016/j.gfs.2016.08.003.
34 Net exports are defined as exports minus imports. Net exports increase if exports increase and/or imports decrease. A 1 percent decline in net exports is equivalent to a 1 percent increase in net imports. For example, the Rest of South America is projected to remain a net exporting region but will experience a decline in its net exports mainly due to an increase in imports (see Figure 2.3). Thus, its net trade position as a net exporter will weaken. Net imports are defined as imports minus exports. Net imports increase if exports decrease and/or imports increase. For example, India’s net trade position as an importer is estimated to deepen due to an increase in imports and a decrease in exports. The Russian Federation and the Caucasus, a net food importing region, is projected to increase its net exports, remaining a net food importer but softening its trade position as a net importer.
35 This part discusses some relevant points related to climate change actions and the WTO. A more comprehensive analysis can be found at WTO/UNEP. 2009. Trade and Climate Change. Geneva, WTO Publications.
36 Since then the United States of America announced its withdrawal from the Paris Agreement and ceased the implementation of its current nationally determined contribution, but affirmed its strong commitment to an approach that lowers emissions while supporting economic growth and improving energy security needs (G20 Leaders’ Declaration: Shaping an Interconnected World, July 8 2017, Hamburg).
37 That is: “Annex I,” consisting of industrialized countries and “economies in transition”; and “non-Annex I” countries. It also reflects the shift in economic power whereby many of the countries considered under the “developing country” category under the Convention’s old annexes are considered among the world’s largest economies today.
38 UNFCCC. 1992. Article 3(1) and Article 4(1).
39 FAO. 2016a. The agricultural sectors in nationally determined contributions (NDCs): Priority areas for international support. Rome.
40 Paris Agreement Article 4.2
41 Paris Agreement Article 4.4; Article 9 paragraphs 1, 3, 5, 6.
42 FAO, 2016b. The agriculture sectors in the Intended Nationally Determined Contributions: Analysis, by Strohmaier, R., Rioux, J., Seggel, A., Meybeck, A., Bernoux, M., Salvatore, M., Miranda, J. & Agostini, A. Environment and Natural Resources Management Working Paper No. 62. Rome.
43 The Intended Nationally Determined Contributions (INDCs) were submitted by Parties to the UNFCCC ahead of the COP21 and formed the basis of the Paris Agreement. They will become the first NDCs unless otherwise specified by the countries. See also FAO 2016b, p.5.
44 FAO. 2016b. Data used: FAOSTAT Emissions database, publicly available from: http://faostat3.fao.org/download/E; total agricultural emissions refer to the year 2014.
45 FAO 2016b, p.13.
46 Zimmermann, A., Benda, J., Webber, H. & Jafari, Y. 2018.
Trade, food security and climate change: conceptual linkages and policy implications. SOCO 2018 Background Paper, Rome, FAO.
47 Häberli, C. 2018. Potential Conflicts Between Agricultural Trade Rules and Climate Change Treaty Commitments. SOCO 2018 Background Paper, Rome.
48 Brandi, C. 2017. Trade Elements in Countries’ Climate Contributions under the Paris Agreement. Geneva. International Centre for Trade and Sustainable Development (ICTSD)
49 FAO. 2018. Koronivia Joint Work on Agriculture: Summary of Submissions. Paper Preview. Rome. http://www.fao.org/3/ I9302EN/i9302en.pdf
50 UNFCCC/IPCC. 2017. COP agenda item 4, Informal note by the Presidencies of COP 22 and COP 23. Talanoa dialogue Approach. 16 November 2017. https://unfccc.int/sites/default/ files/approach_to_the_talanoa_dialogue.pdf
51 GATT XX: I(a)
52 GATT XX: I(b)
53 GATT XX: I(g)
54 Chapeau of Article XX
55 The Preamble of the Marrakesh Agreement establishing the WTO, expressly refers to “allowing for the optimal use of the world’s resources in accordance with the objective of sustainable development, seeking both to protect and preserve the environment and to enhance the means for doing so in a manner consistent with their respective needs and concerns at different levels of economic development”.
56 The Appellate Body cited the Report of the Working Party on Border Tax Adjustments, BISD 18S/97, para. 18. The same test was used in Appellate Body Report, Canada — Periodicals, pp. 21–22, and in many other cases. It is also worth noting that “likeness” has been defined in the same way under Articles II:2 and III:4 GATT (cf. Appellate Body Report, Thailand — Cigarettes (Philippines), para. 116).
| 88 |

vk.com/id446425943
57 Appellate Body Report, EC — Asbestos, paras. 100–103.
58 Brandi. 2017. Also referring to differing scholarly interpretations by Low, P., Marceau, G. & Reinaud, J. 2011. The Interface between the Trade and Climate Change Regimes: Scoping the Issues. Staff Working Paper, Economic Research and Statistics Division, WTO, Geneva; Grubb, M., Hawkins, S., Jegou, I., Guei, F., Petrick, S., Villanueva, A., Lindner, S., Crawford-Brown, D. & Emmert, S. 2015. “A Report on the Political, Legal and Administrative Feasibility of Measures.” Carbon-CAP.
59 In the Preamble to the Marrakesh Agreement Establishing the WTO.
60 A number of rulings in respect of measures taken for the protection of public health or the environment have confirmed the scope for WTO Members to pursue these objectives at the level that they consider appropriate, provided that this does not lead to arbitrary or unjustifiable discrimination or a disguised restriction to trade. (For examples, please see: WTO/UNEP. 2009. Trade and Climate Change. Geneva, WTO Publications).
61 The ruling in another fossil fuel case was still pending at the time of writing: DS476 EC — Energy Package which directly challenges EU subsidizing programmes on gas. According to the WTO website, the panel report is about to be published.
62 The Panels – typically composed of three, and exceptionally five, experts – adjudicate on disputes between WTO members in the first instance. The Appellate Body (AB) consists of seven members that hear appeals from reports issued by panels. The AB can uphold, modify or reverse the legal findings and conclusions of a panel. AB Reports, once adopted by the Dispute Settlement Body (DSB), must be accepted by the parties to the dispute.
63 According to the Understanding on Rules and Procedures Governing the Settlement of Disputes (DSU), Article 3.2, the rulings and recommendations of the DSB serve only ‘to clarify the existing provisions of those agreements’ and ‘cannot add to or diminish the rights and obligations provided in the covered agreements.’
64 The General Council Decision of 6 December 2005 (WT/L/641 dated 8 December 2005) ‘Amendment of the TRIPS Agreement’ introduced an amendment allowing importing developing and least-developed countries facing public health problems and lacking the capacity to produce drugs generically to seek such medicines from third country producers under “compulsory licensing” arrangements.
65 Cf. Article IX of the Marrakesh Agreement Establishing the World Trade Organisation (the ‘WTO Agreement’); the Guiding Principles to be followed in considering applications for waivers adopted on 1 November 1956 (BISD 5S/25); the Understanding in Respect to Waivers of Obligations under the General Agreement on Tariffs and Trade 1994; and Decision-Making Procedures under Articles IX and XII of the WTO Agreement agreed by the General Council (WT/L/93).
66 Kimberley Process Certification Scheme for Rough Diamonds. General Council Waiver Decision of 15 December 2006, WTO Document WT/L/676, dated 19 December 2006. The waiver has been extended until 31 December 2018 by a decision of the General Council, dated 11 December 2012 (WTO Document WT/L/876, dated 14 December 2012).
67 UNFCCC/IPCC. 2017. Draft Decision on Issues relating to agriculture. Document FCCC/SBSTA/2017/L.24/Add.1, dated 14 November 2017.
68 FAO. 2017. Climate-Smart Agriculture Sourcebook. Rome, FAO (available at: http://www.fao.org/climate-smart-agriculture- sourcebook/en); FAO. 2010. “Climate-Smart” Agriculture: Policies, Practices, and Financing for Food Security, Adaptation and Mitigation. Rome (available at: http://www.fao.org/docrep/013/ i1881e/i1881e00.pdf).
69 Glauber, J. & Westhoff, P. 2015. The 2014 Farm Bill and the WTO. American Journal of Agricultural Economics, 97(5).
70 FAO/OECD. 2014. OECD-FAO Agricultural Outlook 2014–
2023. Paris, OECD Publishing.
71 Blandford, D., Gaasland, I. & Vårdal, E. (forthcoming). Greenhouse gas emissions, land use and food supply under the Paris Climate Agreement – policy choices in Norway. Applied Economic Perspectives and Policy.
72 FAO. 2015. Statistical Pocketbook: World Food and
Agriculture. Rome, FAO.
73 Druilhe, Z. & Barreiro-Hurlé, J. 2012. Fertilizer subsidies in Sub-Saharan Africa. Agricultural Development Economics Division Working Paper. FAO.
74 Byerlee, D., Kelly, V. A., Kopicki, R.J. & Morris, M. 2007.
Fertilizer Use in African Agriculture: lessons learned and good practice guidelines. Washington, DC, World Bank.
75 FAO. 2012. Developing a climate-smart agriculture strategy at the country level: Lessons from recent experience. Background Paper for the Second Global Conference on Agriculture, Food Security and Climate Change, Hanoi, Viet Nam, 3–7 September 2012 (available at: http://www.fao.org/docrep/016/ap401e/ ap401e.pdf).
76 Total Factor Productivity (TFP) is the portion of output not explained by the amount of inputs used in production. As such, its level is determined by the efficiency and intensity of the inputs – TFP growth is attributed to technical change and improved management.
77 UN Women. 2018. UN Women. Climate-smart agriculture paving the way for women’s empowerment in Mali and Malawi. [Cited 01 May 2018] http://www.unwomen.org/en/news/ stories/2018/3/news-csw62-climate-change-adaptation-strategies
| 89 |

vk.com/id446425943
NOTES
78 Conservation Agriculture Scaling Up Project (CASU) is being implemented by FAO and financed by the European Union (EU), via the Tenth European Development Fund (EDF). (https://ec. europa.eu/europeaid/projects/conservation-agriculture-scaling- project-casu_en)
79 The Conservation Agriculture Carbon Offset Consultation, organized by FAO and the Conservation Technology Information Center, 28–30 October 2008 (http://www.fao.org/agriculture/ crops/thematic-sitemap/theme/climatechange0/conservation- agriculture/en/).
80 FAO. 2016. Mid-term evaluation of the Conservation Agriculture Scaling-up (CASU) project. FAO Office of Evaluation, June.
81 Ontario Ministry of Agriculture, Food and Rural Affairs. [Cited 01 May 2018] http://www.omafra.gov.on.ca/english/livestock/ dairy/facts/greenhousegas.htm
82 Nkhoma, S., Kalinda, T. & Kuntashula, E. 2017. Adoption and Impact of Conservation Agriculture on Smallholder Farmers’ Crop Productivity and Income in Luapula Province, Zambia. Journal of Agricultural Science, 9(9). Canadian Center of Science and Education.
83 Alston, J. 2010. The Benefits from Agricultural Research and Development, Innovation, and Productivity Growth. OECD Food, Agriculture and Fisheries Working Papers No. 31, OECD Publishing. http://dx.doi.org/10.1787/5km91nfsnkwg-en
84 FAO. 2012. The State of Food and Agriculture: Investing in Agriculture for a Better Future. Rome (available at: http://www.fao. org/3/a-i3028e.pdf)
85 Fuglie, K.O. 2012. Productivity Growth and Technology Capital in the Global Agricultural Economy. In K.O. Fuglie, S.L. Wang, & V.E. Ball, eds. Productivity Growth in Agriculture: An International Perspective, Oxfordshire, UK, CAB International.
86 IPCC. 2014. Climate Change 2014: Impacts, Adaptation and Vulnerability. Contribution of Working Group II to the Fifth Assessment Report of the Intergovernmental Panel on Climate Change. Cambridge, Cambridge University Press. Chapter 7: Food security and food production systems.
87 Moral hazard occurs when purchasers of insurance change their behaviour to increase the likelihood of collecting payments. Adverse selection arises when risks vary across insurance buyers. Those with high risks of loss are more likely to purchase insurance than those that face lower risks, thereby increasing the probability that insurance providers will lose money. See also Kalra, A. 2013. “Partnering for Food Security in Emerging Markets.” Sigma 1. Geneva. SwissRe. Accessed at http://media.swissre.com/ documents/sigma1_2013_en.pdf.
88 Mahul, O. & Stutley, C.J. 2010. Government Support to Agricultural Insurance Challenges and Options for Developing Countries. Washington, DC, World Bank.
89 Congressional Budget Office .2017. Baseline for Farm Programs. June.
90 Greatrex H., Hansen, J.W., Garvin, S., Diro, R., Blakeley, S., Le Guen, M., Rao, K.N. & Osgood, D.E. 2015. Scaling up index insurance for smallholder farmers: Recent evidence and insights.
CCAFS Report No. 14. CGIAR Research Program on Climate Change, Agriculture and Food Security (CCAFS). University of Copenhagen, Denmark.
91 Glauber, J.W. 2012. The Growth of the Federal Crop Insurance Program, 1990–2011. American Journal of Agricultural Economics, 95(2): 482–88.
92 See Wu, J. & R. Adams. 2001. Production risk, acreage decisions and implications for revenue insurance programs.
Canadian Journal of Agricultural Economics 49(1):19–35; and, Yu, J., Smith, A. & Sumner, D. forthcoming. Effects of Crop Insurance Premium Subsidies on Crop Acreage. American Journal of Agricultural Economics.
93 World Bank. 2012. Using public food grain stocks to enhance food security. Report 71280-GLB. Washington, DC, World Bank.
94 For a discussion on public stockholding and its effects see Glauber, J.W. 2018. Domestic support measures in the context of adaptation and mitigation to climate change. SOCO 2018 Background Paper, Rome, FAO; Kornher, L. 2018. The market of maize in Eastern and Southern Africa in the context of climate change. SOCO 2018 Background Paper, Rome, FAO; and, Sekhar, C.S.C. 2018. Climate change and the rice economy in Asia: Implications for trade policy. SOCO 2018 Background Paper, Rome, FAO.
95 See for example, Balisacan, A., Sombilla, M. & Dikitanan, R. 2010. Rice crisis in the Philippines: Why did it occur and what are its policy implications? In D. Dawe, ed. The Rice Crisis: Markets, Policies and Food Security. London, FAO and Earthscan.
96 In line with a decision reached at the Ninth Ministerial Conference in Bali, Indonesia, a number of activities were added to that category to cover programmes that are particularly relevant for developing countries. These included programmes relating to land reform and rural livelihood security, such as: land rehabilitation; soil conservation and resource management; drought management and flood control; rural employment programmes; issuance of property titles; and farmer settlement programmes.
97 Branca, G., Tennigkeit, T., Mann, W. & Lipper, L. 2012.
Identifying opportunities for climate-smart agriculture investments in Africa. Economics and Policy Innovations for Climate-smart Agriculture (EPIC), Rome, FAO.
| 90 |

vk.com/id446425943
98 The terms carbon tax and carbon pricing are used, instead of GHG tax and pricing that would be more appropriate in discussions on agriculture, in order to align with the terminology of a vast literature on the subject.
99 Since various gases are involved, the size of the tax would be based on the type of gas emitted and its global warming potential. The impact of a GHG on global temperature depends on its ability to absorb and re-emit heat. Carbon dioxide is used as the standard of comparison; equivalents for other GHGs are calculated on their warming potential relative to CO2. GHGs remain in the atmosphere for different periods of time. Calculations of the carbon dioxide equivalents of gases are based on their global warming potential (GWP) over a given period of time (typically 100 years) as nitrous oxide and methane have different GWP.
100 For further information on domestic support measures in relation to adaptation and mitigation, please refer to Glauber, J.W. 2018. Domestic support measures in the context of adaptation and mitigation to climate change. SOCO 2018 Background Paper, Rome, FAO.
101 FAO. 2017. GIEWS Update Bangladesh: Severe floods in 2017 affected large numbers of people and caused damage to the agriculture sector, 3 October. http://www.fao.org/3/a-i7876e.pdf
102 Blandford, D. 1983. Instability in World Grain Markets.
Journal of Agricultural Economics 34(3): 379–395.
103 For more information, see FAO. 2017. The World Trade Organization (WTO) Agreement on Agriculture: Export Competition after the Nairobi Ministerial Conference. Trade Policy Brief No. 21, May.
104 FAO. 2017. The WTO Agreement on Agriculture: Export competition after the Nairobi Ministerial Conference. Trade Policy Briefs, No. 21, May.
105 For a discussion of counter-cyclical policy adjustments in Eastern and Southern Africa, see Kornher, L. 2018. The market of maize in Eastern and Southern Africa in the context of climate change. SOCO Background Paper, Rome, FAO.
106 This mechanism would be accessible to all developing countries, unlike the Special Agricultural Safeguards (SSGs) of the Uruguay Round Agreement on Agriculture, which was limited only to those countries and products subjected to tariffication, leaving many developing countries without recourse to the safeguards.
107 Morrison, J. & Mermigkas, G. 2014. Import Surges and the Special Safeguard Mechanism in a Changing Global Market Context. In R. Meléndez-Ortiz, C. Bellmann & J. Hepburn, eds. Tackling Agriculture in the Post-Bali Context. International Centre for Trade and Sustainable Development, Geneva, Switzerland.
108 FAO. 2014. Import surges and the Special Safeguard Mechanism revisited. Technical Note No. 15. FAO Trade Policy Technical Notes on issues related to the WTO negotiations on agriculture. In the analysis, a volume surge is identified when imports exceed a moving average of the previous three years plus a certain percentage above that average.
109 FAO. 2017. Agricultural export restrictions. Trade Policy Brief No. 27, October.
110 For a discussion on export bans see Kornher, L. 2018. The market of maize in Eastern and Southern Africa in the context of climate change. SOCO Background Paper, Rome, FAO; Sekhar, C.S.C. 2018. Climate change and the rice economy in Asia:
Implications for trade policy. SOCO Background Paper, Rome, FAO; and, Rapsomanikis, G. 2011. Price Transmission and Volatility Spillovers in Food Markets. In A. Prakash, ed. Safeguarding Food Security in Volatile Global Markets, Rome, FAO.
111 FAO. 2010. Management of Wide International Commodity Price Movements: National and International Experiences and Policy Responses. Committee on Commodity Problems 10/4. Rome.
112 Addressing the asymmetry between import and export disciplines was recommended by International Organizations to the G20 in their report on policy responses to international price volatility. See FAO, IFAD, IMF, OECD, UNCTAD, WFP, the World Bank, the WTO, IFPRI and the UN HLTF. 2011. Price Volatility in Food and Agricultural Markets: Policy Responses.
113 Here an example of a carbon tax and the subsequent increase in prices is used. Cap-and–trade schemes would have a similar result on prices, as emissions permit trading puts a price on carbon and implies a tax. Regulations that provide for production methods (like manure management) and increase production costs will also result in a price increase and would also imply a tax.
114 Paris Agreement, Article 6, paragraph 2.
115 See India etc. versus US: ‘shrimp-turtle’ (https://www.wto.org/ english/tratop_e/envir_e/edis08_e.htm).
116 Lubroth, J. 2012. Climate change and animal health. In: Building Resilience for Adaptation to Climate Change in the Agriculture Sector; Proceedings of an FAO/OECD Workshop, p. 63–70. Available at: http://www.fao.org/agriculture/crops/news- events-bulletins/detail/en/item/134976/
117 For further information on the impacts of climate change on plant and animal health and food safety, please refer to Lopian, R. 2018. Climate Change, Sanitary and Phytosanitary Measures and Agricultural Trade. SOCO 2018 Background Paper, Rome, FAO.
| 91 |

vk.com/id446425943
NOTES
118 Article 3 of the SPS Agreement provides that countries shall base their SPS measures as much as possible on the international standards, guidelines or recommendations (WTO, 1995), developed by OIE, IPPC and CODEX. The premise for this is that by applying internationally agreed standards, guidelines or recommendations, arbitrary or unjustified discrimination of trading partners will be automatically excluded.
119 WTO. 1995. The WTO Agreement on the Application of Sanitary and Phytosanitary Measures. Available at: https://www.wto.org/english/tratop_e/sps_e/spsagr_e.htm
120 STDF/World Bank. 2011. Climate Change and Trade: The Link to Sanitary and Phytosanitary Standards. Joint paper of the World Bank, Development Research Group, Trade and International Integration (DECTI) and the Standards and Trade Development Facility (STDF). Available at: http://www.standardsfacility.org/ sites/default/files/STDF_Climate_Change_EN_0.pdf
121 WTO. 1995. The WTO Agreement on the Application of Sanitary and Phytosanitary Measures. Available at: https://www. wto.org/english/tratop_e/sps_e/spsagr_e.htm
122 For further information on the capacity required for the implementation of SPS measures in light of climate change, see: Lopian, R. 2018. Climate Change, Sanitary and Phytosanitary Measures and Agricultural Trade. SOCO 2018 Background Paper, Rome, FAO.
123 IPCC. 2014a: Climate Change 2014: Impacts, Adaptation, and Vulnerability. Part A: Global and Sectoral Aspects. Contribution of Working Group II to the Fifth Assessment Report of the Intergovernmental Panel on Climate Change [Field, C.B., V.R. Barros, D.J. Dokken, K.J. Mach, M.D. Mastrandrea, T.E. Bilir, M. Chatterjee, K.L. Ebi, Y.O. Estrada, R.C. Genova, B. Girma, E.S. Kissel, A.N. Levy, S. MacCracken, P.R. Mastrandrea, and L.L. White (eds.)]. Cambridge University Press, Cambridge, United Kingdom and New York, NY, USA, 1132 pp.
124 de Balogh, K., Halliday, J. & Lubroth, J. 2013. Integrating the surveillance of animal health, foodborne pathogens and foodborne diseases in developing and in-transition countries. Revue scientifique et technique (International office of epizootonics). 32(2): 539–48.
125 Sutherst, R.W. 2008. Climate change and vulnerability to introductions by plant and animal pests and diseases. In FAO: Climate-related Transboundary Pests and Diseases. Technical Background Document from the Expert Consultation held on 25–27 February 2008, FAO, Rome. (Also available at: http://www.fao. org/3/a-ai785e.pdf).
126 See: http://www.oie.int/en/animal-health-in-the-world/the- world-animal-health-information-system/national-disease- contingency-plans/; see also: http://www.fao.org/docrep/004/ X2720E/X2720E00.HTM
127 For example: http://www.fao.org/3/a-ax460e.pdf
128 The Standards and Trade Development Facility (STDF) is a global partnership that helps developing countries to gain and maintain market access by tackling sanitary and phytosanitary (SPS) gaps, and promoting food safety, animal and plant health. Established by FAO, OIE, WHO, WTO and the World Bank Group, and including the Codex and IPPC Secretariats, the partnership works to support sustainable economic growth, poverty reduction, food security and environmental protection. The STDF provides a platform for international organizations, donors, SPS experts from developing countries and the private sector to come together to discuss SPS capacity building needs, share experiences and good practice, leverage additional funding, and work on coordinated and coherent solutions. Within the STDF, ground-breaking work has been done on relevant topics such as: (i) climate change and SPS risks; (ii) international trade and invasive alien species; (iii) public private partnerships to build SPS capacity; and (iv) facilitating safe trade, in the context of Annex C of the SPS Agreement (Control, Inspection and Approval procedures) and the Trade Facilitation Agreement. Publications, briefing notes and short film products, highlighting experiences and lessons and identifying good practice, are freely available on the STDF website. In addition, the STDF has provided funding for the development and implementation of 180+ collaborative and innovative SPS projects, assisting developing countries to meet international standards and access markets. Information on STDF projects is also available on the STDF website.
129 For more information: http://www.standardsfacility.org/sites/ default/files/STDF_Results_Factsheet_Final.pdf
130 See also: http://www.worldbank.org/en/news/press- release/2013/12/11/global-partnership-food-safety
131 Citation from Annex C 1(a) of SPS Agreement, WTO. 1995.
132 Sutherst, R.W. 2008. Climate change and vulnerability to introductions by plant and animal pests and diseases. In FAO: Climate-related Transboundary Pests and Diseases. Technical Background Document from the Expert Consultation held on 25–27 February 2008, FAO, Rome. (Also available at: http://www.fao. org/3/a-ai785e.pdf).
| 92 |
vk.com/id446425943

vk.com/id446425943
2018
THE STATE OF
AGRICULTURAL COMMODITY MARKETS
AGRICULTURAL TRADE, CLIMATE CHANGE AND FOOD SECURITY
Global agricultural trade has increased significantly in value terms since 2000. Its pattern has also changed – emerging economies and developing countries play a bigger role in international markets, and South–South agricultural trade has expanded significantly. Climate change is expected to affect agriculture, food security and nutrition unevenly across countries and regions. Changes in comparative advantage in agriculture around the world will also affect international trade.
This edition of The State of Agricultural Commodity Markets focuses on the complex and underexplored intersection between agricultural trade, climate change and food security. The report makes an important contribution to the policy debates on climate change adaptation and mitigation under the Paris Agreement and the multilateral agricultural trade rules. The report discusses policies
– both domestic support and trade measures – that can promote food security, adaptation and mitigation, and improve the livelihoods of family farmers around the world. Given both the slowand rapid-onset impacts of climate change, policies that can significantly promote climate change adaptation and mitigation would benefit from deeper discussions in international fora on how to strengthen the mutually supportive role of trade rules and climate interventions.
THE STATE OF
THE WORLD
ISBN 978-92-5-130565-2
9 7 8 9 2 5 1 3 0 5 6 5 2
I9542EN/1/09.18
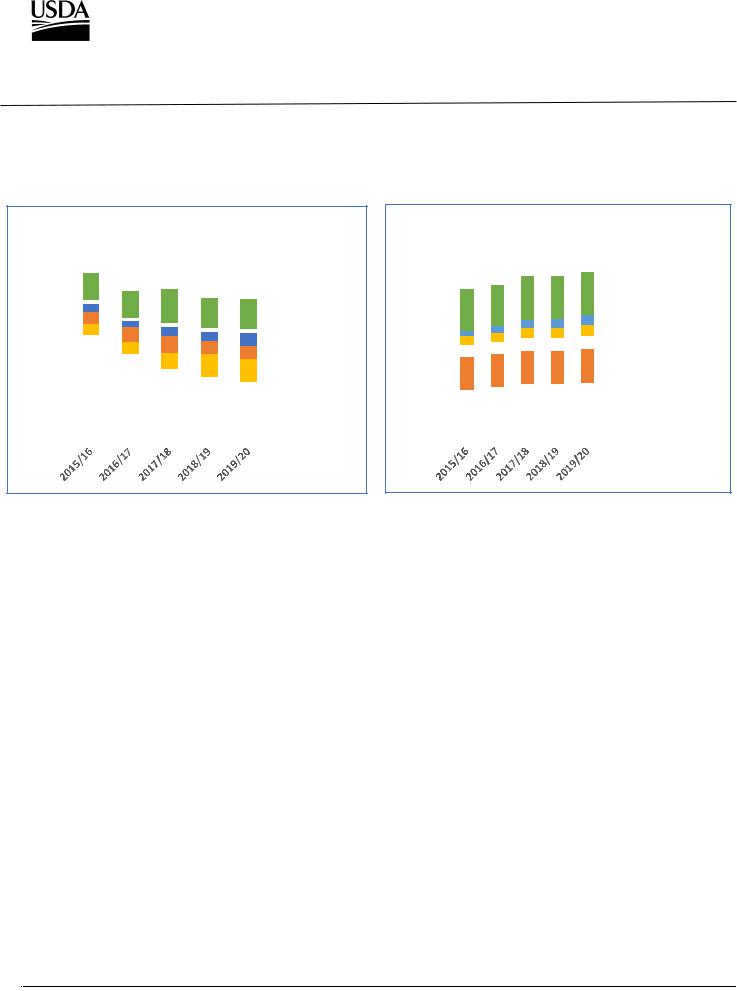
United States
vk.com/id446425943Department of
Agriculture
Foreign
Agricultural
Service
May 2019
Cotton:
World Markets and Trade
Record World Consumption Helps Lower Stocks in 2019/20
Million Bales
World Ending Stocks Down 1.0%
100 |
|
|
|
|
|
|
|
|
|
|
|
|
|
|
|
|
|
|
|
|
|
|
|
|
|
|
|
|
|
90 |
|
|
|
|
|
|
|
|
|
|
|
|
|
|
|
|
|
|
|
|
|
|
|
|
|
|
|
|
|
80 |
|
|
|
|
|
|
|
|
|
|
|
|
|
Others -0.3% |
|
|
|
|
|
|
|
|
|
|
|
|
|
||
70 |
|
|
|
|
|
|
|
|
|
|
|
|
|
|
|
|
|
|
|
|
|
|
|
|
|
|
|
||
|
|
|
|
|
|
|
|
|
|
|
|
|
||
60 |
|
|
|
|
|
|
|
|
|
|
|
|
|
Pakistan 0.9% |
|
|
|
|
|
|
|
|
|
|
|
|
|
||
50 |
|
|
|
|
|
|
|
|
|
|
|
|
|
|
|
|
|
|
|
|
|
|
|
|
|
|
|
|
|
|
|
|
|
|
|
|
|
|
|
|
|
|
|
|
40 |
|
|
|
|
|
|
|
|
|
|
|
|
|
United States |
|
|
|
|
|
|
|
|
|
|
|
|
|
||
|
|
|
|
|
|
|
|
|
|
|
||||
|
|
|
|
|
|
|
|
|
|
|
|
|
||
30 |
|
|
|
|
|
|
|
|
|
|
|
37.6% |
||
|
|
|
|
|
|
|
|
|
|
|
||||
20 |
|
|
|
|
|
|
|
|
|
|
|
|
|
India 1.4% |
|
|
|
|
|
|
|
|
|
|
|
|
|
||
|
|
|
|
|
|
|
|
|
|
|
|
|
||
|
|
|
|
|
|
|
|
|
|
|
|
|
|
|
10 |
|
|
|
Brazil 2.3% |
|
|
|
||
0 |
|
|
|
|
|
|
|
China -8.6% |
|
|
|
|
||
|
|
|
|
Million Bales
World Consumption Up 2.6%
140 |
|
|
|
|
|
|
|
|
|
|
|
|
|
|
|
|
|
|
|
|
|
|
|
|
|
|
|
|
|
120 |
|
|
|
|
|
|
|
|
|
|
|
|
|
|
|
|
|
|
|
|
|
|
|
|
|
|
|
|
|
100 |
|
|
|
|
|
|
|
|
|
|
|
|
|
Others 2.0% |
|
|
|
|
|
|
|
|
|
|
|
|
|
||
|
|
|
|
|
|
|
|
|
|
|
|
|
||
80 |
|
|
|
|
|
|
|
|
|
|
|
|
|
Vietnam 8.6% |
|
|
|
|
|
|
|
|
|
|
|
|
|
||
|
|
|
|
|
|
|
|
|
|
|
||||
|
|
|
|
|
|
|
|
|
|
|
|
|
||
60 |
|
|
|
|
|
|
|
|
|
|
|
|
|
Bangladesh 5.0% |
|
|
|
|
|
|
|
|
|
|
|
|
|
||
|
|
|
|
|
|
|
|
|
|
|
|
|
||
40 |
|
|
|
|
|
|
|
|
|
|
|
|
|
Pakistan 0.9% |
|
|
|
|
|
|
|
|
|
|
|
|
|
|
20 |
|
|
|
India 2.0% |
|
|
|
||
|
|
|
||
|
|
|
China 2.5% |
|
|
|
|
||
0 |
|
|
|
|
|
|
|
|
|
|
|
|
|
USDA’s first detailed forecast for the 2019/20 marketing year shows world ending stocks forecast down for the sixth consecutive year. However, stocks outside of China will grow after declining in 2018/19 and reach a record of nearly 45 million bales. Apart from China, ending stocks are forecast to increase in nearly all major producing and consuming countries as global production remains high relative to consumption due to Brazil’s record crops and the large increase in U.S. production. In contrast, China’s ending stocks are forecast to fall for the fifth consecutive year and be less than half the level seen at the end of China’s reserve buying in 2014/15. Flat production, continued reserve sales, and consumption growth in China will combine to work stocks down. U.S. stocks will rise sharply due to a dramatically larger forecast crop and continued restrictions on U.S. exports to China.
Global consumption is forecast to grow to a record of just under 126 million bales. World consumption will have gained 16 million bales since the low following the 2009 global financial crisis. Growth is slightly above the long-term average and is expected in all of the top ten spinning countries except Indonesia, with continued strong growth forecast for Vietnam and Bangladesh. Consumption in China is expected up at near the world pace.
For an email subscription, click here to register: https://public.govdelivery.com/accounts/USDAFAS/subscriber/ new.
Approved by the World Agricultural Outlook Board/USDA
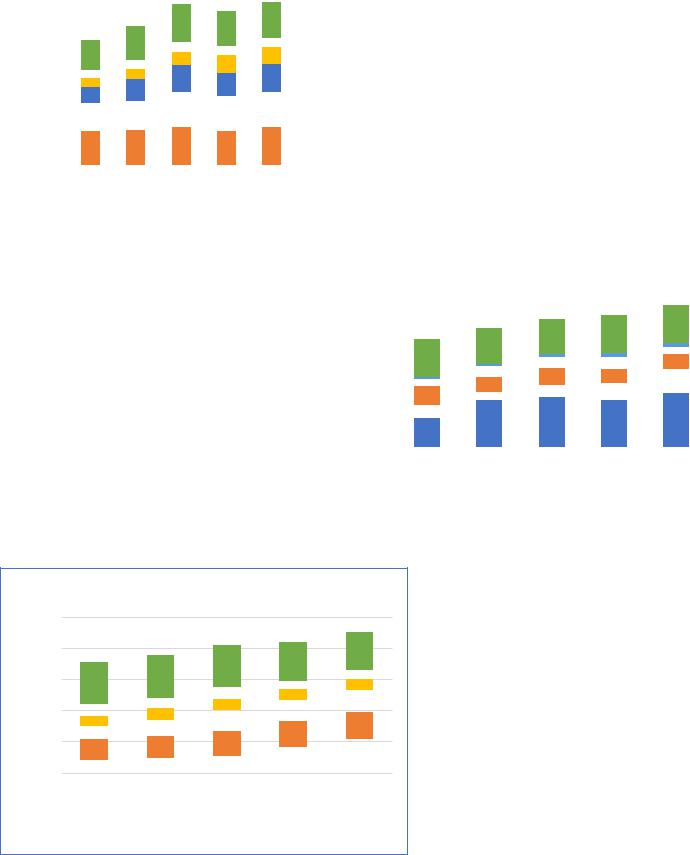
vk.com/id446425943
|
|
|
|
|
|
|
|
|
|
|
|
|
|
|
Global production in 2019/20 is forecast |
|||||||||||||
|
|
World Production Up 5.9% |
|
|
|
|
|
|
||||||||||||||||||||
|
|
|
|
|
|
|
|
nearly 6 percent higher. A sharply higher |
||||||||||||||||||||
|
140 |
|
|
|
|
|
|
|
|
|
|
|
|
|
||||||||||||||
|
|
|
|
|
|
|
|
Others 3.4% |
|
U.S. crop will provide well over half of |
||||||||||||||||||
|
|
|
|
|
|
|
|
|
||||||||||||||||||||
|
120 |
|
|
|
|
|
|
|
|
|||||||||||||||||||
|
|
|
|
|
|
|
|
|
||||||||||||||||||||
|
|
|
|
|
|
|
|
Pakistan 3.9% |
the higher production with India |
|
|
|||||||||||||||||
|
|
|
|
|
|
|
|
|
|
|||||||||||||||||||
|
|
|
|
|
|
|
|
|
|
|
||||||||||||||||||
Bales |
100 |
|
|
|
|
|
|
|
accounting for most of the rest. |
|
|
|||||||||||||||||
|
|
|
|
|
|
|
|
|
|
|
|
|
|
|
||||||||||||||
80 |
|
|
|
|
|
|
|
Brazil -6.3% |
|
Production in the Southern Hemisphere |
||||||||||||||||||
|
|
|
|
|
|
|
|
|||||||||||||||||||||
|
|
|
|
|
|
|
|
|||||||||||||||||||||
Million |
60 |
|
|
|
|
|
|
|
United States |
will be down sightly as expansion in |
||||||||||||||||||
|
|
|
|
|
|
|
||||||||||||||||||||||
40 |
|
|
|
|
|
|
|
Brazil takes a breather after seeing nearly |
||||||||||||||||||||
|
|
|
|
|
|
|
|
|||||||||||||||||||||
|
|
|
|
|
|
|
|
|||||||||||||||||||||
|
|
|
|
|
|
|
|
19.8% |
|
|
|
|
||||||||||||||||
|
|
|
|
|
|
|
|
|
|
|
|
|||||||||||||||||
|
20 |
|
|
|
|
|
|
|
China 0.0% |
|
40 percent growth in 2018/19 and |
|||||||||||||||||
|
|
|
|
|
|
|
|
|
|
|
|
|
|
Australia continues to face serious water |
||||||||||||||
|
0 |
|
|
|
|
|
|
|
India 11.8% |
|
||||||||||||||||||
|
|
|
|
|
|
|
|
|
shortages. Production in China will |
|||||||||||||||||||
|
|
|
|
|
|
|
|
|
||||||||||||||||||||
|
|
|
|
|
|
|
|
|
||||||||||||||||||||
|
2015/16 2016/17 2017/18 2018/19 2019/20 |
|
|
|
||||||||||||||||||||||||
|
|
|
|
|
|
|
|
|
||||||||||||||||||||
|
|
|
|
|
|
|
|
|
|
|
|
|
|
|
remain stable. |
|
|
|
|
|
|
|
|
|
||||
|
|
|
|
|
|
|
|
|
|
|
|
|
|
|
|
|
|
|||||||||||
|
|
|
|
|
|
|
|
|
|
|
|
|
|
|
|
|
|
|
|
|
|
|
|
|
|
|
|
|
|
|
|
|
|
|
|
|
|
|
|
|
|
|
|
World Exports Up 7.9% |
|
|
|||||||||||
|
|
|
|
|
|
|
|
|
|
|
|
|
|
50 |
|
|
|
|
|
|
|
|
|
|
|
|
|
|
|
|
|
|
|
|
|
|
|
|
|
|
|
|
|
|
|
|
|
|
|
|
|
|
|
|
|
|
|
In 2019/20, for the fourth consecutive year |
|
Bales |
40 |
|
|
|
|
|
|
|
|
|
|
|
|
|
|
|||||||||||
|
|
|
|
|
|
|
|
|
|
|
|
|
|
|
||||||||||||||
|
30 |
|
|
|
|
|
|
|
|
|
|
|
|
|
|
|||||||||||||
world trade is expected to expand. Both |
|
|
|
|
|
|
|
|
|
|
|
|
|
|
|
|
||||||||||||
|
|
Million |
|
|
|
|
|
|
|
|
|
|
|
|
|
|
||||||||||||
|
|
|
|
|
|
|
|
|
|
|
|
|
|
|
|
|
||||||||||||
the United States and Brazil will have |
|
|
20 |
|
|
|
|
|
|
|
|
|
|
|
|
|
|
|||||||||||
|
|
|
|
|
|
|
|
|
|
|
|
|
|
|
|
|
|
|
||||||||||
large exportables supplies: a record late- |
|
|
|
|
|
10 |
|
|
|
|
|
|
|
|
|
|
|
|
|
|
||||||||
harvested 2018/19 Brazilan crop which |
|
|
|
|
|
|
|
|
|
|
|
|
|
|
|
|
|
|
|
|||||||||
|
|
|
|
|
|
|
|
|
|
|
|
|
|
|
|
|
|
|
|
|||||||||
will be followed shortly on the market by |
|
|
|
|
0 |
|
|
|
|
|
|
|
|
|
|
|
|
|
|
|||||||||
|
|
|
2015/16 |
2016/17 |
2017/18 |
2018/19 |
2019/20 |
|
||||||||||||||||||||
the sharply higher 2019/20 U.S. crop. |
|
|
|
|
|
|
|
|||||||||||||||||||||
|
|
|
|
|
United States 15.3% Brazil 41.4% |
|
India 7.1% |
|
|
|||||||||||||||||||
|
|
|
|
|
|
|
|
|
|
|
|
|
|
|
|
|
||||||||||||
|
|
|
|
|
|
|
|
|
|
|
|
|
|
|
|
|
||||||||||||
|
|
|
|
|
|
|
|
|
|
|
|
|
|
Australia -42.9% |
|
|
Benin 5.7% |
|
Others 0.8% |
|||||||||
|
|
|
|
|
|
|
|
|
|
|
|
|
|
|
|
|
||||||||||||
|
|
|
|
|
|
|
|
|
|
|
|
|
|
|
|
|
||||||||||||
|
|
|
|
|
|
|
|
|
|
|
|
|
|
|
|
|
|
|
|
|
|
|
|
|
|
|
|
|
World Imports Up 7.9%
|
50 |
|
Bales |
40 |
|
30 |
||
Million |
||
20 |
||
|
||
|
10 |
|
|
0 |
2015/16 |
2016/17 |
2017/18 |
2018/19 |
2019/20 |
||||
|
China 29.4% |
|
|
Bangladesh 5.0% |
|
Vietnam 7.0% |
|
|
|
|
|
||||||
|
|
|
||||||
|
Indonesia 0.0% |
|
Turkey 0.0% |
|
Others -0.6% |
|
||
|
|
|
|
|||||
|
|
|
|
|||||
The expanded world trade will be driven by higher use in importing countries. Vietnam and Bangladesh imports will continue commensurate with their expansion in spinning. China’s imports are nearly 30 percent higher as a shift in its State Reserve policy – from reducing to rotating reserves – is bringing China back strongly into the global market.
Foreign Agricultural Service/USDA |
2 |
May 2019 |
Office of Global Analysis |
|
|
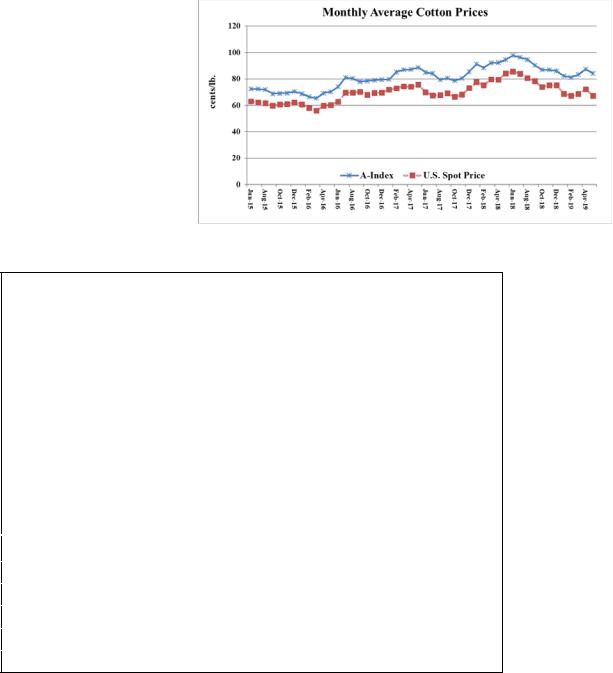
vk.com/id446425943
Overview
For 2019/20, the initial forecast shows higher global production, consumption, and trade compared to 2018/19. Stocks in China continue to decline while stocks elsewhere rise. However, total ending stocks will decline slightly. The U.S. forecast shows larger production, higher exports and ending stocks, with use unchanged. The U.S. season-average farm price is projected at 65 cents per pound, down 5 cents.
Compared to last month, global production for 2018/19 is forecast down slightly, as smaller crops in India and the United States more than offset a larger crop in Brazil. Trade forecasts see only minor adjustments, notably lower exports for the United States and higher imports for China. U.S. stocks are up. The U.S. season-average farm price is unchanged at 70 cents/lbs.
For current prices received by farmers click here; NASS farm price
Prices
The A-index and the U.S. spot prices are down on concerns regarding U.S.-China trade negotiations.
For more information on U.S. spot price click here; AMS Cotton Market News
2018/19 TRADE OUTLOOK
|
Major Importers: |
|
|
|
1,000 bales |
|
|
|
|
|
|
|
|
Change |
Current |
Prev. |
Reason |
|
|
|
|
|
|
|
WORLD |
- |
42,028 |
42,090 |
|
|
|
|
|
|
|
|
China |
500 |
8,500 |
8,000 |
Expanded quota |
|
|
|
|
|
|
|
Indonesia |
-300 |
3,200 |
3,500 |
Weaker yarn exports |
|
|
|
|
|
|
|
Vietnam |
-200 |
7,100 |
7,300 |
Weaker yarn exports |
|
|
|
|
|
|
|
Major Exporters |
|
|
|
1000 bales |
|
|
Change |
Current |
Prev. |
Reason |
|
|
|
|
|
|
|
WORLD |
- |
41,731 |
42,086 |
|
|
|
|
|
|
|
|
Australia |
400 |
4,200 |
3,800 |
Strong early new crop |
|
shipments |
||||
|
|
|
|
|
|
|
Brazil |
-300 |
4,200 |
4,500 |
Slow pace of shipments |
|
|
|
|
|
|
|
Mexico |
-100 |
500 |
600 |
Slow pace of shipments |
|
|
|
|
|
|
|
Cote d’Ivoire |
100 |
850 |
750 |
Larger crop |
|
|
|
|
|
|
|
United States |
-250 |
14,750 |
15,000 |
Slow pace of shipments |
|
|
|
|
|
|
Foreign Agricultural Service/USDA |
3 |
May 2019 |
Office of Global Analysis |
|
|

vk.com/id446425943
The Foreign Agricultural Service (FAS) updates its production, supply and distribution (PSD) database for cotton, oilseeds, and grains at 12:00 p.m. on the day the World Agricultural Supply and Demand Estimates (WASDE) report is released. This circular is released by 12:15 p.m.
FAS Reports and Databases:
Questions may be directed to:
James Johnson |
(202) |
690-1546 |
James.Johnson@fas.usda.gov |
(James.Johnson@usda.gov) |
|
|
|
Graham Soley |
(202) |
772-4235 |
Graham.Soley@fas.usda.gov |
(Graham.Soley@usda.gov) |
|
|
|
Current World Market and Trade and World Agricultural Production Reports:
https://apps.fas.usda.gov/psdonline/app/index.html#/app/downloads
Archives World Market and Trade and World Agricultural Production Reports:
http://usda.mannlib.cornell.edu/MannUsda/viewTaxonomy.do?taxonomyID=7
Production, Supply and Distribution Database (PSD Online):
https://apps.fas.usda.gov/psdonline/app/index.html#/app/home
Global Agricultural Trade System (U.S. Exports and Imports):
http://apps.fas.usda.gov/gats/default.aspx
Export Sales Report:
http://apps.fas.usda.gov/esrquery/
Global Agricultural Information Network (Agricultural Attaché Reports):
http://gain.fas.usda.gov/Pages/Default.aspx
Other USDA Reports:
World Agricultural Supply and Demand Estimates (WASDE):
http://www.usda.gov/oce/commodity/wasde/
Economic Research Service:
http://www.ers.usda.gov/topics/crops
National Agricultural Statistics Service:
http://www.nass.usda.gov/Publications/
Foreign Agricultural Service/USDA |
4 |
May 2019 |
Office of Global Analysis |
|
|
vk.com/id446425943
Summary of Changes in estimates and Forecasts from Last Month
(1,000 480 lb Bales and 1,000 Ha)
Country Mktg |
Area |
Beginning |
|
Production |
Imports |
Exports |
Use |
Loss |
Total Dom. |
Ending |
Year |
Harvested |
Stocks |
|
|
|
|
|
|
Cons. |
Stocks |
|
|
|
|
|
|
|
|
|
|
|
Australia |
|
|
|
|
|
|
|
|
|
|
2018/19 |
0 |
|
0 |
0 |
0 |
400 |
0 |
0 |
0 |
-400 |
Benin |
|
|
|
|
|
|
|
|
|
|
2018/19 |
90 |
|
0 |
100 |
0 |
25 |
0 |
0 |
0 |
75 |
Brazil |
|
|
|
|
|
|
|
|
|
|
2018/19 |
25 |
|
0 |
1,000 |
0 |
-200 |
0 |
0 |
0 |
1,200 |
Bulgaria |
|
|
|
|
|
|
|
|
|
|
2018/19 |
0 |
|
0 |
0 |
-4 |
0 |
-4 |
0 |
-4 |
0 |
Burkina |
|
|
|
|
|
|
|
|
|
|
2018/19 |
0 |
|
0 |
-80 |
0 |
0 |
0 |
0 |
0 |
-80 |
Cameroon |
|
|
|
|
|
|
|
|
|
|
2018/19 |
20 |
|
0 |
75 |
0 |
50 |
0 |
0 |
0 |
25 |
Chad |
|
|
|
|
|
|
|
|
|
|
2018/19 |
-60 |
|
0 |
-50 |
0 |
0 |
0 |
0 |
0 |
-50 |
China |
|
|
|
|
|
|
|
|
|
|
2018/19 |
0 |
|
0 |
0 |
500 |
0 |
0 |
0 |
0 |
500 |
Cote d'Ivoire |
|
|
|
|
|
|
|
|
|
|
2016/17 |
0 |
|
0 |
18 |
0 |
0 |
0 |
0 |
0 |
18 |
2017/18 |
-39 |
|
18 |
20 |
0 |
0 |
0 |
0 |
0 |
38 |
2018/19 |
22 |
|
38 |
75 |
0 |
100 |
0 |
0 |
0 |
13 |
Czech Republic |
|
|
|
|
|
|
|
|
|
|
2018/19 |
0 |
|
0 |
0 |
-2 |
0 |
-2 |
0 |
-2 |
0 |
Egypt |
|
|
|
|
|
|
|
|
|
|
2018/19 |
-4 |
|
0 |
0 |
0 |
0 |
0 |
0 |
0 |
0 |
Germany |
|
|
|
|
|
|
|
|
|
|
2018/19 |
0 |
|
0 |
0 |
-10 |
-5 |
-5 |
0 |
-5 |
0 |
India |
|
|
|
|
|
|
|
|
|
|
2018/19 |
0 |
|
0 |
-1,500 |
0 |
0 |
0 |
0 |
0 |
-1,500 |
Indonesia |
|
|
|
|
|
|
|
|
|
|
2018/19 |
0 |
|
0 |
0 |
-300 |
0 |
-300 |
0 |
-300 |
0 |
Iran |
|
|
|
|
|
|
|
|
|
|
2018/19 |
-5 |
|
0 |
0 |
0 |
0 |
0 |
0 |
0 |
0 |
Foreign Agricultural Service/USDA |
5 |
May 2019 |
Office of Global Analysis |
|
|
vk.com/id446425943
Summary of Changes in estimates and Forecasts from Last Month (Continued)
(1,000 480 lb Bales and 1,000 Ha)
Country Mktg |
Area |
Beginning |
Production |
Imports |
Exports |
Use |
Loss |
Total Dom. |
Ending |
Year |
Harvested |
Stocks |
|
|
|
|
|
Cons. |
Stocks |
|
|
|
|
|
|
|
|
|
|
Kazakhstan |
|
|
|
|
|
|
|
|
|
2018/19 |
-2 |
0 |
0 |
0 |
0 |
0 |
0 |
0 |
0 |
Kyrgyzstan |
|
|
|
|
|
|
|
|
|
2018/19 |
-2 |
0 |
0 |
0 |
0 |
0 |
0 |
0 |
0 |
Malaysia |
|
|
|
|
|
|
|
|
|
2018/19 |
0 |
0 |
0 |
-25 |
0 |
0 |
0 |
0 |
-25 |
Mali |
|
|
|
|
|
|
|
|
|
2018/19 |
-10 |
0 |
-90 |
0 |
0 |
0 |
0 |
0 |
-90 |
Mexico |
|
|
|
|
|
|
|
|
|
2018/19 |
0 |
0 |
-35 |
0 |
-100 |
0 |
0 |
0 |
65 |
Mozambique |
|
|
|
|
|
|
|
|
|
2018/19 |
5 |
0 |
20 |
0 |
10 |
0 |
0 |
0 |
10 |
Netherlands |
|
|
|
|
|
|
|
|
|
2016/17 |
0 |
0 |
0 |
1 |
0 |
1 |
0 |
1 |
0 |
2017/18 |
0 |
0 |
0 |
11 |
0 |
10 |
0 |
10 |
1 |
2018/19 |
0 |
1 |
0 |
16 |
0 |
15 |
0 |
15 |
2 |
Poland |
|
|
|
|
|
|
|
|
|
2018/19 |
0 |
0 |
0 |
-4 |
0 |
-4 |
0 |
-4 |
0 |
Russia |
|
|
|
|
|
|
|
|
|
2018/19 |
0 |
0 |
0 |
-30 |
0 |
-30 |
0 |
-30 |
0 |
Senegal |
|
|
|
|
|
|
|
|
|
2018/19 |
-4 |
0 |
-11 |
0 |
-10 |
0 |
0 |
0 |
-1 |
South Africa |
|
|
|
|
|
|
|
|
|
2018/19 |
-1 |
0 |
4 |
0 |
0 |
0 |
0 |
0 |
4 |
Spain |
|
|
|
|
|
|
|
|
|
2018/19 |
0 |
0 |
0 |
0 |
-25 |
10 |
0 |
10 |
15 |
Syria |
|
|
|
|
|
|
|
|
|
2014/15 |
0 |
0 |
0 |
0 |
15 |
0 |
0 |
0 |
-15 |
2015/16 |
0 |
-15 |
0 |
0 |
30 |
0 |
0 |
0 |
-45 |
2016/17 |
0 |
-45 |
0 |
0 |
-45 |
0 |
0 |
0 |
0 |
2017/18 |
0 |
0 |
0 |
0 |
10 |
0 |
0 |
0 |
-10 |
2018/19 |
0 |
-10 |
10 |
0 |
15 |
10 |
0 |
10 |
-25 |
Foreign Agricultural Service/USDA |
6 |
May 2019 |
Office of Global Analysis |
|
|
vk.com/id446425943
Summary of Changes in estimates and Forecasts from Last Month (Continued)
(1,000 480 lb Bales and 1,000 Ha)
Country Mktg |
Area |
Beginning |
Production |
Imports |
Exports |
Use |
Loss |
Total Dom. |
Ending |
Year |
Harvested |
Stocks |
|
|
|
|
|
Cons. |
Stocks |
|
|
|
|
|
|
|
|
|
|
Tajikistan |
|
|
|
|
|
|
|
|
|
2018/19 |
-10 |
0 |
0 |
0 |
-75 |
35 |
0 |
35 |
40 |
Togo |
|
|
|
|
|
|
|
|
|
2018/19 |
25 |
0 |
10 |
0 |
10 |
0 |
0 |
0 |
0 |
United States |
|
|
|
|
|
|
|
|
|
2018/19 |
-132 |
0 |
-23 |
0 |
-250 |
0 |
-23 |
-23 |
250 |
Venezuela |
|
|
|
|
|
|
|
|
|
2018/19 |
0 |
0 |
0 |
-3 |
0 |
0 |
0 |
0 |
-3 |
Vietnam |
|
|
|
|
|
|
|
|
|
2018/19 |
0 |
0 |
0 |
-200 |
0 |
-200 |
0 |
-200 |
0 |
|
|
|
|
|
|
|
|
|
|
World |
|
|
|
|
|
|
|
|
|
World |
|
|
|
|
|
|
|
|
|
2014/15 |
0 |
0 |
0 |
0 |
15 |
0 |
0 |
0 |
-15 |
2015/16 |
0 |
-15 |
0 |
0 |
30 |
0 |
0 |
0 |
-45 |
2016/17 |
0 |
-45 |
18 |
1 |
-45 |
1 |
0 |
1 |
18 |
2017/18 |
-39 |
18 |
20 |
11 |
10 |
10 |
0 |
10 |
29 |
2018/19 |
-43 |
29 |
-495 |
-62 |
-55 |
-475 |
-23 |
-498 |
25 |
|
|
|
|
|
|
|
|
|
|
Foreign Agricultural Service/USDA |
7 |
May 2019 |
Office of Global Analysis |
|
|

vk.com/id446425943
Table 01 Cotton World Supply, Use, and Trade (Season Beginning August 1)
(1000 MT)
|
|
|
|
|
|
|
|
|
|
|
|
May |
|
|
2014/15 |
2015/16 |
2016/17 |
2017/18 |
2018/19 |
2019/20 |
|
||||||
Production |
|
|
|
|
|
|
|
|
|
|
|
none |
|
India |
6,423 |
5,639 |
5,879 |
6,314 |
5,552 |
|
6,205 |
||||||
China |
6,532 |
4,790 |
4,953 |
5,987 |
6,042 |
|
6,042 |
||||||
United States |
3,553 |
2,806 |
3,738 |
4,555 |
3,999 |
|
4,790 |
||||||
Brazil |
1,563 |
1,289 |
1,528 |
2,007 |
2,787 |
|
2,613 |
||||||
Pakistan |
2,308 |
1,524 |
1,676 |
1,785 |
1,676 |
|
1,742 |
||||||
Turkey |
697 |
577 |
697 |
871 |
806 |
|
893 |
||||||
Uzbekistan |
849 |
827 |
811 |
840 |
718 |
|
680 |
||||||
Other |
|
4,032 |
|
3,483 |
|
3,944 |
|
4,589 |
|
4,206 |
|
4,350 |
|
Total |
25,957 |
20,936 |
23,227 |
26,951 |
25,786 |
|
27,315 |
||||||
USE Dom. Consumption |
|
|
|
|
|
|
|
|
|
|
|
none |
|
China |
7,512 |
7,838 |
8,382 |
8,927 |
8,818 |
|
9,036 |
||||||
India |
5,334 |
5,389 |
5,302 |
5,258 |
5,400 |
|
5,508 |
||||||
Pakistan |
2,308 |
2,243 |
2,243 |
2,351 |
2,308 |
|
2,330 |
||||||
Bangladesh |
1,263 |
1,372 |
1,481 |
1,633 |
1,742 |
|
1,829 |
||||||
Vietnam |
893 |
980 |
1,176 |
1,459 |
1,524 |
|
1,655 |
||||||
Turkey |
1,393 |
1,459 |
1,426 |
1,622 |
1,415 |
|
1,459 |
||||||
Brazil |
740 |
675 |
697 |
740 |
762 |
|
784 |
||||||
Other |
|
4,993 |
|
4,700 |
|
4,590 |
|
4,740 |
|
4,748 |
|
4,818 |
|
Total |
24,436 |
24,655 |
25,296 |
26,730 |
26,717 |
|
27,418 |
||||||
Imports |
|
|
|
|
|
|
|
|
|
|
|
none |
|
China |
1,804 |
959 |
1,096 |
1,246 |
1,851 |
|
2,395 |
||||||
Bangladesh |
1,252 |
1,388 |
1,481 |
1,655 |
1,742 |
|
1,829 |
||||||
Vietnam |
931 |
1,002 |
1,197 |
1,524 |
1,546 |
|
1,655 |
||||||
Indonesia |
728 |
640 |
738 |
762 |
697 |
|
697 |
||||||
Turkey |
800 |
918 |
801 |
876 |
653 |
|
653 |
||||||
Pakistan |
207 |
718 |
533 |
718 |
653 |
|
631 |
||||||
India |
267 |
233 |
596 |
365 |
305 |
|
305 |
||||||
Other |
|
1,864 |
|
1,858 |
|
1,765 |
|
1,791 |
|
1,704 |
|
1,709 |
|
Total |
7,852 |
7,717 |
8,207 |
8,937 |
9,151 |
|
9,874 |
||||||
Exports |
|
|
|
|
|
|
|
|
|
|
|
none |
|
United States |
2,449 |
1,993 |
3,248 |
3,450 |
3,211 |
|
3,701 |
||||||
Brazil |
851 |
939 |
607 |
909 |
1,263 |
|
1,785 |
||||||
India |
914 |
1,255 |
991 |
1,128 |
914 |
|
980 |
||||||
Australia |
523 |
616 |
812 |
852 |
914 |
|
523 |
||||||
Benin |
163 |
142 |
174 |
218 |
288 |
|
305 |
||||||
Greece |
254 |
209 |
221 |
234 |
272 |
|
299 |
||||||
Mali |
185 |
218 |
239 |
283 |
283 |
|
294 |
||||||
Other |
|
2,475 |
|
2,174 |
|
1,950 |
|
1,836 |
|
2,004 |
|
1,986 |
|
Total |
7,815 |
7,544 |
8,243 |
8,911 |
9,151 |
|
9,873 |
||||||
Ending Stocks |
|
|
|
|
|
|
|
|
|
|
|
none |
|
China |
14,461 |
12,345 |
9,998 |
8,278 |
7,320 |
|
6,694 |
||||||
Brazil |
1,548 |
1,243 |
1,509 |
1,885 |
2,658 |
|
2,718 |
||||||
India |
2,305 |
1,534 |
1,716 |
2,009 |
1,551 |
|
1,573 |
||||||
United States |
795 |
827 |
599 |
936 |
1,012 |
|
1,393 |
||||||
Pakistan |
629 |
569 |
504 |
616 |
605 |
|
611 |
||||||
Bangladesh |
290 |
330 |
355 |
404 |
431 |
|
458 |
||||||
Turkey |
347 |
334 |
333 |
387 |
332 |
|
338 |
||||||
Other |
|
2,886 |
|
2,477 |
|
2,497 |
|
3,138 |
|
2,739 |
|
2,694 |
|
Total |
23,262 |
19,659 |
17,509 |
17,653 |
16,649 |
|
16,479 |
||||||
|
|
|
|
|
|
|
|
|
|
|
|
|
|
Foreign Agricultural Service/USDA |
8 |
May 2019 |
Office of Global Analysis |
|
|
vk.com/id446425943
Table 02 Cotton World Supply, Use, and Trade (Season Beginning August 1)
(1000 Bales)
|
|
|
|
|
|
|
|
|
|
|
|
May |
|
|
2014/15 |
2015/16 |
2016/17 |
2017/18 |
2018/19 |
2019/20 |
|
||||||
Production |
|
|
|
|
|
|
|
|
|
|
|
none |
|
Brazil |
7,180 |
5,920 |
7,020 |
9,220 |
12,800 |
|
12,000 |
||||||
China |
30,000 |
22,000 |
22,750 |
27,500 |
27,750 |
|
27,750 |
||||||
India |
29,500 |
25,900 |
27,000 |
29,000 |
25,500 |
|
28,500 |
||||||
Pakistan |
10,600 |
7,000 |
7,700 |
8,200 |
7,700 |
|
8,000 |
||||||
Turkey |
3,200 |
2,650 |
3,200 |
4,000 |
3,700 |
|
4,100 |
||||||
United States |
16,319 |
12,888 |
17,170 |
20,923 |
18,367 |
|
22,000 |
||||||
Uzbekistan |
3,900 |
3,800 |
3,725 |
3,860 |
3,300 |
|
3,125 |
||||||
Other |
|
18,520 |
|
15,998 |
|
18,116 |
|
21,079 |
|
19,317 |
|
19,979 |
|
Total |
119,219 |
96,156 |
106,681 |
123,782 |
118,434 |
|
125,454 |
||||||
USE Dom. Consumption |
|
|
|
|
|
|
|
|
|
|
|
none |
|
Bangladesh |
5,800 |
6,300 |
6,800 |
7,500 |
8,000 |
|
8,400 |
||||||
Brazil |
3,400 |
3,100 |
3,200 |
3,400 |
3,500 |
|
3,600 |
||||||
China |
34,500 |
36,000 |
38,500 |
41,000 |
40,500 |
|
41,500 |
||||||
India |
24,500 |
24,750 |
24,350 |
24,150 |
24,800 |
|
25,300 |
||||||
Indonesia |
3,250 |
3,000 |
3,300 |
3,500 |
3,200 |
|
3,200 |
||||||
Pakistan |
10,600 |
10,300 |
10,300 |
10,800 |
10,600 |
|
10,700 |
||||||
Turkey |
6,400 |
6,700 |
6,550 |
7,450 |
6,500 |
|
6,700 |
||||||
United States |
3,575 |
3,450 |
3,250 |
3,225 |
3,100 |
|
3,100 |
||||||
Uzbekistan |
1,750 |
1,800 |
2,000 |
2,500 |
2,750 |
|
3,000 |
||||||
Vietnam |
4,100 |
4,500 |
5,400 |
6,700 |
7,000 |
|
7,600 |
||||||
Other |
14,356 |
13,337 |
12,532 |
12,544 |
12,757 |
12,828 |
|||||||
Total |
|
|
|
|
|
|
|
|
|
|
|
|
|
112,231 |
113,237 |
116,182 |
122,769 |
122,707 |
|
125,928 |
|||||||
Imports |
|
|
|
|
|
|
|
|
|
|
|
none |
|
Bangladesh |
5,750 |
6,375 |
6,800 |
7,600 |
8,000 |
|
8,400 |
||||||
China |
8,284 |
4,406 |
5,032 |
5,725 |
8,500 |
|
11,000 |
||||||
India |
1,226 |
1,072 |
2,736 |
1,677 |
1,400 |
|
1,400 |
||||||
Indonesia |
3,345 |
2,941 |
3,391 |
3,498 |
3,200 |
|
3,200 |
||||||
Korea, South |
1,321 |
1,175 |
1,025 |
904 |
800 |
|
775 |
||||||
Mexico |
830 |
975 |
1,000 |
925 |
850 |
|
850 |
||||||
Pakistan |
950 |
3,300 |
2,450 |
3,300 |
3,000 |
|
2,900 |
||||||
Thailand |
1,475 |
1,275 |
1,226 |
1,149 |
1,175 |
|
1,175 |
||||||
Turkey |
3,675 |
4,218 |
3,679 |
4,024 |
3,000 |
|
3,000 |
||||||
Vietnam |
4,275 |
4,600 |
5,500 |
7,000 |
7,100 |
|
7,600 |
||||||
Other |
4,934 |
5,107 |
4,857 |
5,246 |
5,003 |
5,051 |
|||||||
Total |
|
|
|
|
|
|
|
|
|
|
|
|
|
36,065 |
35,444 |
37,696 |
41,048 |
42,028 |
|
45,351 |
|||||||
Exports |
|
|
|
|
|
|
|
|
|
|
|
none |
|
Australia |
2,404 |
2,828 |
3,731 |
3,915 |
4,200 |
|
2,400 |
||||||
Benin |
750 |
650 |
800 |
1,000 |
1,325 |
|
1,400 |
||||||
Brazil |
3,910 |
4,314 |
2,789 |
4,174 |
5,800 |
|
8,200 |
||||||
Burkina |
1,300 |
1,100 |
1,150 |
1,150 |
1,100 |
|
1,100 |
||||||
Cameroon |
475 |
550 |
500 |
400 |
550 |
|
550 |
||||||
Cote d'Ivoire |
860 |
780 |
625 |
620 |
850 |
|
800 |
||||||
Greece |
1,165 |
959 |
1,017 |
1,076 |
1,250 |
|
1,375 |
||||||
India |
4,199 |
5,764 |
4,550 |
5,182 |
4,200 |
|
4,500 |
||||||
Mali |
850 |
1,000 |
1,100 |
1,300 |
1,300 |
|
1,350 |
||||||
United States |
11,246 |
9,153 |
14,917 |
15,847 |
14,750 |
|
17,000 |
||||||
Other |
8,734 |
7,553 |
6,682 |
6,264 |
6,706 |
6,673 |
|||||||
Total |
|
|
|
|
|
|
|
|
|
|
|
|
|
35,893 |
34,651 |
37,861 |
40,928 |
42,031 |
|
45,348 |
|||||||
Ending Stocks |
|
|
|
|
|
|
|
|
|
|
|
none |
|
Bangladesh |
1,331 |
1,515 |
1,630 |
1,855 |
1,980 |
|
2,105 |
||||||
Brazil |
7,112 |
5,709 |
6,929 |
8,657 |
12,207 |
|
12,482 |
||||||
China |
66,420 |
56,698 |
45,919 |
38,019 |
33,619 |
|
30,744 |
||||||
India |
10,586 |
7,044 |
7,880 |
9,225 |
7,125 |
|
7,225 |
||||||
Pakistan |
2,890 |
2,615 |
2,315 |
2,830 |
2,780 |
|
2,805 |
||||||
Turkey |
1,596 |
1,533 |
1,528 |
1,777 |
1,527 |
|
1,552 |
||||||
United States |
3,650 |
3,800 |
2,750 |
4,300 |
4,650 |
|
6,400 |
||||||
Other |
13,257 |
11,376 |
11,467 |
14,414 |
12,581 |
12,375 |
|||||||
Total |
|
|
|
|
|
|
|
|
|
|
|
|
|
106,842 |
90,290 |
80,418 |
81,077 |
76,469 |
|
75,688 |
|||||||
|
|
|
|
|
|
|
|
|
|
|
|
|
|
Foreign Agricultural Service/USDA |
9 |
May 2019 |
Office of Global Analysis |
|
|
vk.com/id446425943
Table 04 Cotton Area, Yield, and Production
|
|
Area |
|
|
|
Yield |
|
|
|
|
|
|
Production |
|
Change in Production |
|
||||||||
Country / Region |
|
(Million hectares) |
(Kilograms per hectare) |
|
|
|
(Million 480 lb. bales) |
|
|
|
|
|
|
|||||||||||
|
|
Prel. |
|
2019/20 Proj. |
2017/18 |
Prel. |
|
|
2019/20 Proj. |
|
|
|
|
Prel. |
2019/20 Proj. |
From last month |
From last year |
|||||||
|
2017/18 |
2018/19 |
|
|
May |
2018/19 |
|
|
May |
|
2017/18 |
|
2018/19 |
|
May |
MBales |
|
Percent |
MBales |
|
Percent |
|||
|
|
|
|
|
|
|
|
|
|
|||||||||||||||
World |
33.58 |
33.22 |
34.54 |
803 |
776 |
|
791 |
123.78 |
118.43 |
125.45 |
|
|
|
7.02 |
|
5.93 |
||||||||
United States |
4.49 |
4.13 |
5.08 |
1,014 |
968 |
|
944 |
20.92 |
18.37 |
22.00 |
|
|
|
3.63 |
|
19.78 |
||||||||
Total Foreign |
29.09 |
29.09 |
29.46 |
770 |
749 |
|
765 |
102.86 |
100.07 |
103.45 |
|
|
|
3.39 |
|
3.38 |
||||||||
none |
|
|
|
|
|
|
|
|
|
|
|
|
|
|
|
|
|
|
|
|
|
|
|
|
Western Hemisphere |
|
|
|
|
|
|
|
|
|
|
|
|
|
|
|
|
|
|
|
|
|
|
|
|
Brazil |
1.18 |
1.60 |
1.55 |
1,708 |
1,747 |
|
1,686 |
9.22 |
12.80 |
12.00 |
|
|
|
-0.80 |
|
-6.25 |
||||||||
Mexico |
0.21 |
0.24 |
0.24 |
1,617 |
1,546 |
|
1,588 |
1.56 |
1.69 |
1.75 |
|
|
|
0.06 |
|
3.55 |
||||||||
Argentina |
0.32 |
0.42 |
0.42 |
558 |
596 |
|
612 |
0.82 |
1.15 |
1.18 |
|
|
|
0.03 |
|
2.61 |
||||||||
Paraguay |
0.01 |
0.01 |
0.01 |
416 |
416 |
|
416 |
0.02 |
0.02 |
0.02 |
|
|
|
0.00 |
|
0.00 |
||||||||
Peru |
0.02 |
0.02 |
0.02 |
1,012 |
1,025 |
|
1,025 |
0.08 |
0.08 |
0.08 |
|
|
|
0.00 |
|
0.00 |
||||||||
Colombia |
0.01 |
0.01 |
0.01 |
968 |
968 |
|
968 |
0.04 |
0.04 |
0.04 |
|
|
|
0.00 |
|
0.00 |
||||||||
Africa |
|
|
|
|
|
|
|
|
|
|
|
|
|
|
|
|
|
|
|
|
|
|
|
|
Burkina |
0.85 |
0.64 |
0.73 |
307 |
313 |
|
360 |
1.20 |
0.92 |
1.20 |
|
|
|
0.28 |
|
30.43 |
||||||||
Mali |
0.71 |
0.72 |
0.74 |
432 |
381 |
|
419 |
1.40 |
1.26 |
1.43 |
|
|
|
0.17 |
|
13.10 |
||||||||
Cote d'Ivoire |
0.33 |
0.39 |
0.41 |
536 |
486 |
|
441 |
0.81 |
0.88 |
0.83 |
|
|
|
-0.05 |
|
-5.14 |
||||||||
Cameroon |
0.23 |
0.25 |
0.25 |
484 |
523 |
|
492 |
0.50 |
0.60 |
0.57 |
|
|
|
-0.04 |
|
-5.83 |
||||||||
Benin |
0.53 |
0.65 |
0.68 |
468 |
469 |
|
468 |
1.14 |
1.40 |
1.45 |
|
|
|
0.05 |
|
3.57 |
||||||||
Chad |
0.12 |
0.06 |
0.22 |
181 |
145 |
|
198 |
0.10 |
0.04 |
0.20 |
|
|
|
0.16 |
|
400.00 |
||||||||
Togo |
0.16 |
0.19 |
0.19 |
299 |
282 |
|
312 |
0.22 |
0.24 |
0.27 |
|
|
|
0.03 |
|
10.42 |
||||||||
Senegal |
0.02 |
0.02 |
0.02 |
359 |
301 |
|
331 |
0.03 |
0.03 |
0.04 |
|
|
|
0.01 |
|
20.69 |
||||||||
Egypt |
0.09 |
0.14 |
0.10 |
718 |
772 |
|
762 |
0.30 |
0.50 |
0.35 |
|
|
|
-0.15 |
|
-30.00 |
||||||||
Zimbabwe |
0.20 |
0.20 |
0.20 |
294 |
218 |
|
207 |
0.27 |
0.20 |
0.19 |
|
|
|
-0.01 |
|
-5.00 |
||||||||
Nigeria |
0.27 |
0.27 |
0.27 |
190 |
190 |
|
190 |
0.24 |
0.24 |
0.24 |
|
|
|
0.00 |
|
0.00 |
||||||||
Asia Oceania |
|
|
|
|
|
|
|
|
|
|
|
|
|
|
|
|
|
|
|
|
|
|
|
|
China |
3.40 |
3.50 |
3.45 |
1,761 |
1,726 |
|
1,751 |
27.50 |
27.75 |
27.75 |
|
|
|
0.00 |
|
0.00 |
||||||||
India |
12.45 |
12.25 |
12.35 |
507 |
453 |
|
502 |
29.00 |
25.50 |
28.50 |
|
|
|
3.00 |
|
11.76 |
||||||||
Pakistan |
2.70 |
2.40 |
2.50 |
661 |
699 |
|
697 |
8.20 |
7.70 |
8.00 |
|
|
|
0.30 |
|
3.90 |
||||||||
Kazakhstan |
0.13 |
0.13 |
0.13 |
523 |
561 |
|
587 |
0.30 |
0.33 |
0.35 |
|
|
|
0.02 |
|
4.55 |
||||||||
Tajikistan |
0.19 |
0.18 |
0.18 |
671 |
544 |
|
544 |
0.57 |
0.45 |
0.45 |
|
|
|
0.00 |
|
0.00 |
||||||||
Turkmenistan |
0.55 |
0.55 |
0.55 |
535 |
364 |
|
459 |
1.34 |
0.91 |
1.15 |
|
|
|
0.24 |
|
26.37 |
||||||||
Uzbekistan |
1.25 |
1.10 |
1.01 |
672 |
653 |
|
674 |
3.86 |
3.30 |
3.13 |
|
|
|
-0.18 |
|
-5.30 |
||||||||
Turkey |
0.47 |
0.52 |
0.54 |
1,853 |
1,549 |
|
1,653 |
4.00 |
3.70 |
4.10 |
|
|
|
0.40 |
|
10.81 |
||||||||
Australia |
0.53 |
0.30 |
0.30 |
1,972 |
1,814 |
|
1,597 |
4.80 |
2.50 |
2.20 |
|
|
|
-0.30 |
|
-12.00 |
||||||||
Syria |
0.03 |
0.03 |
0.03 |
1,161 |
1,219 |
|
1,219 |
0.16 |
0.14 |
0.14 |
|
|
|
0.00 |
|
0.00 |
||||||||
Burma |
0.25 |
0.24 |
0.24 |
634 |
635 |
|
635 |
0.73 |
0.70 |
0.70 |
|
|
|
0.00 |
|
0.00 |
||||||||
Europe |
|
|
|
|
|
|
|
|
|
|
|
|
|
|
|
|
|
|
|
|
|
|
|
|
Greece |
0.23 |
0.25 |
0.26 |
1,157 |
1,253 |
|
1,231 |
1.22 |
1.41 |
1.47 |
|
|
|
0.06 |
|
4.26 |
||||||||
Others |
1.68 |
1.83 |
1.89 |
420 |
427 |
|
427 |
3.24 |
3.60 |
3.71 |
|
|
|
0.11 |
|
3.09 |
||||||||
Note: Yeild for Total Foreign and Others is an incorrect calculation.
Foreign Agricultural Service/USDA |
10 |
May 2019 |
Office of Global Analysis |
|
|
vk.com/id446425943
Table 05 Cotton Supply and Distribution MY 2019/20
(1,000 HA and 1000 480-lb. Bales)
Country |
Area |
Productio |
Imports |
Total |
Use |
Loss |
Exports |
Ending |
|
Harvested |
n |
|
Supply |
|
|
|
Stocks |
Afghanistan |
36 |
65 |
0 |
82 |
30 |
0 |
35 |
17 |
Albania |
1 |
1 |
0 |
2 |
1 |
0 |
0 |
1 |
Algeria |
0 |
0 |
30 |
35 |
30 |
0 |
0 |
5 |
Angola |
2 |
5 |
10 |
22 |
15 |
0 |
0 |
7 |
Argentina |
420 |
1,180 |
15 |
1,805 |
625 |
0 |
525 |
655 |
Armenia |
0 |
0 |
0 |
0 |
0 |
0 |
0 |
0 |
Australia |
300 |
2,200 |
0 |
3,504 |
35 |
0 |
2,400 |
1,069 |
Austria |
0 |
0 |
15 |
18 |
15 |
0 |
0 |
3 |
Azerbaijan |
135 |
390 |
0 |
520 |
120 |
0 |
250 |
150 |
Bahrain |
0 |
0 |
40 |
48 |
40 |
0 |
0 |
8 |
Bangladesh |
44 |
135 |
8,400 |
10,515 |
8,400 |
10 |
0 |
2,105 |
Belarus |
0 |
0 |
40 |
44 |
40 |
0 |
0 |
4 |
Belgium-Luxembour |
0 |
0 |
30 |
36 |
20 |
0 |
10 |
6 |
Benin |
675 |
1,450 |
0 |
1,753 |
15 |
0 |
1,400 |
338 |
Bolivia |
4 |
8 |
2 |
15 |
10 |
0 |
0 |
5 |
Brazil |
1,550 |
12,000 |
75 |
24,282 |
3,600 |
0 |
8,200 |
12,482 |
Bulgaria |
2 |
10 |
25 |
43 |
35 |
0 |
0 |
8 |
Burkina |
725 |
1,200 |
0 |
1,420 |
25 |
0 |
1,100 |
295 |
Burma |
240 |
700 |
75 |
994 |
775 |
0 |
5 |
214 |
Cambodia |
0 |
0 |
1 |
2 |
1 |
0 |
0 |
1 |
Cameroon |
250 |
565 |
0 |
734 |
20 |
0 |
550 |
164 |
Canada |
0 |
0 |
2 |
2 |
2 |
0 |
0 |
0 |
Central African Republic |
32 |
32 |
0 |
44 |
0 |
0 |
32 |
12 |
Chad |
220 |
200 |
0 |
261 |
10 |
0 |
175 |
76 |
Chile |
0 |
0 |
0 |
0 |
0 |
0 |
0 |
0 |
China |
3,450 |
27,750 |
11,000 |
72,369 |
41,500 |
0 |
125 |
30,744 |
Colombia |
9 |
40 |
135 |
211 |
170 |
0 |
5 |
36 |
Congo (Kinshasa) |
30 |
15 |
2 |
21 |
17 |
0 |
0 |
4 |
Costa Rica |
1 |
1 |
42 |
57 |
45 |
0 |
0 |
12 |
Cote d'Ivoire |
410 |
830 |
0 |
1,105 |
25 |
0 |
800 |
280 |
Croatia |
0 |
0 |
0 |
0 |
0 |
0 |
0 |
0 |
Cuba |
4 |
4 |
10 |
16 |
14 |
0 |
0 |
2 |
Cyprus |
0 |
0 |
0 |
0 |
0 |
0 |
0 |
0 |
Czech Republic |
0 |
0 |
7 |
9 |
7 |
0 |
0 |
2 |
Denmark |
0 |
0 |
0 |
0 |
0 |
0 |
0 |
0 |
Foreign Agricultural Service/USDA |
11 |
May 2019 |
Office of Global Analysis |
|
|
vk.com/id446425943
Table 05 Cotton Supply and Distribution MY 2019/20 (Continued)
(1,000 HA and 1000 480-lb. Bales)
Country |
Area |
Productio |
Imports |
Total |
Use |
Loss |
Exports |
Ending |
|
Harvested |
n |
|
Supply |
|
|
|
Stocks |
Dominican Republic |
4 |
3 |
1 |
5 |
4 |
0 |
0 |
1 |
Ecuador |
3 |
9 |
75 |
106 |
85 |
0 |
0 |
21 |
Egypt |
100 |
350 |
525 |
1,109 |
650 |
10 |
225 |
224 |
El Salvador |
1 |
1 |
180 |
224 |
180 |
0 |
0 |
44 |
Estonia |
0 |
0 |
10 |
12 |
10 |
0 |
0 |
2 |
Ethiopia |
80 |
200 |
50 |
338 |
250 |
0 |
0 |
88 |
France |
0 |
0 |
40 |
48 |
35 |
0 |
5 |
8 |
Germany |
0 |
0 |
110 |
134 |
90 |
0 |
20 |
24 |
Ghana |
16 |
28 |
0 |
39 |
10 |
0 |
20 |
9 |
Greece |
260 |
1,470 |
25 |
1,609 |
90 |
50 |
1,375 |
94 |
Guatemala |
2 |
3 |
135 |
164 |
135 |
0 |
0 |
29 |
Guinea |
12 |
14 |
0 |
17 |
0 |
0 |
14 |
3 |
Haiti |
7 |
5 |
5 |
11 |
10 |
0 |
0 |
1 |
Honduras |
2 |
4 |
20 |
29 |
24 |
0 |
0 |
5 |
Hong Kong |
0 |
0 |
0 |
0 |
0 |
0 |
0 |
0 |
Hungary |
0 |
0 |
3 |
3 |
0 |
0 |
3 |
0 |
India |
12,350 |
28,500 |
1,400 |
37,025 |
25,300 |
0 |
4,500 |
7,225 |
Indonesia |
3 |
3 |
3,200 |
3,816 |
3,200 |
0 |
5 |
611 |
Iran |
80 |
275 |
300 |
720 |
575 |
0 |
0 |
145 |
Iraq |
10 |
15 |
35 |
73 |
50 |
0 |
0 |
23 |
Ireland |
0 |
0 |
0 |
0 |
0 |
0 |
0 |
0 |
Israel |
6 |
45 |
2 |
59 |
0 |
0 |
50 |
9 |
Italy |
0 |
0 |
170 |
192 |
165 |
0 |
5 |
22 |
Japan |
0 |
0 |
215 |
249 |
215 |
0 |
0 |
34 |
Kazakhstan |
128 |
345 |
0 |
473 |
65 |
0 |
275 |
133 |
Kenya |
30 |
25 |
15 |
58 |
40 |
0 |
0 |
18 |
Korea, North |
19 |
55 |
95 |
205 |
150 |
0 |
0 |
55 |
Korea, South |
0 |
0 |
775 |
932 |
775 |
0 |
5 |
152 |
Kyrgyzstan |
18 |
110 |
0 |
130 |
0 |
0 |
110 |
20 |
Latvia |
0 |
0 |
7 |
9 |
6 |
0 |
1 |
2 |
Lebanon |
0 |
0 |
5 |
6 |
5 |
0 |
0 |
1 |
Lesotho |
0 |
0 |
90 |
115 |
90 |
0 |
0 |
25 |
Lithuania |
0 |
0 |
0 |
0 |
0 |
0 |
0 |
0 |
Macedonia |
0 |
0 |
5 |
6 |
5 |
0 |
0 |
1 |
Madagascar |
20 |
30 |
0 |
45 |
20 |
0 |
10 |
15 |
Foreign Agricultural Service/USDA |
12 |
May 2019 |
Office of Global Analysis |
|
|
vk.com/id446425943
Table 05 Cotton Supply and Distribution MY 2019/20 (Continued)
(1,000 HA and 1000 480-lb. Bales)
Country |
Area |
Productio |
Imports |
Total |
Use |
Loss |
Exports |
Ending |
|
Harvested |
n |
|
Supply |
|
|
|
Stocks |
Malawi |
80 |
90 |
0 |
169 |
5 |
0 |
60 |
104 |
Malaysia |
0 |
0 |
675 |
1,140 |
375 |
0 |
300 |
465 |
Mali |
740 |
1,425 |
0 |
1,936 |
25 |
0 |
1,350 |
561 |
Mauritius |
0 |
0 |
120 |
141 |
120 |
0 |
0 |
21 |
Mexico |
240 |
1,750 |
850 |
3,320 |
2,000 |
25 |
550 |
745 |
Moldova |
0 |
0 |
70 |
82 |
65 |
0 |
0 |
17 |
Morocco |
1 |
1 |
45 |
59 |
50 |
0 |
0 |
9 |
Mozambique |
125 |
115 |
0 |
200 |
5 |
0 |
110 |
85 |
Netherlands |
0 |
0 |
15 |
17 |
15 |
0 |
0 |
2 |
Nicaragua |
4 |
10 |
0 |
12 |
1 |
0 |
9 |
2 |
Niger |
5 |
9 |
0 |
14 |
3 |
0 |
6 |
5 |
Nigeria |
270 |
235 |
0 |
304 |
200 |
0 |
30 |
74 |
Pakistan |
2,500 |
8,000 |
2,900 |
13,680 |
10,700 |
25 |
150 |
2,805 |
Panama |
0 |
0 |
0 |
0 |
0 |
0 |
0 |
0 |
Paraguay |
11 |
21 |
8 |
37 |
12 |
0 |
15 |
10 |
Peru |
17 |
80 |
250 |
413 |
325 |
0 |
5 |
83 |
Philippines |
1 |
2 |
65 |
81 |
65 |
0 |
0 |
16 |
Poland |
0 |
0 |
12 |
15 |
12 |
0 |
0 |
3 |
Portugal |
0 |
0 |
180 |
218 |
180 |
0 |
0 |
38 |
Romania |
0 |
0 |
1 |
2 |
1 |
0 |
0 |
1 |
Russia |
0 |
0 |
165 |
206 |
170 |
0 |
0 |
36 |
Senegal |
23 |
35 |
0 |
40 |
0 |
0 |
35 |
5 |
Serbia |
0 |
0 |
8 |
10 |
8 |
0 |
0 |
2 |
Singapore |
0 |
0 |
5 |
7 |
0 |
0 |
5 |
2 |
Slovakia |
0 |
0 |
2 |
3 |
2 |
0 |
0 |
1 |
Slovenia |
0 |
0 |
6 |
8 |
6 |
0 |
0 |
2 |
Somalia |
12 |
7 |
3 |
11 |
10 |
0 |
0 |
1 |
South Africa |
45 |
215 |
30 |
441 |
110 |
0 |
125 |
206 |
Spain |
65 |
300 |
10 |
385 |
40 |
0 |
275 |
70 |
Sri Lanka |
5 |
5 |
8 |
17 |
13 |
0 |
0 |
4 |
Sudan |
200 |
600 |
0 |
789 |
75 |
0 |
475 |
239 |
Sweden |
0 |
0 |
0 |
0 |
0 |
0 |
0 |
0 |
Switzerland |
0 |
0 |
2 |
3 |
2 |
0 |
0 |
1 |
Syria |
25 |
140 |
0 |
164 |
65 |
0 |
50 |
49 |
Taiwan |
0 |
0 |
650 |
802 |
650 |
0 |
0 |
152 |
Foreign Agricultural Service/USDA |
13 |
May 2019 |
Office of Global Analysis |
|
|
vk.com/id446425943
Table 05 Cotton Supply and Distribution MY 2019/20 (Continued)
(1,000 HA and 1000 480-lb. Bales)
Country |
Area |
Productio |
Imports |
Total |
Use |
Loss |
Exports |
Ending |
|
|
Harvested |
n |
|
Supply |
|
|
|
Stocks |
|
Tajikistan |
180 |
450 |
0 |
761 |
100 |
0 |
400 |
261 |
|
Tanzania |
500 |
400 |
0 |
775 |
175 |
0 |
275 |
325 |
|
Thailand |
1 |
2 |
1,175 |
1,380 |
1,150 |
25 |
0 |
205 |
|
Togo |
185 |
265 |
0 |
342 |
15 |
0 |
250 |
77 |
|
Tunisia |
2 |
10 |
20 |
35 |
30 |
0 |
0 |
5 |
|
Turkey |
540 |
4,100 |
3,000 |
8,627 |
6,700 |
0 |
375 |
1,552 |
|
Turkmenistan |
545 |
1,150 |
0 |
1,579 |
700 |
0 |
450 |
429 |
|
Uganda |
75 |
125 |
0 |
225 |
15 |
0 |
110 |
100 |
|
Ukraine |
0 |
0 |
5 |
6 |
5 |
0 |
0 |
1 |
|
United Kingdom |
0 |
0 |
2 |
3 |
2 |
0 |
0 |
1 |
|
United States |
5,075 |
22,000 |
5 |
26,655 |
3,100 |
155 |
17,000 |
6,400 |
|
Uruguay |
0 |
0 |
0 |
0 |
0 |
0 |
0 |
0 |
|
Uzbekistan |
1,010 |
3,125 |
0 |
4,408 |
3,000 |
0 |
300 |
1,108 |
|
Venezuela |
15 |
85 |
15 |
120 |
90 |
0 |
0 |
30 |
|
Vietnam |
1 |
3 |
7,600 |
8,891 |
7,600 |
0 |
0 |
1,291 |
|
Yemen |
18 |
28 |
0 |
34 |
25 |
0 |
3 |
6 |
|
Zambia |
130 |
210 |
0 |
428 |
5 |
0 |
225 |
198 |
|
Zimbabwe |
200 |
190 |
0 |
349 |
30 |
10 |
175 |
134 |
|
|
|
|
|
|
|
|
|
|
|
World |
|
|
|
|
|
|
|
|
|
World |
34,537 |
125,454 |
45,351 |
247,274 |
125,928 |
310 |
45,348 |
75,688 |
|
|
|
|
|
|
|
|
|
|
|
Foreign Agricultural Service/USDA |
14 |
May 2019 |
Office of Global Analysis |
|
|
vk.com/id446425943
Table 05A Cotton Supply and Distribution MY 2019/20
(1000 MT and 1000 HA)
Country |
Area |
Productio |
Imports |
Total |
Use |
Loss |
Exports |
Ending |
|
Harvested |
n |
|
Supply |
|
|
|
Stocks |
Afghanistan |
36 |
14 |
0 |
18 |
7 |
0 |
8 |
4 |
Albania |
1 |
0 |
0 |
0 |
0 |
0 |
0 |
0 |
Algeria |
0 |
0 |
7 |
8 |
7 |
0 |
0 |
1 |
Angola |
2 |
1 |
2 |
5 |
3 |
0 |
0 |
2 |
Argentina |
420 |
257 |
3 |
393 |
136 |
0 |
114 |
143 |
Armenia |
0 |
0 |
0 |
0 |
0 |
0 |
0 |
0 |
Australia |
300 |
479 |
0 |
763 |
8 |
0 |
523 |
233 |
Austria |
0 |
0 |
3 |
4 |
3 |
0 |
0 |
1 |
Azerbaijan |
135 |
85 |
0 |
113 |
26 |
0 |
54 |
33 |
Bahrain |
0 |
0 |
9 |
10 |
9 |
0 |
0 |
2 |
Bangladesh |
44 |
29 |
1,829 |
2,289 |
1,829 |
2 |
0 |
458 |
Belarus |
0 |
0 |
9 |
10 |
9 |
0 |
0 |
1 |
Belgium-Luxembour |
0 |
0 |
7 |
8 |
4 |
0 |
2 |
1 |
Benin |
675 |
316 |
0 |
382 |
3 |
0 |
305 |
74 |
Bolivia |
4 |
2 |
0 |
3 |
2 |
0 |
0 |
1 |
Brazil |
1,550 |
2,613 |
16 |
5,287 |
784 |
0 |
1,785 |
2,718 |
Bulgaria |
2 |
2 |
5 |
9 |
8 |
0 |
0 |
2 |
Burkina |
725 |
261 |
0 |
309 |
5 |
0 |
239 |
64 |
Burma |
240 |
152 |
16 |
216 |
169 |
0 |
1 |
47 |
Cambodia |
0 |
0 |
0 |
0 |
0 |
0 |
0 |
0 |
Cameroon |
250 |
123 |
0 |
160 |
4 |
0 |
120 |
36 |
Canada |
0 |
0 |
0 |
0 |
0 |
0 |
0 |
0 |
Central African Republic |
32 |
7 |
0 |
10 |
0 |
0 |
7 |
3 |
Chad |
220 |
44 |
0 |
57 |
2 |
0 |
38 |
17 |
Chile |
0 |
0 |
0 |
0 |
0 |
0 |
0 |
0 |
China |
3,450 |
6,042 |
2,395 |
15,757 |
9,036 |
0 |
27 |
6,694 |
Colombia |
9 |
9 |
29 |
46 |
37 |
0 |
1 |
8 |
Congo (Kinshasa) |
30 |
3 |
0 |
5 |
4 |
0 |
0 |
1 |
Costa Rica |
1 |
0 |
9 |
12 |
10 |
0 |
0 |
3 |
Cote d'Ivoire |
410 |
181 |
0 |
241 |
5 |
0 |
174 |
61 |
Croatia |
0 |
0 |
0 |
0 |
0 |
0 |
0 |
0 |
Cuba |
4 |
1 |
2 |
3 |
3 |
0 |
0 |
0 |
Cyprus |
0 |
0 |
0 |
0 |
0 |
0 |
0 |
0 |
Czech Republic |
0 |
0 |
2 |
2 |
2 |
0 |
0 |
0 |
Denmark |
0 |
0 |
0 |
0 |
0 |
0 |
0 |
0 |
Foreign Agricultural Service/USDA |
15 |
May 2019 |
Office of Global Analysis |
|
|
vk.com/id446425943
Table 05A Cotton Supply and Distribution MY 2019/20 (Continued)
(1000 MT and 1000 HA)
Country |
Area |
Productio |
Imports |
Total |
Use |
Loss |
Exports |
Ending |
|
Harvested |
n |
|
Supply |
|
|
|
Stocks |
Dominican Republic |
4 |
1 |
0 |
1 |
1 |
0 |
0 |
0 |
Ecuador |
3 |
2 |
16 |
23 |
19 |
0 |
0 |
5 |
Egypt |
100 |
76 |
114 |
241 |
142 |
2 |
49 |
49 |
El Salvador |
1 |
0 |
39 |
49 |
39 |
0 |
0 |
10 |
Estonia |
0 |
0 |
2 |
3 |
2 |
0 |
0 |
0 |
Ethiopia |
80 |
44 |
11 |
74 |
54 |
0 |
0 |
19 |
France |
0 |
0 |
9 |
10 |
8 |
0 |
1 |
2 |
Germany |
0 |
0 |
24 |
29 |
20 |
0 |
4 |
5 |
Ghana |
16 |
6 |
0 |
8 |
2 |
0 |
4 |
2 |
Greece |
260 |
320 |
5 |
350 |
20 |
11 |
299 |
20 |
Guatemala |
2 |
1 |
29 |
36 |
29 |
0 |
0 |
6 |
Guinea |
12 |
3 |
0 |
4 |
0 |
0 |
3 |
1 |
Haiti |
7 |
1 |
1 |
2 |
2 |
0 |
0 |
0 |
Honduras |
2 |
1 |
4 |
6 |
5 |
0 |
0 |
1 |
Hong Kong |
0 |
0 |
0 |
0 |
0 |
0 |
0 |
0 |
Hungary |
0 |
0 |
1 |
1 |
0 |
0 |
1 |
0 |
India |
12,350 |
6,205 |
305 |
8,061 |
5,508 |
0 |
980 |
1,573 |
Indonesia |
3 |
1 |
697 |
831 |
697 |
0 |
1 |
133 |
Iran |
80 |
60 |
65 |
157 |
125 |
0 |
0 |
32 |
Iraq |
10 |
3 |
8 |
16 |
11 |
0 |
0 |
5 |
Ireland |
0 |
0 |
0 |
0 |
0 |
0 |
0 |
0 |
Israel |
6 |
10 |
0 |
13 |
0 |
0 |
11 |
2 |
Italy |
0 |
0 |
37 |
42 |
36 |
0 |
1 |
5 |
Japan |
0 |
0 |
47 |
54 |
47 |
0 |
0 |
7 |
Kazakhstan |
128 |
75 |
0 |
103 |
14 |
0 |
60 |
29 |
Kenya |
30 |
5 |
3 |
13 |
9 |
0 |
0 |
4 |
Korea, North |
19 |
12 |
21 |
45 |
33 |
0 |
0 |
12 |
Korea, South |
0 |
0 |
169 |
203 |
169 |
0 |
1 |
33 |
Kyrgyzstan |
18 |
24 |
0 |
28 |
0 |
0 |
24 |
4 |
Latvia |
0 |
0 |
2 |
2 |
1 |
0 |
0 |
0 |
Lebanon |
0 |
0 |
1 |
1 |
1 |
0 |
0 |
0 |
Lesotho |
0 |
0 |
20 |
25 |
20 |
0 |
0 |
5 |
Lithuania |
0 |
0 |
0 |
0 |
0 |
0 |
0 |
0 |
Macedonia |
0 |
0 |
1 |
1 |
1 |
0 |
0 |
0 |
Madagascar |
20 |
7 |
0 |
10 |
4 |
0 |
2 |
3 |
Foreign Agricultural Service/USDA |
16 |
May 2019 |
Office of Global Analysis |
|
|
vk.com/id446425943
Table 05A Cotton Supply and Distribution MY 2019/20 (Continued)
(1000 MT and 1000 HA)
Country |
Area |
Productio |
Imports |
Total |
Use |
Loss |
Exports |
Ending |
|
Harvested |
n |
|
Supply |
|
|
|
Stocks |
Malawi |
80 |
20 |
0 |
37 |
1 |
0 |
13 |
23 |
Malaysia |
0 |
0 |
147 |
248 |
82 |
0 |
65 |
101 |
Mali |
740 |
310 |
0 |
422 |
5 |
0 |
294 |
122 |
Mauritius |
0 |
0 |
26 |
31 |
26 |
0 |
0 |
5 |
Mexico |
240 |
381 |
185 |
723 |
435 |
5 |
120 |
162 |
Moldova |
0 |
0 |
15 |
18 |
14 |
0 |
0 |
4 |
Morocco |
1 |
0 |
10 |
13 |
11 |
0 |
0 |
2 |
Mozambique |
125 |
25 |
0 |
44 |
1 |
0 |
24 |
19 |
Netherlands |
0 |
0 |
3 |
4 |
3 |
0 |
0 |
0 |
Nicaragua |
4 |
2 |
0 |
3 |
0 |
0 |
2 |
0 |
Niger |
5 |
2 |
0 |
3 |
1 |
0 |
1 |
1 |
Nigeria |
270 |
51 |
0 |
66 |
44 |
0 |
7 |
16 |
Pakistan |
2,500 |
1,742 |
631 |
2,978 |
2,330 |
5 |
33 |
611 |
Panama |
0 |
0 |
0 |
0 |
0 |
0 |
0 |
0 |
Paraguay |
11 |
5 |
2 |
8 |
3 |
0 |
3 |
2 |
Peru |
17 |
17 |
54 |
90 |
71 |
0 |
1 |
18 |
Philippines |
1 |
0 |
14 |
18 |
14 |
0 |
0 |
3 |
Poland |
0 |
0 |
3 |
3 |
3 |
0 |
0 |
1 |
Portugal |
0 |
0 |
39 |
47 |
39 |
0 |
0 |
8 |
Romania |
0 |
0 |
0 |
0 |
0 |
0 |
0 |
0 |
Russia |
0 |
0 |
36 |
45 |
37 |
0 |
0 |
8 |
Senegal |
23 |
8 |
0 |
9 |
0 |
0 |
8 |
1 |
Serbia |
0 |
0 |
2 |
2 |
2 |
0 |
0 |
0 |
Singapore |
0 |
0 |
1 |
2 |
0 |
0 |
1 |
0 |
Slovakia |
0 |
0 |
0 |
1 |
0 |
0 |
0 |
0 |
Slovenia |
0 |
0 |
1 |
2 |
1 |
0 |
0 |
0 |
Somalia |
12 |
2 |
1 |
2 |
2 |
0 |
0 |
0 |
South Africa |
45 |
47 |
7 |
96 |
24 |
0 |
27 |
45 |
Spain |
65 |
65 |
2 |
84 |
9 |
0 |
60 |
15 |
Sri Lanka |
5 |
1 |
2 |
4 |
3 |
0 |
0 |
1 |
Sudan |
200 |
131 |
0 |
172 |
16 |
0 |
103 |
52 |
Sweden |
0 |
0 |
0 |
0 |
0 |
0 |
0 |
0 |
Switzerland |
0 |
0 |
0 |
1 |
0 |
0 |
0 |
0 |
Syria |
25 |
30 |
0 |
36 |
14 |
0 |
11 |
11 |
Taiwan |
0 |
0 |
142 |
175 |
142 |
0 |
0 |
33 |
Foreign Agricultural Service/USDA |
17 |
May 2019 |
Office of Global Analysis |
|
|
vk.com/id446425943
Table 05A Cotton Supply and Distribution MY 2019/20 (Continued)
(1000 MT and 1000 HA)
Country |
Area |
Productio |
Imports |
Total |
Use |
Loss |
Exports |
Ending |
|
|
Harvested |
n |
|
Supply |
|
|
|
Stocks |
|
Tajikistan |
180 |
98 |
0 |
166 |
22 |
0 |
87 |
57 |
|
Tanzania |
500 |
87 |
0 |
169 |
38 |
0 |
60 |
71 |
|
Thailand |
1 |
0 |
256 |
300 |
250 |
5 |
0 |
45 |
|
Togo |
185 |
58 |
0 |
74 |
3 |
0 |
54 |
17 |
|
Tunisia |
2 |
2 |
4 |
8 |
7 |
0 |
0 |
1 |
|
Turkey |
540 |
893 |
653 |
1,878 |
1,459 |
0 |
82 |
338 |
|
Turkmenistan |
545 |
250 |
0 |
344 |
152 |
0 |
98 |
93 |
|
Uganda |
75 |
27 |
0 |
49 |
3 |
0 |
24 |
22 |
|
Ukraine |
0 |
0 |
1 |
1 |
1 |
0 |
0 |
0 |
|
United Kingdom |
0 |
0 |
0 |
1 |
0 |
0 |
0 |
0 |
|
United States |
5,075 |
4,790 |
1 |
5,804 |
675 |
34 |
3,701 |
1,393 |
|
Uruguay |
0 |
0 |
0 |
0 |
0 |
0 |
0 |
0 |
|
Uzbekistan |
1,010 |
680 |
0 |
960 |
653 |
0 |
65 |
241 |
|
Venezuela |
15 |
19 |
3 |
26 |
20 |
0 |
0 |
7 |
|
Vietnam |
1 |
1 |
1,655 |
1,936 |
1,655 |
0 |
0 |
281 |
|
Yemen |
18 |
6 |
0 |
7 |
5 |
0 |
1 |
1 |
|
Zambia |
130 |
46 |
0 |
93 |
1 |
0 |
49 |
43 |
|
Zimbabwe |
200 |
41 |
0 |
76 |
7 |
2 |
38 |
29 |
|
|
|
|
|
|
|
|
|
|
|
World |
|
|
|
|
|
|
|
|
|
World |
34,537 |
27,315 |
9,874 |
53,838 |
27,418 |
67 |
9,873 |
16,479 |
|
|
|
|
|
|
|
|
|
|
|
Foreign Agricultural Service/USDA |
18 |
May 2019 |
Office of Global Analysis |
|
|
vk.com/id446425943
Table 06: Cotton Supply and Distribution by Country 2018/19
(1,000 HA and 1000 480-lb. Bales)
Country |
Area |
Productio |
Imports |
Total |
Use |
Loss |
Exports |
Ending |
|
Harvested |
n |
|
Supply |
|
|
|
Stocks |
Afghanistan |
36 |
65 |
0 |
82 |
30 |
0 |
35 |
17 |
Albania |
1 |
1 |
0 |
2 |
1 |
0 |
0 |
1 |
Algeria |
0 |
0 |
30 |
35 |
30 |
0 |
0 |
5 |
Angola |
2 |
5 |
10 |
22 |
15 |
0 |
0 |
7 |
Argentina |
420 |
1,150 |
15 |
1,685 |
625 |
0 |
450 |
610 |
Armenia |
0 |
0 |
0 |
0 |
0 |
0 |
0 |
0 |
Australia |
300 |
2,500 |
0 |
5,539 |
35 |
0 |
4,200 |
1,304 |
Austria |
0 |
0 |
15 |
18 |
15 |
0 |
0 |
3 |
Azerbaijan |
130 |
380 |
0 |
460 |
120 |
0 |
210 |
130 |
Bahrain |
0 |
0 |
40 |
48 |
40 |
0 |
0 |
8 |
Bangladesh |
44 |
135 |
8,000 |
9,990 |
8,000 |
10 |
0 |
1,980 |
Belarus |
0 |
0 |
40 |
44 |
40 |
0 |
0 |
4 |
Belgium-Luxembour |
0 |
0 |
30 |
36 |
20 |
0 |
10 |
6 |
Benin |
650 |
1,400 |
0 |
1,643 |
15 |
0 |
1,325 |
303 |
Bolivia |
4 |
8 |
2 |
15 |
10 |
0 |
0 |
5 |
Brazil |
1,595 |
12,800 |
50 |
21,507 |
3,500 |
0 |
5,800 |
12,207 |
Bulgaria |
2 |
10 |
28 |
46 |
38 |
0 |
0 |
8 |
Burkina |
640 |
920 |
0 |
1,345 |
25 |
0 |
1,100 |
220 |
Burma |
240 |
700 |
75 |
999 |
775 |
0 |
5 |
219 |
Cambodia |
0 |
0 |
1 |
2 |
1 |
0 |
0 |
1 |
Cameroon |
250 |
600 |
0 |
739 |
20 |
0 |
550 |
169 |
Canada |
0 |
0 |
2 |
2 |
2 |
0 |
0 |
0 |
Central African Republic |
32 |
32 |
0 |
44 |
0 |
0 |
32 |
12 |
Chad |
60 |
40 |
0 |
171 |
10 |
0 |
100 |
61 |
Chile |
0 |
0 |
0 |
0 |
0 |
0 |
0 |
0 |
China |
3,500 |
27,750 |
8,500 |
74,269 |
40,500 |
0 |
150 |
33,619 |
Colombia |
9 |
40 |
145 |
216 |
170 |
5 |
5 |
36 |
Congo (Kinshasa) |
30 |
15 |
2 |
21 |
17 |
0 |
0 |
4 |
Costa Rica |
1 |
1 |
45 |
59 |
45 |
0 |
0 |
14 |
Cote d'Ivoire |
392 |
875 |
0 |
1,150 |
25 |
0 |
850 |
275 |
Croatia |
0 |
0 |
0 |
0 |
0 |
0 |
0 |
0 |
Cuba |
4 |
4 |
10 |
16 |
14 |
0 |
0 |
2 |
Cyprus |
0 |
0 |
0 |
0 |
0 |
0 |
0 |
0 |
Czech Republic |
0 |
0 |
8 |
10 |
8 |
0 |
0 |
2 |
Denmark |
0 |
0 |
0 |
0 |
0 |
0 |
0 |
0 |
Foreign Agricultural Service/USDA |
19 |
May 2019 |
Office of Global Analysis |
|
|
vk.com/id446425943
Table 06: Cotton Supply and Distribution by Country 2018/19 (Continued)
(1,000 HA and 1000 480-lb. Bales)
Country |
Area |
Productio |
Imports |
Total |
Use |
Loss |
Exports |
Ending |
|
Harvested |
n |
|
Supply |
|
|
|
Stocks |
Dominican Republic |
4 |
3 |
1 |
5 |
4 |
0 |
0 |
1 |
Ecuador |
3 |
9 |
80 |
107 |
85 |
0 |
0 |
22 |
Egypt |
141 |
500 |
475 |
1,169 |
625 |
10 |
300 |
234 |
El Salvador |
1 |
1 |
175 |
213 |
170 |
0 |
0 |
43 |
Estonia |
0 |
0 |
10 |
12 |
10 |
0 |
0 |
2 |
Ethiopia |
65 |
175 |
60 |
328 |
240 |
0 |
0 |
88 |
France |
0 |
0 |
40 |
51 |
40 |
0 |
3 |
8 |
Germany |
0 |
0 |
120 |
144 |
100 |
0 |
20 |
24 |
Ghana |
16 |
28 |
0 |
36 |
10 |
0 |
15 |
11 |
Greece |
245 |
1,410 |
25 |
1,504 |
90 |
50 |
1,250 |
114 |
Guatemala |
2 |
3 |
130 |
161 |
135 |
0 |
0 |
26 |
Guinea |
12 |
14 |
0 |
17 |
0 |
0 |
14 |
3 |
Haiti |
7 |
5 |
5 |
11 |
10 |
0 |
0 |
1 |
Honduras |
2 |
4 |
20 |
29 |
24 |
0 |
0 |
5 |
Hong Kong |
0 |
0 |
0 |
0 |
0 |
0 |
0 |
0 |
Hungary |
0 |
0 |
3 |
3 |
0 |
0 |
3 |
0 |
India |
12,250 |
25,500 |
1,400 |
36,125 |
24,800 |
0 |
4,200 |
7,125 |
Indonesia |
3 |
3 |
3,200 |
3,818 |
3,200 |
0 |
5 |
613 |
Iran |
80 |
275 |
300 |
720 |
575 |
0 |
0 |
145 |
Iraq |
10 |
15 |
35 |
73 |
50 |
0 |
0 |
23 |
Ireland |
0 |
0 |
0 |
0 |
0 |
0 |
0 |
0 |
Israel |
6 |
45 |
2 |
66 |
4 |
0 |
50 |
12 |
Italy |
0 |
0 |
170 |
192 |
165 |
0 |
5 |
22 |
Japan |
0 |
0 |
225 |
264 |
230 |
0 |
0 |
34 |
Kazakhstan |
128 |
330 |
0 |
468 |
65 |
0 |
275 |
128 |
Kenya |
30 |
25 |
15 |
58 |
40 |
0 |
0 |
18 |
Korea, North |
19 |
55 |
95 |
205 |
150 |
0 |
0 |
55 |
Korea, South |
0 |
0 |
800 |
987 |
825 |
0 |
5 |
157 |
Kyrgyzstan |
18 |
105 |
0 |
120 |
0 |
0 |
100 |
20 |
Latvia |
0 |
0 |
7 |
9 |
6 |
0 |
1 |
2 |
Lebanon |
0 |
0 |
5 |
6 |
5 |
0 |
0 |
1 |
Lesotho |
0 |
0 |
85 |
110 |
85 |
0 |
0 |
25 |
Lithuania |
0 |
0 |
0 |
0 |
0 |
0 |
0 |
0 |
Macedonia |
0 |
0 |
5 |
6 |
5 |
0 |
0 |
1 |
Madagascar |
20 |
30 |
0 |
45 |
20 |
0 |
10 |
15 |
Foreign Agricultural Service/USDA |
20 |
May 2019 |
Office of Global Analysis |
|
|
vk.com/id446425943
Table 06: Cotton Supply and Distribution by Country 2018/19 (Continued)
(1,000 HA and 1000 480-lb. Bales)
Country |
Area |
Productio |
Imports |
Total |
Use |
Loss |
Exports |
Ending |
|
Harvested |
n |
|
Supply |
|
|
|
Stocks |
Malawi |
70 |
90 |
0 |
134 |
5 |
0 |
50 |
79 |
Malaysia |
0 |
0 |
650 |
1,115 |
350 |
0 |
300 |
465 |
Mali |
720 |
1,260 |
0 |
1,836 |
25 |
0 |
1,300 |
511 |
Mauritius |
0 |
0 |
120 |
141 |
120 |
0 |
0 |
21 |
Mexico |
238 |
1,690 |
850 |
3,195 |
1,950 |
25 |
500 |
720 |
Moldova |
0 |
0 |
60 |
72 |
60 |
0 |
0 |
12 |
Morocco |
1 |
1 |
45 |
58 |
45 |
0 |
0 |
13 |
Mozambique |
125 |
130 |
0 |
200 |
5 |
0 |
110 |
85 |
Netherlands |
0 |
0 |
16 |
17 |
15 |
0 |
0 |
2 |
Nicaragua |
4 |
10 |
0 |
12 |
1 |
0 |
9 |
2 |
Niger |
5 |
9 |
0 |
14 |
3 |
0 |
6 |
5 |
Nigeria |
270 |
235 |
10 |
299 |
200 |
0 |
30 |
69 |
Pakistan |
2,400 |
7,700 |
3,000 |
13,530 |
10,600 |
25 |
125 |
2,780 |
Panama |
0 |
0 |
0 |
0 |
0 |
0 |
0 |
0 |
Paraguay |
11 |
21 |
5 |
33 |
12 |
0 |
13 |
8 |
Peru |
17 |
80 |
250 |
413 |
325 |
0 |
5 |
83 |
Philippines |
1 |
2 |
65 |
79 |
65 |
0 |
0 |
14 |
Poland |
0 |
0 |
12 |
15 |
12 |
0 |
0 |
3 |
Portugal |
0 |
0 |
180 |
221 |
180 |
0 |
3 |
38 |
Romania |
0 |
0 |
1 |
2 |
1 |
0 |
0 |
1 |
Russia |
0 |
0 |
180 |
221 |
180 |
0 |
0 |
41 |
Senegal |
21 |
29 |
0 |
32 |
2 |
0 |
25 |
5 |
Serbia |
0 |
0 |
8 |
10 |
8 |
0 |
0 |
2 |
Singapore |
0 |
0 |
5 |
7 |
0 |
0 |
5 |
2 |
Slovakia |
0 |
0 |
2 |
2 |
1 |
0 |
0 |
1 |
Slovenia |
0 |
0 |
6 |
8 |
6 |
0 |
0 |
2 |
Somalia |
12 |
7 |
3 |
11 |
10 |
0 |
0 |
1 |
South Africa |
44 |
219 |
35 |
411 |
105 |
0 |
110 |
196 |
Spain |
65 |
300 |
10 |
365 |
40 |
0 |
250 |
75 |
Sri Lanka |
5 |
5 |
8 |
17 |
13 |
0 |
0 |
4 |
Sudan |
180 |
500 |
0 |
639 |
75 |
0 |
375 |
189 |
Sweden |
0 |
0 |
0 |
0 |
0 |
0 |
0 |
0 |
Switzerland |
0 |
0 |
2 |
3 |
2 |
0 |
0 |
1 |
Syria |
25 |
140 |
0 |
179 |
65 |
0 |
90 |
24 |
Taiwan |
0 |
0 |
650 |
802 |
650 |
0 |
0 |
152 |
Foreign Agricultural Service/USDA |
21 |
May 2019 |
Office of Global Analysis |
|
|
vk.com/id446425943
Table 06: Cotton Supply and Distribution by Country 2018/19 (Continued)
(1,000 HA and 1000 480-lb. Bales)
Country |
Area |
Productio |
Imports |
Total |
Use |
Loss |
Exports |
Ending |
|
|
Harvested |
n |
|
Supply |
|
|
|
Stocks |
|
Tajikistan |
180 |
450 |
0 |
746 |
85 |
0 |
350 |
311 |
|
Tanzania |
500 |
425 |
0 |
675 |
175 |
0 |
125 |
375 |
|
Thailand |
1 |
2 |
1,175 |
1,378 |
1,150 |
25 |
0 |
203 |
|
Togo |
185 |
240 |
0 |
302 |
15 |
0 |
210 |
77 |
|
Tunisia |
2 |
10 |
20 |
35 |
30 |
0 |
0 |
5 |
|
Turkey |
520 |
3,700 |
3,000 |
8,477 |
6,500 |
0 |
450 |
1,527 |
|
Turkmenistan |
545 |
910 |
0 |
1,554 |
675 |
0 |
450 |
429 |
|
Uganda |
75 |
120 |
0 |
225 |
15 |
0 |
110 |
100 |
|
Ukraine |
0 |
0 |
5 |
6 |
5 |
0 |
0 |
1 |
|
United Kingdom |
0 |
0 |
2 |
3 |
2 |
0 |
0 |
1 |
|
United States |
4,130 |
18,367 |
5 |
22,672 |
3,100 |
172 |
14,750 |
4,650 |
|
Uruguay |
0 |
0 |
0 |
0 |
0 |
0 |
0 |
0 |
|
Uzbekistan |
1,100 |
3,300 |
0 |
4,833 |
2,750 |
0 |
800 |
1,283 |
|
Venezuela |
15 |
85 |
12 |
120 |
100 |
0 |
0 |
20 |
|
Vietnam |
1 |
3 |
7,100 |
8,288 |
7,000 |
0 |
0 |
1,288 |
|
Yemen |
18 |
28 |
0 |
33 |
25 |
0 |
2 |
6 |
|
Zambia |
125 |
200 |
0 |
448 |
5 |
0 |
225 |
218 |
|
Zimbabwe |
200 |
200 |
0 |
374 |
30 |
10 |
175 |
159 |
|
|
|
|
|
|
|
|
|
|
|
World |
|
|
|
|
|
|
|
|
|
World |
33,215 |
118,434 |
42,028 |
241,539 |
122,707 |
332 |
42,031 |
76,469 |
|
|
|
|
|
|
|
|
|
|
|
Foreign Agricultural Service/USDA |
22 |
May 2019 |
Office of Global Analysis |
|
|
vk.com/id446425943
|
Table 06A: Cotton Supply and Distribution by Country 2018/19 |
||||||
|
|
|
(1,000 Metric Tons) |
|
|
|
|
|
|
|
|
|
|
|
|
Country |
Area |
Productio |
Imports |
Use |
Loss |
Exports |
Ending |
|
Harvested |
n |
|
|
|
|
Stocks |
Afghanistan |
36 |
14 |
0 |
7 |
0 |
8 |
4 |
Albania |
1 |
0 |
0 |
0 |
0 |
0 |
0 |
Algeria |
0 |
0 |
7 |
7 |
0 |
0 |
1 |
Angola |
2 |
1 |
2 |
3 |
0 |
0 |
2 |
Argentina |
420 |
250 |
3 |
136 |
0 |
98 |
133 |
Armenia |
0 |
0 |
0 |
0 |
0 |
0 |
0 |
Australia |
300 |
544 |
0 |
8 |
0 |
914 |
284 |
Austria |
0 |
0 |
3 |
3 |
0 |
0 |
1 |
Azerbaijan |
130 |
83 |
0 |
26 |
0 |
46 |
28 |
Bahrain |
0 |
0 |
9 |
9 |
0 |
0 |
2 |
Bangladesh |
44 |
29 |
1,742 |
1,742 |
2 |
0 |
431 |
Belarus |
0 |
0 |
9 |
9 |
0 |
0 |
1 |
Belgium-Luxembour |
0 |
0 |
7 |
4 |
0 |
2 |
1 |
Benin |
650 |
305 |
0 |
3 |
0 |
288 |
66 |
Bolivia |
4 |
2 |
0 |
2 |
0 |
0 |
1 |
Brazil |
1,595 |
2,787 |
11 |
762 |
0 |
1,263 |
2,658 |
Bulgaria |
2 |
2 |
6 |
8 |
0 |
0 |
2 |
Burkina |
640 |
200 |
0 |
5 |
0 |
239 |
48 |
Burma |
240 |
152 |
16 |
169 |
0 |
1 |
48 |
Cambodia |
0 |
0 |
0 |
0 |
0 |
0 |
0 |
Cameroon |
250 |
131 |
0 |
4 |
0 |
120 |
37 |
Canada |
0 |
0 |
0 |
0 |
0 |
0 |
0 |
Central African Republic |
32 |
7 |
0 |
0 |
0 |
7 |
3 |
Chad |
60 |
9 |
0 |
2 |
0 |
22 |
13 |
Chile |
0 |
0 |
0 |
0 |
0 |
0 |
0 |
China |
3,500 |
6,042 |
1,851 |
8,818 |
0 |
33 |
7,320 |
Colombia |
9 |
9 |
32 |
37 |
1 |
1 |
8 |
Congo (Kinshasa) |
30 |
3 |
0 |
4 |
0 |
0 |
1 |
Costa Rica |
1 |
0 |
10 |
10 |
0 |
0 |
3 |
Cote d'Ivoire |
392 |
191 |
0 |
5 |
0 |
185 |
60 |
Croatia |
0 |
0 |
0 |
0 |
0 |
0 |
0 |
Cuba |
4 |
1 |
2 |
3 |
0 |
0 |
0 |
Cyprus |
0 |
0 |
0 |
0 |
0 |
0 |
0 |
Czech Republic |
0 |
0 |
2 |
2 |
0 |
0 |
0 |
Denmark |
0 |
0 |
0 |
0 |
0 |
0 |
0 |
Foreign Agricultural Service/USDA |
23 |
May 2019 |
Office of Global Analysis |
|
|
vk.com/id446425943
|
Table 06A: Cotton Supply and Distribution by Country 2018/19 (Continued) |
||||||
|
|
|
(1,000 Metric Tons) |
|
|
|
|
|
|
|
|
|
|
|
|
Country |
Area |
Productio |
Imports |
Use |
Loss |
Exports |
Ending |
|
Harvested |
n |
|
|
|
|
Stocks |
Dominican Republic |
4 |
1 |
0 |
1 |
0 |
0 |
0 |
Ecuador |
3 |
2 |
17 |
19 |
0 |
0 |
5 |
Egypt |
141 |
109 |
103 |
136 |
2 |
65 |
51 |
El Salvador |
1 |
0 |
38 |
37 |
0 |
0 |
9 |
Estonia |
0 |
0 |
2 |
2 |
0 |
0 |
0 |
Ethiopia |
65 |
38 |
13 |
52 |
0 |
0 |
19 |
France |
0 |
0 |
9 |
9 |
0 |
1 |
2 |
Germany |
0 |
0 |
26 |
22 |
0 |
4 |
5 |
Ghana |
16 |
6 |
0 |
2 |
0 |
3 |
2 |
Greece |
245 |
307 |
5 |
20 |
11 |
272 |
25 |
Guatemala |
2 |
1 |
28 |
29 |
0 |
0 |
6 |
Guinea |
12 |
3 |
0 |
0 |
0 |
3 |
1 |
Haiti |
7 |
1 |
1 |
2 |
0 |
0 |
0 |
Honduras |
2 |
1 |
4 |
5 |
0 |
0 |
1 |
Hong Kong |
0 |
0 |
0 |
0 |
0 |
0 |
0 |
Hungary |
0 |
0 |
1 |
0 |
0 |
1 |
0 |
India |
12,250 |
5,552 |
305 |
5,400 |
0 |
914 |
1,551 |
Indonesia |
3 |
1 |
697 |
697 |
0 |
1 |
133 |
Iran |
80 |
60 |
65 |
125 |
0 |
0 |
32 |
Iraq |
10 |
3 |
8 |
11 |
0 |
0 |
5 |
Ireland |
0 |
0 |
0 |
0 |
0 |
0 |
0 |
Israel |
6 |
10 |
0 |
1 |
0 |
11 |
3 |
Italy |
0 |
0 |
37 |
36 |
0 |
1 |
5 |
Japan |
0 |
0 |
49 |
50 |
0 |
0 |
7 |
Kazakhstan |
128 |
72 |
0 |
14 |
0 |
60 |
28 |
Kenya |
30 |
5 |
3 |
9 |
0 |
0 |
4 |
Korea, North |
19 |
12 |
21 |
33 |
0 |
0 |
12 |
Korea, South |
0 |
0 |
174 |
180 |
0 |
1 |
34 |
Kyrgyzstan |
18 |
23 |
0 |
0 |
0 |
22 |
4 |
Latvia |
0 |
0 |
2 |
1 |
0 |
0 |
0 |
Lebanon |
0 |
0 |
1 |
1 |
0 |
0 |
0 |
Lesotho |
0 |
0 |
19 |
19 |
0 |
0 |
5 |
Lithuania |
0 |
0 |
0 |
0 |
0 |
0 |
0 |
Macedonia |
0 |
0 |
1 |
1 |
0 |
0 |
0 |
Madagascar |
20 |
7 |
0 |
4 |
0 |
2 |
3 |
Foreign Agricultural Service/USDA |
24 |
May 2019 |
Office of Global Analysis |
|
|
vk.com/id446425943
|
Table 06A: Cotton Supply and Distribution by Country 2018/19 (Continued) |
||||||
|
|
|
(1,000 Metric Tons) |
|
|
|
|
|
|
|
|
|
|
|
|
Country |
Area |
Productio |
Imports |
Use |
Loss |
Exports |
Ending |
|
Harvested |
n |
|
|
|
|
Stocks |
Malawi |
70 |
20 |
0 |
1 |
0 |
11 |
17 |
Malaysia |
0 |
0 |
142 |
76 |
0 |
65 |
101 |
Mali |
720 |
274 |
0 |
5 |
0 |
283 |
111 |
Mauritius |
0 |
0 |
26 |
26 |
0 |
0 |
5 |
Mexico |
238 |
368 |
185 |
425 |
5 |
109 |
157 |
Moldova |
0 |
0 |
13 |
13 |
0 |
0 |
3 |
Morocco |
1 |
0 |
10 |
10 |
0 |
0 |
3 |
Mozambique |
125 |
28 |
0 |
1 |
0 |
24 |
19 |
Netherlands |
0 |
0 |
3 |
3 |
0 |
0 |
0 |
Nicaragua |
4 |
2 |
0 |
0 |
0 |
2 |
0 |
Niger |
5 |
2 |
0 |
1 |
0 |
1 |
1 |
Nigeria |
270 |
51 |
2 |
44 |
0 |
7 |
15 |
Pakistan |
2,400 |
1,676 |
653 |
2,308 |
5 |
27 |
605 |
Panama |
0 |
0 |
0 |
0 |
0 |
0 |
0 |
Paraguay |
11 |
5 |
1 |
3 |
0 |
3 |
2 |
Peru |
17 |
17 |
54 |
71 |
0 |
1 |
18 |
Philippines |
1 |
0 |
14 |
14 |
0 |
0 |
3 |
Poland |
0 |
0 |
3 |
3 |
0 |
0 |
1 |
Portugal |
0 |
0 |
39 |
39 |
0 |
1 |
8 |
Romania |
0 |
0 |
0 |
0 |
0 |
0 |
0 |
Russia |
0 |
0 |
39 |
39 |
0 |
0 |
9 |
Senegal |
21 |
6 |
0 |
0 |
0 |
5 |
1 |
Serbia |
0 |
0 |
2 |
2 |
0 |
0 |
0 |
Singapore |
0 |
0 |
1 |
0 |
0 |
1 |
0 |
Slovakia |
0 |
0 |
0 |
0 |
0 |
0 |
0 |
Slovenia |
0 |
0 |
1 |
1 |
0 |
0 |
0 |
Somalia |
12 |
2 |
1 |
2 |
0 |
0 |
0 |
South Africa |
44 |
48 |
8 |
23 |
0 |
24 |
43 |
Spain |
65 |
65 |
2 |
9 |
0 |
54 |
16 |
Sri Lanka |
5 |
1 |
2 |
3 |
0 |
0 |
1 |
Sudan |
180 |
109 |
0 |
16 |
0 |
82 |
41 |
Sweden |
0 |
0 |
0 |
0 |
0 |
0 |
0 |
Switzerland |
0 |
0 |
0 |
0 |
0 |
0 |
0 |
Syria |
25 |
30 |
0 |
14 |
0 |
20 |
5 |
Taiwan |
0 |
0 |
142 |
142 |
0 |
0 |
33 |
Foreign Agricultural Service/USDA |
25 |
May 2019 |
Office of Global Analysis |
|
|
vk.com/id446425943
|
Table 06A: Cotton Supply and Distribution by Country 2018/19 (Continued) |
||||||||
|
|
|
(1,000 Metric Tons) |
|
|
|
|
|
|
|
|
|
|
|
|
|
|
|
|
Country |
Area |
Productio |
Imports |
Use |
Loss |
|
Exports |
Ending |
|
|
Harvested |
n |
|
|
|
|
|
Stocks |
|
Tajikistan |
180 |
98 |
0 |
19 |
|
0 |
76 |
68 |
|
Tanzania |
500 |
93 |
0 |
38 |
|
0 |
27 |
82 |
|
Thailand |
1 |
0 |
256 |
250 |
|
5 |
0 |
44 |
|
Togo |
185 |
52 |
0 |
3 |
|
0 |
46 |
17 |
|
Tunisia |
2 |
2 |
4 |
7 |
|
0 |
0 |
1 |
|
Turkey |
520 |
806 |
653 |
1,415 |
|
0 |
98 |
332 |
|
Turkmenistan |
545 |
198 |
0 |
147 |
|
0 |
98 |
93 |
|
Uganda |
75 |
26 |
0 |
3 |
|
0 |
24 |
22 |
|
Ukraine |
0 |
0 |
1 |
1 |
|
0 |
0 |
0 |
|
United Kingdom |
0 |
0 |
0 |
0 |
|
0 |
0 |
0 |
|
United States |
4,130 |
3,999 |
1 |
675 |
|
37 |
3,211 |
1,012 |
|
Uruguay |
0 |
0 |
0 |
0 |
|
0 |
0 |
0 |
|
Uzbekistan |
1,100 |
718 |
0 |
599 |
|
0 |
174 |
279 |
|
Venezuela |
15 |
19 |
3 |
22 |
|
0 |
0 |
4 |
|
Vietnam |
1 |
1 |
1,546 |
1,524 |
|
0 |
0 |
280 |
|
Yemen |
18 |
6 |
0 |
5 |
|
0 |
0 |
1 |
|
Zambia |
125 |
44 |
0 |
1 |
|
0 |
49 |
47 |
|
Zimbabwe |
200 |
44 |
0 |
7 |
|
2 |
38 |
35 |
|
|
|
|
|
|
|
|
|
|
|
World |
|
|
|
|
|
|
|
|
|
World |
33,215 |
25,786 |
9,151 |
26,717 |
|
72 |
9,151 |
16,649 |
|
|
|
|
|
|
|
|
|
|
|
Foreign Agricultural Service/USDA |
26 |
May 2019 |
Office of Global Analysis |
|
|
vk.com/id446425943
Table 09: World Cotton Supply and Distribution
(1,000 HA and 1000 480-lb. Bales)
Country Mktg |
Beginning |
Area |
Production |
Imports |
Total |
Exports |
Use |
Loss |
Total Dom. |
Ending |
Stock to |
Year |
Stocks |
Harvested |
|
|
Supply |
|
|
|
Cons. |
Stocks |
Use % |
|
|
|
|
|
|
|
|
|
|
|
|
|
|
|
|
|
|
|
|
|
|
|
|
World |
|
|
|
|
|
|
|
|
|
|
|
1988/89 |
32,614 |
33,831 |
84,222 |
33,582 |
150,418 |
33,481 |
85,238 |
642 |
85,880 |
31,057 |
36 |
1989/90 |
31,057 |
31,696 |
79,720 |
32,703 |
143,480 |
31,357 |
86,905 |
234 |
87,139 |
24,984 |
29 |
1990/91 |
24,984 |
33,153 |
87,165 |
30,578 |
142,727 |
29,560 |
85,524 |
170 |
85,694 |
27,473 |
32 |
1991/92 |
27,473 |
34,758 |
95,234 |
29,024 |
151,731 |
28,204 |
86,188 |
368 |
86,556 |
36,971 |
43 |
1992/93 |
36,971 |
32,643 |
82,307 |
27,067 |
146,345 |
25,435 |
86,337 |
63 |
86,400 |
34,510 |
40 |
1993/94 |
34,510 |
30,718 |
77,679 |
27,967 |
140,156 |
26,620 |
85,560 |
143 |
85,703 |
27,833 |
33 |
1994/95 |
27,833 |
32,250 |
86,297 |
30,300 |
144,430 |
28,118 |
84,622 |
-330 |
84,292 |
32,020 |
38 |
1995/96 |
32,020 |
35,920 |
93,903 |
27,004 |
152,927 |
27,396 |
85,940 |
-544 |
85,396 |
40,135 |
47 |
1996/97 |
40,135 |
33,740 |
90,053 |
28,579 |
158,767 |
26,777 |
87,936 |
-585 |
87,351 |
44,639 |
51 |
1997/98 |
44,639 |
33,797 |
92,368 |
25,929 |
162,936 |
26,777 |
87,267 |
-581 |
86,686 |
49,473 |
57 |
1998/99 |
49,473 |
32,885 |
86,073 |
24,480 |
160,026 |
23,517 |
84,765 |
-1,114 |
83,651 |
52,858 |
62 |
1999/00 |
52,858 |
32,350 |
87,909 |
27,993 |
168,760 |
27,126 |
91,092 |
-602 |
90,490 |
51,144 |
56 |
2000/01 |
51,144 |
32,011 |
89,089 |
26,209 |
166,442 |
26,156 |
92,148 |
-1,424 |
90,724 |
49,562 |
54 |
2001/02 |
49,562 |
33,717 |
98,503 |
29,297 |
177,362 |
29,081 |
94,382 |
-781 |
93,601 |
54,680 |
58 |
2002/03 |
54,680 |
30,779 |
91,022 |
30,188 |
175,890 |
30,400 |
98,412 |
-804 |
97,608 |
47,882 |
49 |
2003/04 |
47,882 |
32,258 |
96,675 |
34,150 |
178,707 |
33,152 |
98,088 |
-909 |
97,179 |
48,376 |
49 |
2004/05 |
48,376 |
35,759 |
121,545 |
33,965 |
203,886 |
34,949 |
109,205 |
-1,245 |
107,960 |
60,977 |
56 |
2005/06 |
60,977 |
34,494 |
116,361 |
44,668 |
222,006 |
44,922 |
116,971 |
-1,793 |
115,178 |
61,906 |
53 |
2006/07 |
61,906 |
34,705 |
122,685 |
38,305 |
222,896 |
37,416 |
124,208 |
-1,715 |
122,493 |
62,987 |
51 |
2007/08 |
62,987 |
32,878 |
120,049 |
39,453 |
222,489 |
38,868 |
123,837 |
-2,094 |
121,743 |
61,878 |
50 |
2008/09 |
61,878 |
30,622 |
108,069 |
30,573 |
200,520 |
30,207 |
110,296 |
-1,436 |
108,860 |
61,453 |
56 |
2009/10 |
61,453 |
30,187 |
103,084 |
36,928 |
201,465 |
35,804 |
119,494 |
-12 |
119,482 |
46,179 |
39 |
2010/11 |
46,179 |
33,716 |
117,298 |
36,297 |
199,774 |
34,900 |
115,492 |
119 |
115,611 |
49,263 |
43 |
2011/12 |
49,263 |
36,056 |
127,243 |
45,423 |
221,929 |
45,874 |
104,116 |
-210 |
103,906 |
72,149 |
69 |
2012/13 |
72,149 |
34,116 |
123,891 |
47,630 |
243,670 |
46,435 |
108,243 |
-343 |
107,900 |
89,335 |
83 |
2013/14 |
89,335 |
32,605 |
120,356 |
41,204 |
250,895 |
40,947 |
109,906 |
92 |
109,998 |
99,950 |
91 |
2014/15 |
99,950 |
33,916 |
119,219 |
36,065 |
255,234 |
35,893 |
112,231 |
268 |
112,499 |
106,842 |
95 |
2015/16 |
106,842 |
30,751 |
96,156 |
35,444 |
238,442 |
34,651 |
113,237 |
264 |
113,501 |
90,290 |
80 |
2016/17 |
90,290 |
29,813 |
106,681 |
37,696 |
234,667 |
37,861 |
116,182 |
206 |
116,388 |
80,418 |
69 |
2017/18 |
80,418 |
33,577 |
123,782 |
41,048 |
245,248 |
40,928 |
122,769 |
474 |
123,243 |
81,077 |
66 |
2018/19 |
81,077 |
33,215 |
118,434 |
42,028 |
241,539 |
42,031 |
122,707 |
332 |
123,039 |
76,469 |
62 |
2019/20 |
76,469 |
34,537 |
125,454 |
45,351 |
247,274 |
45,348 |
125,928 |
310 |
126,238 |
75,688 |
60 |
|
|
|
|
|
|
|
|
|
|
|
|
Foreign Agricultural Service/USDA |
27 |
May 2019 |
Office of Global Analysis |
|
|
vk.com/id446425943
Table 10: United States Cotton Supply and Distribution
(1,000 HA and 1000 480-lb. Bales)
Country Mktg |
Area |
Yield |
Beginning |
Production |
Imports |
Total |
Exports |
Use |
Loss |
Ending |
Stock to |
Year |
Harvested |
|
Stocks |
|
|
Supply |
|
|
|
Stocks |
Use % |
|
|
|
|
|
|
|
|
|
|
|
|
United States |
|
|
|
|
|
|
|
|
|
|
|
1988/89 |
4,835 |
694 |
5,771 |
15,411 |
5 |
21,187 |
6,148 |
7,782 |
165 |
7,092 |
51 |
1989/90 |
3,860 |
688 |
7,092 |
12,196 |
2 |
19,290 |
7,694 |
8,759 |
-163 |
3,000 |
18 |
1990/91 |
4,748 |
711 |
3,000 |
15,505 |
4 |
18,509 |
7,793 |
8,657 |
-285 |
2,344 |
14 |
1991/92 |
5,245 |
731 |
2,344 |
17,614 |
13 |
19,971 |
6,646 |
9,613 |
8 |
3,704 |
23 |
1992/93 |
4,501 |
785 |
3,704 |
16,218 |
1 |
19,923 |
5,201 |
10,250 |
-190 |
4,662 |
30 |
1993/94 |
5,173 |
679 |
4,662 |
16,134 |
6 |
20,802 |
6,862 |
10,418 |
-8 |
3,530 |
20 |
1994/95 |
5,391 |
794 |
3,530 |
19,662 |
20 |
23,212 |
9,402 |
11,198 |
-38 |
2,650 |
13 |
1995/96 |
6,478 |
602 |
2,650 |
17,900 |
408 |
20,958 |
7,675 |
10,647 |
27 |
2,609 |
14 |
1996/97 |
5,216 |
791 |
2,609 |
18,942 |
403 |
21,954 |
6,865 |
11,126 |
-8 |
3,971 |
22 |
1997/98 |
5,425 |
754 |
3,971 |
18,793 |
13 |
22,777 |
7,500 |
11,349 |
41 |
3,887 |
21 |
1998/99 |
4,324 |
701 |
3,887 |
13,918 |
439 |
18,244 |
4,298 |
10,401 |
-394 |
3,939 |
27 |
1999/00 |
5,433 |
680 |
3,939 |
16,968 |
97 |
21,004 |
6,750 |
10,194 |
145 |
3,915 |
23 |
2000/01 |
5,282 |
708 |
3,915 |
17,188 |
16 |
21,119 |
6,740 |
8,862 |
-483 |
6,000 |
38 |
2001/02 |
5,596 |
790 |
6,000 |
20,303 |
21 |
26,324 |
11,000 |
7,696 |
180 |
7,448 |
40 |
2002/03 |
5,025 |
746 |
7,448 |
17,209 |
67 |
24,724 |
11,900 |
7,273 |
166 |
5,385 |
28 |
2003/04 |
4,858 |
818 |
5,385 |
18,255 |
45 |
23,685 |
13,758 |
6,266 |
211 |
3,450 |
17 |
2004/05 |
5,284 |
958 |
3,450 |
23,251 |
29 |
26,730 |
14,436 |
6,691 |
108 |
5,495 |
26 |
2005/06 |
5,586 |
931 |
5,495 |
23,890 |
28 |
29,413 |
17,673 |
5,871 |
-200 |
6,069 |
26 |
2006/07 |
5,152 |
912 |
6,069 |
21,588 |
19 |
27,676 |
12,959 |
4,935 |
303 |
9,479 |
53 |
2007/08 |
4,245 |
985 |
9,479 |
19,207 |
12 |
28,698 |
13,634 |
4,584 |
429 |
10,051 |
55 |
2008/09 |
3,063 |
912 |
10,051 |
12,825 |
0 |
22,876 |
13,261 |
3,541 |
-263 |
6,337 |
38 |
2009/10 |
3,049 |
870 |
6,337 |
12,183 |
0 |
18,520 |
12,037 |
3,550 |
-14 |
2,947 |
19 |
2010/11 |
4,330 |
910 |
2,947 |
18,102 |
9 |
21,058 |
14,376 |
3,900 |
182 |
2,600 |
14 |
2011/12 |
3,829 |
886 |
2,600 |
15,573 |
19 |
18,192 |
11,714 |
3,300 |
-172 |
3,350 |
22 |
2012/13 |
3,772 |
999 |
3,350 |
17,314 |
10 |
20,674 |
13,026 |
3,500 |
348 |
3,800 |
23 |
2013/14 |
3,051 |
921 |
3,800 |
12,909 |
13 |
16,722 |
10,530 |
3,550 |
292 |
2,350 |
17 |
2014/15 |
3,785 |
939 |
2,350 |
16,319 |
12 |
18,681 |
11,246 |
3,575 |
210 |
3,650 |
25 |
2015/16 |
3,268 |
859 |
3,650 |
12,888 |
33 |
16,571 |
9,153 |
3,450 |
168 |
3,800 |
30 |
2016/17 |
3,848 |
972 |
3,800 |
17,170 |
7 |
20,977 |
14,917 |
3,250 |
60 |
2,750 |
15 |
2017/18 |
4,492 |
1,014 |
2,750 |
20,923 |
3 |
23,676 |
15,847 |
3,225 |
304 |
4,300 |
23 |
2018/19 |
4,130 |
968 |
4,300 |
18,367 |
5 |
22,672 |
14,750 |
3,100 |
172 |
4,650 |
26 |
2019/20 |
5,075 |
944 |
4,650 |
22,000 |
5 |
26,655 |
17,000 |
3,100 |
155 |
6,400 |
32 |
|
|
|
|
|
|
|
|
|
|
|
|
Foreign Agricultural Service/USDA |
28 |
May 2019 |
Office of Global Analysis |
|
|
vk.com/id446425943
Table 11: Foreign Cotton Supply and Distribution
(1,000 HA and 1000 480-lb. Bales)
Country Mktg |
Area |
Yield |
Beginning |
Production |
Imports |
Total |
Exports |
Use |
Loss |
Ending |
Year |
Harvested |
|
Stocks |
|
|
Supply |
|
|
|
Stocks |
|
|
|
|
|
|
|
|
|
|
|
Total Foreign |
|
|
|
|
|
|
|
|
|
|
1988/89 |
28,996 |
517 |
26,843 |
68,811 |
33,577 |
129,231 |
27,333 |
77,456 |
477 |
23,965 |
1989/90 |
27,836 |
528 |
23,965 |
67,524 |
32,701 |
124,190 |
23,663 |
78,146 |
397 |
21,984 |
1990/91 |
28,405 |
549 |
21,984 |
71,660 |
30,574 |
124,218 |
21,767 |
76,867 |
455 |
25,129 |
1991/92 |
29,513 |
573 |
25,129 |
77,620 |
29,011 |
131,760 |
21,558 |
76,575 |
360 |
33,267 |
1992/93 |
28,142 |
511 |
33,267 |
66,089 |
27,066 |
126,422 |
20,234 |
76,087 |
253 |
29,848 |
1993/94 |
25,545 |
525 |
29,848 |
61,545 |
27,961 |
119,354 |
19,758 |
75,142 |
151 |
24,303 |
1994/95 |
26,859 |
540 |
24,303 |
66,635 |
30,280 |
121,218 |
18,716 |
73,424 |
-292 |
29,370 |
1995/96 |
29,442 |
562 |
29,370 |
76,003 |
26,596 |
131,969 |
19,721 |
75,293 |
-571 |
37,526 |
1996/97 |
28,524 |
543 |
37,526 |
71,111 |
28,176 |
136,813 |
19,912 |
76,810 |
-577 |
40,668 |
1997/98 |
28,372 |
565 |
40,668 |
73,575 |
25,916 |
140,159 |
19,277 |
75,918 |
-622 |
45,586 |
1998/99 |
28,561 |
550 |
45,586 |
72,155 |
24,041 |
141,782 |
19,219 |
74,364 |
-720 |
48,919 |
1999/00 |
26,917 |
574 |
48,919 |
70,941 |
27,896 |
147,756 |
20,376 |
80,898 |
-747 |
47,229 |
2000/01 |
26,729 |
586 |
47,229 |
71,901 |
26,193 |
145,323 |
19,416 |
83,286 |
-941 |
43,562 |
2001/02 |
28,121 |
605 |
43,562 |
78,200 |
29,276 |
151,038 |
18,081 |
86,686 |
-961 |
47,232 |
2002/03 |
25,754 |
624 |
47,232 |
73,813 |
30,121 |
151,166 |
18,500 |
91,139 |
-970 |
42,497 |
2003/04 |
27,400 |
623 |
42,497 |
78,420 |
34,105 |
155,022 |
19,394 |
91,822 |
-1,120 |
44,926 |
2004/05 |
30,475 |
702 |
44,926 |
98,294 |
33,936 |
177,156 |
20,513 |
102,514 |
-1,353 |
55,482 |
2005/06 |
28,908 |
696 |
55,482 |
92,471 |
44,640 |
192,593 |
27,249 |
111,100 |
-1,593 |
55,837 |
2006/07 |
29,553 |
745 |
55,837 |
101,097 |
38,286 |
195,220 |
24,457 |
119,273 |
-2,018 |
53,508 |
2007/08 |
28,633 |
767 |
53,508 |
100,842 |
39,441 |
193,791 |
25,234 |
119,253 |
-2,523 |
51,827 |
2008/09 |
27,559 |
752 |
51,827 |
95,244 |
30,573 |
177,644 |
16,946 |
106,755 |
-1,173 |
55,116 |
2009/10 |
27,138 |
729 |
55,116 |
90,901 |
36,928 |
182,945 |
23,767 |
115,944 |
2 |
43,232 |
2010/11 |
29,386 |
735 |
43,232 |
99,196 |
36,288 |
178,716 |
20,524 |
111,592 |
-63 |
46,663 |
2011/12 |
32,227 |
754 |
46,663 |
111,670 |
45,404 |
203,737 |
34,160 |
100,816 |
-38 |
68,799 |
2012/13 |
30,344 |
765 |
68,799 |
106,577 |
47,620 |
222,996 |
33,409 |
104,743 |
-691 |
85,535 |
2013/14 |
29,554 |
792 |
85,535 |
107,447 |
41,191 |
234,173 |
30,417 |
106,356 |
-200 |
97,600 |
2014/15 |
30,131 |
744 |
97,600 |
102,900 |
36,053 |
236,553 |
24,647 |
108,656 |
58 |
103,192 |
2015/16 |
27,483 |
660 |
103,192 |
83,268 |
35,411 |
221,871 |
25,498 |
109,787 |
96 |
86,490 |
2016/17 |
25,965 |
751 |
86,490 |
89,511 |
37,689 |
213,690 |
22,944 |
112,932 |
146 |
77,668 |
2017/18 |
29,085 |
770 |
77,668 |
102,859 |
41,045 |
221,572 |
25,081 |
119,544 |
170 |
76,777 |
2018/19 |
29,085 |
749 |
76,777 |
100,067 |
42,023 |
218,867 |
27,281 |
119,607 |
160 |
71,819 |
2019/20 |
29,462 |
765 |
71,819 |
103,454 |
45,346 |
220,619 |
28,348 |
122,828 |
155 |
69,288 |
|
|
|
|
|
|
|
|
|
|
|
Foreign Agricultural Service/USDA |
29 |
May 2019 |
Office of Global Analysis |
|
|

vk.com/id446425943
Обзор рынка сельского хозяйства
Исследовательский центр компании «Делойт» в СНГ
Москва, декабрь 2018
vk.com/id446425943
Обзор рынка сельского хозяйства – 2018
Содержание
Вступительное слово |
04 |
Введение |
05 |
Основные выводы |
06 |
Ключевые макроэкономические |
|
показатели |
10 |
Ключевые финансовые |
|
показатели компаний АПК |
14 |
Государственные субсидии |
|
на развитие сельского хозяйства |
18 |
Производство и потребление |
32 |
Внутреннее потребление |
36 |
Внешняя торговля |
38 |
Мировой рынок |
|
сельского хозяйства |
44 |
Экспортная стратегия–2024: |
|
оценка эффекта |
54 |
Инновации и экологизация |
58 |
О респондентах |
61 |
Контакты |
62 |
03

vk.com/id446425943
Обзор рынка сельского хозяйства – 2018
Вступительное слово
|
|
|
|
Ринат Хасанов |
Михаил Ксенофонтов |
|
|
Директор департамента |
д. э. н., |
|
|
аудиторских услуг, |
заместитель директора |
|
|
руководитель Группы по обслуживанию |
ИНП РАН |
|
|
компаний агропромышленного бизнеса |
|
|
|
и потребительского сектора, |
По мере насыщения внутреннего |
Расширение присутствия на глобальном |
|
«Делойт» в СНГ |
продовольственного рынка основной |
агропродовольственном рынке |
|
|
предпосылкой дальнейшего |
будет означать все больший перенос |
|
Компания «Делойт» в СНГ благодарит |
роста российского аграрного |
колебаний мировых цен и обменного |
|
всех участников опроса, проведенного |
производства станет развитие |
курса рубля на динамику внутренних |
|
в рамках исследовательского проекта |
экспорта. Это нашло отражение |
цен на сельскохозяйственную |
|
«Обзор рынка сельского хозяйства – |
в целевой установке государства |
продукцию. В этих условиях вырастет |
|
2018», за уделенное время и интерес |
на увеличение объемов экспорта |
ценовая неопределенность |
|
к нашему исследованию. |
до 45 млрд долл. США к 2024 году. |
для российских потребителей и будут |
|
|
В экспертном сообществе принято |
возникать кризисные ситуации, |
|
Ваше экспертное мнение позволило |
рассматривать расширение |
аналогичные той, что сложилась |
|
нам выявить проблемы, тенденции |
экспорта как однозначно позитивное |
в этом году на внутреннем рынке |
|
и факторы роста в агропромышленном |
явление. Рост объемов внешних |
нефтепродуктов. Для минимизации |
|
комплексе России в 2018 году, |
поставок действительно позволит |
этих рисков государство уже сейчас |
|
а также отметить важные тренды, |
отечественным сельхозпроизводителям |
должно создавать эффективную |
|
которые объективно отражают |
получать дополнительные |
систему регулирования аграрных |
|
изменения в годовой динамике |
доходы и обеспечит рост выпуска, |
рынков и сельскохозяйственного |
|
развития сельского хозяйства. |
занятости, налогооблагаемой базы |
производства с учетом опыта развитых |
|
|
(не только в сельском хозяйстве, |
стран, в которых подобные системы |
|
Мы рады представить вам полную |
но и в сопряженных секторах). |
функционируют несколько десятилетий. |
|
версию аналитического отчета. |
Вместе с тем, на наш взгляд, |
|
|
Кроме того, основные выводы |
остаются недооцененными риски |
|
|
исследования будут опубликованы |
наращивания экспорта продукции |
|
|
ведущими российскими СМИ. |
агропромышленного комплекса (АПК). |
|
|
Мы будем признательны, если |
|
|
|
вы примете участие в нашем |
|
|
|
следующем исследовании. |
|
|
|
Если у вас возникнут вопросы, |
|
|
|
касающиеся настоящего исследования, |
|
|
|
пожалуйста, обращайтесь к нам. |
|
|
|
04
vk.com/id446425943
Обзор рынка сельского хозяйства – 2018
Введение
Терминология
Мы рады представить вашему вниманию результаты ежегодного исследования «Обзор рынка сельского хозяйства в России», подготовленного компанией «Делойт», СНГ.
Настоящее исследование проводится в России в четвертый раз.
Экспертные мнения позволили нам выявить актуальные проблемы, ключевые факторы и направления развития экономики России, а также провести сравнительный
анализ существующих тенденций.
Опрос проводился в октябре 2018 года. В нем приняли участие 50 экспертов.
Отчет подготовлен Исследовательским центром компании «Делойт», СНГ в Москве.
Цель исследования
Комплексное изучение тенденций развития сельского хозяйства в России.
Задачи исследования
Оценка текущего состояния и перспектив развития компаний отрасли.
Методология исследования
Сбор данных осуществлялся посредством проведения онлайнанкетирования и личных интервью.
В рамках комплексного анализа данных были использованы следующие подходы:
••выявление и изучение тенденций на рынке в целом;
••проведение сравнительного анализа данных в динамике;
••проведение многофакторного анализа данных (глубокого аналитического исследования результатов с целью выявления скрытых особенностей и интеграции полученных выводов).
Выборка исследования
Экспертный опрос, основанный на случайной выборке респондентов
из закрытой узкоспециализированной группы, рассматриваемой в полном объеме. В финальную выборку вошли 50 респондентов.
05

vk.com/id446425943
Обзор рынка сельского хозяйства – 2018
Основые выводы
Ключевые показатели |
|
|
|
|
|
|
2,9% |
2,5% |
1,1% |
|
|
|
|
|
|
|
|
|
|
|
687 |
Сельское хозяйство, |
Сельское хозяйство, |
|
|
|
3 |
2018 год |
2019 год |
|
|
3 647 |
|
||
Прирост |
|
|
|
|
|
|
|
|
Значение |
Показатель |
|
ВВП АПК (млрд руб.) |
604 |
|
|
||
|
|
индекса** |
индекса** |
||
|
|
|
|||
|
3 |
|
|
||
|
|
|
оценки текущего |
оценки |
|
|
|
|
|
||
|
|
|
|
состояния |
перспектив |
|
|
|
|
АПК выросло |
развития АПК |
4,1% |
2016 |
2017 |
2018* |
по сравнению |
сократился за год |
|
с 2017 годом |
на 7 пунктов |
|||
|
|
|
|
||
|
|
|
|
на 7 пунктов, |
и стал равен |
|
|
|
|
до 0,40. |
0,10. |
Топ-3 факторов роста |
|
|
|
|
|
конкурентоспособности |
|
|
Индекс** |
Индекс** оценки |
|
АПК России на глобальном рынке |
оценки текущего |
перспектив |
|||
••Государственная поддержка |
|
|
состояние дел |
компании вырос |
|
|
|
в компании вырос |
незначительно: |
||
|
|
|
|
||
••Стабильность законодательной |
|
на 11 пунктов. |
на 3 пункта. |
||
и регулятивной политики |
|
|
|
|
|
••Снижение стоимости |
|
|
энергетических ресурсов |
Рентабельность, |
Рентабельность, |
|
2017 год |
2018 год |
|
|
|
Данные |
|
Свиноводство |
статистики |
|
|
|
|
Данные опроса Производство
молока
Расчеты |
|
|
|
|
|
|
270 |
|
|
|
|||
«Делойта» |
Сальдированный |
Птицеводство |
||||
|
|
|||||
|
|
финансовый |
|
|||
Рост |
результат |
|
||||
|
|
млрд руб. |
агропромышленных |
|
||
|
|
|
|
компаний в 2017 году |
Растениеводство |
|
На прежнем |
|
|
|
|
|
|
уровне |
|
|
|
|
|
|
Снижение |
|
|
|
|
|
|
|
|
|
|
|
|
|
* Прогноз министерства экономического развития РФ |
|
|
|
|
|
|
** (от -1 до 1, где -1 – отрицательная оценка, +1 – положительная; один пункт равен 0,01) |
|
|||||
06

vk.com/id446425943
Государственная поддержка АПК |
|
|
|
|
Эффект для прибыли |
||
Расходы |
компаний |
||
федерального бюджета |
158 |
||
2017 год |
|||
|
|||
|
млрд руб. |
||
16241 1,4% |
|
|
|
|
|
||
|
|
||
млрд руб. |
|
|
|
|
|
||
|
|
|
|
|
234 |
||
Доля субсидий в прибыли |
млрд руб. |
||
Государственная |
|||
до налогообложения организаций АПК |
|||
поддержка АПК |
|||
(растениеводство, животноводство) |
|||
|
|
||
(%) |
|
86 |
|
|
|
70 |
72 |
65 |
52 |
50 |
|
2015 |
2016 |
2017 |
По данным Росстат По данным СПАРК Интерфакс
75 54 Совокупно, за три года
%%
Обзор рынка сельского хозяйства – 2018
Прибыль компаний АПК**
2017 год
86% 185
млрд руб.
48 Рост удовлетворенности процессом получения субсидий (2018, год к году).
% В 2017 году уровень удовлетворенности составлял -0,16. В 2018 году +0,24. (рейтинг от -1 до 1)
••полнота и доступность информации о получении льготного кредита
••бюрократический аспект
••объемы льготного кредитования
* (от -1 до 1, где -1 – отрицательная оценка, +1 – положительная; один пункт равен 0,01)
** Прибыль до налогообложения включает показатели отраслей растениеводства и животноводства, по данным Росстат
07
vk.com/id446425943
Обзор рынка сельского хозяйства – 2018
Вызовы и стратегии |
|
|
|
|
|
|
|
|
|
|
|
|
|
Топ-3 вызова |
|
|
|
|
Топ-3 стратегии |
|
|
1 |
для компаний АПК в России |
3 |
1 |
компаний АПК в России |
3 |
|||||
|
|
2 |
|
|
2 |
|
||||
Высокая |
|
Недостаточность |
Нехватка квали- |
Увеличение |
Повышение |
Сокращение |
||||
стоимость |
|
государственной |
фицированных |
объема |
|
производственно- |
|
расходов |
||
энергетических |
поддержки |
кадров |
производства |
технического |
|
|
||||
ресурсов |
|
ифинансирования |
|
|
|
|
потенциала (ввод |
|
|
|
|
|
|
|
|
|
|
|
новых мощностей) |
|
|
Инновации и экологизация |
|
|
|
|
|
|
|
|||
89% |
представителей АПК видят необходимость в повышении экономической |
|
|
|||||||
|
|
|
|
|||||||
|
|
эффективности путем автоматизации ключевых процессов. |
|
|
|
|
||||
Топ-3 планируемые к внедрению |
0,13 |
|
Взвешенный индекс |
|
||||||
|
|
|
технологии |
|
|
|
распространения инновационных |
|||
1 |
|
|
2 |
|
3 |
|
технологий среди компаний АПК , |
|||
|
|
|
|
|
что на 2 пункта ниже, чем средний |
|||||
|
|
|
|
|
уровень инновационности |
|||||
Умные фермы |
Биотехнологии Индивидуализация |
|
|
компаний в России* |
|
|||||
|
|
|
(биопестициды, |
продуктовой |
29% |
|
|
|
||
|
|
|
биоудобрения, |
линейки |
компаний отметили, |
|
||||
|
|
|
биотопливо, |
|
|
|
||||
|
|
|
|
|
что работа в области экологизации |
|||||
|
|
|
биопрепараты) |
|
|
|||||
|
|
|
|
|
закреплена в основных документах |
|||||
|
|
|
|
|
|
|||||
компании и активно ведется.
Международный рынок товаров АПК
Топ-5 стран и регионов |
Топ-5 стран и регионов |
производителей |
потребителей |
товаров АПК |
товаров АПК |
••Азия (кроме Китая и Индии) |
••Китай |
••Китай |
••Азия (кроме Китая и Индии) |
••Бразилия |
••Соединенные штаты |
••Индия |
•• Европейский союз – |
••Соединенные штаты |
28 стран |
|
|
|
••Индия |
Прогноз потребления ключевых товаров АПК в мире
(2019–2020)
Кукуруза |
Пшеница |
|
Пшеница |
Соевые |
|
бобы |
||
|
||
Подсолнечное |
Молочная |
|
масло |
продукция |
* (от -1 до 1, где -1 – отрицательная оценка, +1 – положительная; один пункт равен 0,01)
08

vk.com/id446425943
Обзор рынка сельского хозяйства – 2018
Оценка макроэкономических эффектов расширения экспорта продукции АПК
0,3 |
Среднегодовой прирост ВВП* |
до 2024 г. в результате увеличения |
|
экспорта продукции АПК |
|
% |
|
7175
млрд руб.
1028
млрд руб.
Суммарный дополнительный прирост ВВП при расширении экспорта АПК в 2018–2024 годах
Суммарные дополнительные налоговые сборы с 2018 по 2024 годы, полученные
от увеличения производства и экспорта продукции АПК
Топ-5 отраслей, помимо АПК, которые получат максимальный прирост ВВП от программы поддержки экспорта АПК
2159 |
2,4 АПК в 2024 году |
|
|
|
Эффект на ВВП от |
|
|
расширения экспорта |
млрд руб. |
|
% |
308 |
Дополнительные налоговые |
|
сборы от расширения |
||
экспорта АПК в 2024 году |
||
млрд руб. |
|
|
Для реализации программы необходимо увеличить экспорт продукции животноводства (мяса птицы и мяса свиней) в 7 и 6 раз соответственно, а масличных семян и плодов в 6 раз.
1 |
2 |
3 |
4 |
5 |
7 |
6 |
6 |
На транспорт приходится 17% от прироста |
|
||||||
к ВВП за счет реализации программы |
|
||||||
|
|
|
|
|
раз |
раз |
раз |
поддержки экспорта, на услуги по оптовой торговле – 9%, на строительство – 5%, на услуги, связанные с недвижимым имуществом – 5%, на машины и оборудование – 3%.
69 представителей АПК ожидают, что выручка их компаний от экспортной деятельности
% в ближайшие пять лет вырастет
* Относительно ВВП 2017 года, по сравнению со сценарием сохранения текущих объемов экспорта
09