

- •Вступительное слово
- •Введение
- •Ключевые макроэкономические показатели
- •Ключевые финансовые показатели компаний АПК
- •Государственные субсидии на развитие сельского хозяйства
- •Производство и потребление
- •Внутреннее потребление
- •Внешняя торговля
- •Мировой рынок сельского хозяйства
- •Инновации и экологизация
- •О респондентах
- •Контакты
- •What drives crude oil prices?
- •Crude oil prices react to a variety of geopolitical and economic events
- •World oil prices move together due to arbitrage
- •Crude oil prices are the primary driver of petroleum product prices
- •Economic growth has a strong impact on oil consumption
- •Changes in expectations of economic growth in can affect oil prices
- •In OECD countries, price increases have coincided with lower consumption
- •Rising oil prices held down global oil consumption growth from 2005-2008, despite high economic growth
- •Changes in non-OPEC production can affect oil prices
- •Non-OPEC supply expectations indicate changes in market sentiment concerning oil supply
- •Changes in Saudi Arabia crude oil production can affect oil prices
- •Unplanned supply disruptions tighten world oil markets and push prices higher
- •During 2003-2008, OPEC’s spare production levels were low, limiting its ability to respond to demand and price increases
- •The years 2003-2008 experienced periods of very strong economic and oil demand growth, slow supply growth and tight spare capacity
- •Physical participants’ (producers, merchants, processors, and end users) U.S. futures market contract positions
- •Money managers tend to be net long in the U.S. oil futures market
- •Crude oil plays a major role in commodity investment
- •Commodity index investment flows have tended to move together with commodity prices
- •Correlations (+ or -) between daily price changes of crude oil futures and other commodities generally rose in recent years
- •Correlations (+ or -) between daily returns on crude oil futures and financial investments have also strengthened
- •For more information

vk.com/id446425943
Correlations (+ or -) between daily price changes of crude oil futures and other commodities generally rose in recent years
|
2003 |
2004 |
2005 |
2006 |
2007 |
2008 |
2009 |
2010 |
2011 |
2012 |
2013 |
2014 |
2015 |
2016 |
2017 |
2018 |
2019 |
2020 |
Natural Gas |
0 0 0 1 0 1 0 0 0 1 1 1 0 0 0 0 0 0 0 0 1 1 0 0 0 0 0 0 0 0 # 0 0 0 0 0 0 0 0 0 0 # 0 0 0 0 # 0 0 0 0 0 0 0 0 0 0 0 0 0 0 # 0 # 0 |
|
||||||||||||||||
Gold |
0 0 # 0 0 0 0 0 0 0 0 0 0 1 0 0 0 0 0 1 1 1 0 0 0 0 1 0 1 # 0 1 1 1 0 1 0 0 0 0 0 0 0 0 # 0 0 0 # 0 0 0 # # # 0 0 0 # 0 0 0 0 # 0 |
|
||||||||||||||||
Copper |
# 0 # 0 0 0 0 0 # 0 0 # 0 1 0 0 0 0 0 0 1 0 1 1 0 1 1 1 1 1 0 1 0 1 1 1 1 1 1 0 0 1 0 0 0 # 0 1 0 0 0 0 1 0 0 0 0 0 0 0 0 0 0 0 0 |
|
||||||||||||||||
Silver |
0 0 # 0 0 0 0 # 0 0 0 0 0 1 0 0 0 0 0 1 1 1 0 0 0 0 1 1 1 0 0 0 0 1 0 1 0 0 0 0 0 0 0 0 # 0 0 0 0 0 0 0 0 0 0 0 0 0 0 0 0 0 0 0 0 |
|
||||||||||||||||
Soy |
# 0 # 0 # 0 # 0 0 0 0 0 0 0 0 0 0 0 0 0 1 0 1 1 0 1 0 0 0 0 0 0 0 0 1 0 0 0 0 0 # 0 0 # 0 0 # 0 0 0 0 0 0 0 0 0 0 0 0 0 # 0 0 # 0 |
|
||||||||||||||||
Corn |
# 0 # # 0 0 0 # 0 0 0 0 0 0 0 0 0 # 0 0 1 0 0 1 1 0 0 1 0 0 # 0 0 0 0 0 0 0 0 0 # 0 # 0 0 0 # 0 0 0 0 0 # 0 0 0 0 0 0 0 # 0 # 0 # |
|
||||||||||||||||
Wheat |
0 0 # 0 0 0 0 # 0 0 0 0 # 0 0 0 1 # # 0 0 0 0 0 1 1 0 1 0 0 0 0 0 0 0 0 0 0 0 # # # # # 0 # 0 # 0 0 0 0 # 0 0 0 0 0 0 0 # # 0 0 0 |
|
||||||||||||||||
< -0.65 -0.65 to -0.4 -0.4 to -0.25 -0.25 to 0.25 |
0.25 to 0.4 0.4 to 0.65 |
> 0.65 |
Negative correlation |
Positive correlation |
|
Note: Correlations computed quarterly |
|
|
May 7, 2019 |
|
21 |

vk.com/id446425943
Correlations (+ or -) between daily returns on crude oil futures and financial investments have also strengthened
|
2003 |
2004 |
2005 |
2006 |
2007 |
2008 |
2009 |
2010 |
2011 |
2012 |
2013 |
2014 |
2015 |
2016 |
2017 |
2018 |
2019 |
2020 |
S & P 500 |
# # # # 0 0 # # # 0 # 0 0 0 # 0 0 0 0 # 0 # 0 0 0 1 1 0 1 1 1 1 # 1 1 1 0 1 1 0 0 1 0 0 0 0 0 0 0 0 0 0 1 0 0 0 0 # # 0 0 0 0 0 0 |
|
||||||||||||||||
U.S. Dollar |
# # # # # # # # # # # # # # # 0 # # 0 # # # # # # # # # # # # # # # # # # # # # # # 0 # # # # # # # 0 # 0 # # 0 # # 0 # # # # 0 # |
|
||||||||||||||||
U.S. Bonds |
0 0 0 0 # 0 0 0 # 0 0 # 0 0 # # # 0 # 0 # 0 # # # # # # # # # # # # # # # # # # # # # 0 # # 0 # # # # # # # # # 0 # # 0 # # # # # |
|
||||||||||||||||
WTI Implied Volatility |
0 # # 0 # 0 0 # 0 0 0 # 0 # 0 # # # # 0 0 0 # # # # # # # # # # 0 # # # # # # # # # 0 # # 0 # # # # # # # # # # # # # # # # # # # |
|
||||||||||||||||
Inflation Expectations |
0 0 0 # 0 0 0 0 0 0 0 0 1 1 0 0 0 0 0 0 1 0 1 # 0 0 0 0 0 1 0 0 0 1 1 0 0 1 0 0 # 1 0 0 0 0 0 0 0 1 1 0 1 1 1 0 0 0 0 # # 0 0 1 0 |
|
||||||||||||||||
< -0.65 -0.65 to -0.4 -0.4 to -0.25 -0.25 to 0.25 |
0.25 to 0.4 0.4 to 0.65 |
> 0.65 |
Negative correlation |
Positive correlation |
|
Note: Correlations computed quarterly
May 7, 2019 |
22 |

vk.com/id446425943
For more information
U.S. Energy Information Administration home page | www.eia.gov Short-Term Energy Outlook | www.eia.gov/steo
Annual Energy Outlook | www.eia.gov/aeo
International Energy Outlook | www.eia.gov/ieo
Monthly Energy Review | www.eia.gov/mer
EIA Information Center
(202) 586-8800 | email: InfoCtr@eia.gov
May 7, 2019 |
23 |

vk.com/id446425943
Artificial
Intelligence
in Europe
Outlook for 2019 and Beyond
How 277 Major Companies Benefit from AI
REPORT COMMISSIONED BY MICROSOFT AND CONDUCTED BY EY

vk.com/id446425943
Disclaimer
This report has been prepared by Ernst & Young LLP in accordance with an engagement agreement for professional services with Microsoft. Ernst & Young LLP’s obligations to Microsoft are governed by that engagement agreement. This disclaimer applies to all other parties.
This report has been prepared for general informational purposes only and is not intended to be relied upon as accounting, tax, or other professional advice. Refer to your advisors for specific advice. Ernst & Young LLP and Microsoft accept no responsibility to update this report in light of subsequent events or for any other reason.
This report does not constitute a recommendation or endorsement by Ernst & Young LLP or Microsoft to invest in, sell, or otherwise use any of the markets or companies referred to in it. To the fullest extent permitted by law, Microsoft and Ernst & Young LLP and its members, employees and agents, do not accept or assume any responsibility or liability in respect of this report, or decisions based on it, to any reader of the report. Should such readers choose to rely on this report, then they do so at their own risk.
©2018 EY LLP Limited All Rights Reserved.
Contents
Preface |
|
|
|
Foreword |
|
|
06 |
Executive Summary - ‘At a Glance’ . . . . . . . . . . . . . . . . . . . |
|
08 |
|
Setting the Scene |
|
|
|
About this Report . . . . . . . . . . . . . . . . . . . . . . . . . . |
|
10 |
|
Rich Data . . . . . . . . . . . . . . . . . . . . . . . . . . . . . |
|
13 |
|
Executive Perspective . . . . . . . . . . . . . . . . . . . . . . . . |
. |
14 |
|
Participating Companies . . . . . . . . . . . . . . . . . . . . . . . |
|
16 |
|
Bits & Bytes . . . . . . . . . . . . . . . . . . . . . . . . . . . . |
. |
18 |
|
Follow the Money . . . . . . . . . . . . . . . . . . . . . . . . . . |
|
20 |
|
Case Study . . . |
. . . . . . . . . . . . . . . . . . . . . . . . . . . . . . . . . . . . . . . . |
. |
22 |
Experts . . . . . . . . . . . . . . . . . . . . . . . . . . . . . . |
. |
23 |
|
Role of AI in European Business |
|
|
|
A Strategic Agenda . . . . . . . . . . . . . . . . . . . . . . . . . |
|
27 |
|
Among Friends . . . . . . . . . . . . . . . . . . . . . . . . . . . |
|
28 |
|
Push or Pull . . . . . . . . . . . . . . . . . . . . . . . . . . . . |
. |
29 |
|
Ready, Set... . |
. . . . . . . . . . . . . . . . . . . . . . . . . . . |
. 30 |
|
AI Maturity Curve . . . . . . . . . . . . . . . . . . . . . . . . . . |
|
32 |
|
State Your Business |
|
34 |
|
Case Study |
|
|
36 |
Business Benefits and Risks |
|
|
|
Another World . . . . . . . . . . . . . . . . . . . . . . . . . . . |
|
38 |
|
AI Here, There, Everywhere |
|
40 |
|
Case Study . . . |
. . . . . . . . . . . . . . . . . . . . . . . . . . . . . . . . . . . . . . . . |
. |
41 |
Use it or Lose it . . . . . . . . . . . . . . . . . . . . . . . . . . . |
|
42 |
|
Making AI simple . . . . . . . . . . . . . . . . . . . . . . . . . . |
|
44 |
|
Case Study . . . |
. . . . . . . . . . . . . . . . . . . . . . . . . . . . . . . . . . . . . . . . |
. |
47 |
Sector Benefits Landscape . . . . . . . . . . . . . . . . . . . . . . |
. |
48 |
|
Risky Business . . . . . . . . . . . . . . . . . . . . . . . . . . . |
|
51 |
|
Learn from the Leaders |
|
|
|
Capabilities . . . . . . . . . . . . . . . . . . . . . . . . . . . . |
. |
53 |
|
AI Competency Model . . . . . . . . . . . . . . . . . . . . . . . . |
|
55 |
|
Advanced Analytics . . . . . . . . . . . . . . . . . . . . . . . . . |
|
56 |
|
Data Management |
|
58 |
|
AI Leadership |
|
|
60 |
Open Culture . . . . . . . . . . . . . . . . . . . . . . . . . . . . |
|
62 |
|
Emerging Technology |
|
64 |
|
Agile Development . . . . . . . . . . . . . . . . . . . . . . . . . |
|
66 |
|
External Alliances . . . . . . . . . . . . . . . . . . . . . . . . . . |
|
68 |
|
Emotional Intelligence . . . . . . . . . . . . . . . . . . . . . . . . |
|
70 |
|
Case Study |
|
|
73 |
What’s next for you? |
|
|
|
How to Get Started |
|
74 |
|
Who to Contact from Microsoft . . . . . . . . . . . . . . . . . . . . |
|
77 |
|
Contributors from EY . . . . . . . . . . . . . . . . . . . . . . . . |
. 79 |
||
2 |
3 |

vk.com/id446425943
AI will be useful wherever intelligence is useful, helping us to be more productive in nearly every field of human endeavor and leading to economic growth.
— Harry Shum, Executive
 Vice President of
Microsoft AI
 and Research Group &
Brad Smith, President and Chief Legal


Officer at Microsoft
4 |
5 |

vk.com/id446425943
Preface |
Preface |
Foreword
Human Ingenuity
The printing press, the automobile & the Internet are just a few technological achievements that have advanced our world. All were driven by human ingenuity: our innate creativity that inspires us to learn, imagine & explore. This spirit is what pushes us to challenge the boundaries of the possible to go ever forward.
Today, AI is helping to amplify our human ingenuity, opening up exciting new possibilities for how intelligent technology can shape our world. At Microsoft, our goal is to democratize access to AI for everyone through innovative & powerful platforms, & above all, we’re focused on ensuring that our AI tools & technologies are deployed responsibly & earn people’s trust.
And yet, we realize that AI is one of the lesser understood modern technological break-throughs. Many questions remain. How are companies applying this technology to empower employees, engage with customers, transform their business and optimize their operations? Where are they seeing benefits, and what are their blockers?
To provide answers, Microsoft commissioned this study to understand the AI strategy of major companies across 7 sectors & 15 countries in Europe. It examines these companies’ readiness to adopt AI, how they rate the impact and benefits from AI implementations, and what they perceive as risks
& keys to success.
We hope you find these insights inspirational for your own journey toward adopting AI & realizing its benefits for amplifying human ingenuity.
Vahé Torossian
President, Microsoft Western Europe
6 |
7 |
vk.com/id446425943
Preface
At a Glance
While the hype of artificial intelligence
(AI) and its potential role as a driver of transformational change to businesses and industries is pervasive, there are limited insights into what companies are actually doing to reap its benefits.
This report aims at getting a deeper understanding of how companies currently manage their AI activities, and how they address the current challenges and opportunities ahead.
To get to the heart of this agenda, we received input from AI leaders in 277 companies, across 7 sectors and 15 countries in Europe, via surveys and/or interviews. Below is the brief summary of what they had to say.
AI is a “hot topic” - but more so on C-level than in daily operations
71% of the companies respond that AI is considered an important topic on the executive management level.
This is significantly higher than on the non-managerial / employee level where AI is only considered an important topic in 28% of the companies. Interestingly, Board of Directors also came out lower with ‘only’ 38% of respondees reporting that AI is important to their board.
Most impact expected from ‘optimizing operations’, with ‘engaging customers’ as a close second
89% of the respondents expect AI to generate business benefits by optimizing their companies’ operations in the future. This is followed by 74% that expect AI to be key to engaging customers by enhancing the user experience, tailoring content, increasing response speed, adding sentiment, creating experiences, anticipating needs, etc.
C-suite respondents scored ‘engaging customers’ highest of the AI benefit areas. Noticeably, 100% of the most advanced* companies expect AI will help them engage customers, compared to only 63% of the less mature companies. Using AI to ‘transform products and services’ comes out slightly lower with 65%, and ‘empowering employees’
the lowest with 60% of the companies expecting AI-generated benefits in that area.
AI is expected to impact entirely new business areas in the future
57% of the companies expect AI to have a high impact or a very high impact on business areas that are “entirely unknown to the company today”. This
is almost as much as AI is expected to impact the core of these companies’ current business with 65% expecting AI to have a high or a very high impact on the core business. With AI presumably pushing companies into totally new domains in the future, it is perhaps not surprising that AI is receiving attention as a key topic for executive management.
Very few of the 277 companies consider themselves “advanced” with AI
Despite the apparent sizable impact that companies expect from AI, only a very small proportion of companies, constituting 4% of the total sample, self-re- port that AI is actively contributing to ‘many processes in the company and enabling quite advanced tasks today’ (referred to as ‘most advanced’ in this report).
Another 28% are in the ‘released’ stage where they have put AI selectively to active use in one or a few processes in the company. The majority, 51% of companies, are still only planning for AI or are in early stage pilots. 7% of companies are self-rated as least mature, indicating that they are not yet thinking about AI at this stage.
Only 4% |
Percentage of companies |
that are still only in the |
|
planning or piloting stages: |
|
of the companies are actively |
61% |
using AI in ‘many processes |
|
and to enable advanced tasks’ |
71%
of the companies
respond that AI is considered ‘an important topic’ on the executive management level
Preface
Noticeable potential for AI in many corporate functions
The most widely reported adoption of AI (47%) was in the IT/Technology function, followed by R&D with 36%, and customer service with 24%. Interestingly, several functions are hardly using AI at all; most notably, the procurement function, where only 4% of the companies currently use AI, followed by HR with 7% and product management with 9%. This is perhaps surprising, given the many use cases
and applicable solutions in these functional areas.
8 key capabilities that are most important ‘to get AI right’
When asking the respondents to rank the importance of 8 capabilities to enable AI in their businesses, ‘advanced analytics’ and ‘data management’ emerged as the most important. ‘AI leadership’ and having an ‘open culture’ followed.
When self-assessing the capabilities where the companies are least competent, they point to emotional intelligence and AI leadership - defined as the (lack of) ability to lead an AI
transformation by articulating a vision, setting goals and securing broad buyin across the organization.
To summarize, the challenge ahead appears to be as much about culture and leadership as it is about data, analytics, and technology.
What sets the most ‘AI mature’ companies apart?
They expect AI will be beneficial in ‘empowering employees’ (76% of ‘more mature’ companies vs. 42% of ‘less mature’ companies)*.
They report using a combination of structured and unstructured data for AI (65% of ‘more mature’ companies vs. 15% of ‘less mature’ companies), and data from both internal and external sources (68% of ‘more mature’ companies vs. 16% of ‘less mature’ companies).
They expect AI will help them ‘engage customers’ (85% of ‘more mature’ companies vs. 59% of ‘less mature’ companies).
They see AI predominately being driven from a combination of technology push and business pull (61% of ‘more mature’ companies vs. 32% of ‘less mature’ companies).
* ‘More mature’ defined as companies that self-ranked as 4 or 5 on the maturity 5-scale, and ‘less mature’ defined as companies that self-ranked as 1 or 2.
57%
of the companies
expect AI to have a high impact on ‘business areas that are entirely unknown today’
Share of companies that use acquisitions as a way to obtain AI capabilities:
10%only
80%
of the most mature
companies expect that AI will be beneficial by
‘empowering employees’
8 |
9 |

vk.com/id446425943
Setting the Scene
About this Report
What’s new?
Artificial Intelligence (AI) is not new.
It has existed for decades: processing voice to text or language translation; real-time traffic navigation; dynamically serving targeted advertisements based on personal data and browsing history; predicting trends and guiding investment decisions in financial institutions. The current developments have been fueled by an exponential rise in computing power, increasing accessibility and sophistication of powerful algorithms, and an explosion in the volume and detail of data available to feed AI’s capabilities.
Reality vs. hype
Only recently started to see more widespread, scaled adoption of AI across sectors, value chains and ecosystems. Yet AI technology is quickly approaching a point where it is becoming a critical element in enabling companies across sectors to drive revenue, increase profits and remain competitive.
We hear many people in numerous companies talk about AI. While the hype is pervasive, not a lot of people fully understand its technological potential, where it can create value or how to get started. This report aims at providing a practical understanding of why European companies are investing
in AI, what they are investing in, and how they are managing the complicated process of adopting this new technology and deriving value across business opportunities.
Perspectives, experiences, selfassessment, and benchmarks
From new surveys, interviews and case studies gathered from approximately 277 companies, we provide a snapshot of the current state of AI in 15 European markets. This includes analyzing AI’s relative importance on the strategic agenda, its expected impact and ben-
efit areas, how mature companies are in terms of adoption, and examining self-reported competence levels regarding the capabilities required to succeed when implementing AI.
From the aggregate dataset we have been able to determine some benchmarks across the covered markets, which we compare the individual country with throughout the report. The report also covers a full spectrum of industry groups which tend to reveal interesting insights.
One of the key challenges is meeting the high expectations from the organization - AI is not magic, but takes considerable effort to successfully implement.
—H.Lundbeck
Pharmaceuticals
Setting the Scene
Straight from the executives
Where this report and extensive dataset adds new insights is primarily into how leading companies are approaching AI on a very practical level. We hear straight from executives how their companies are addressing current challenges, and how they apply AI to unlock new value pockets.
Based on the many interviews conducted, this report reveals some clear excitement and immense potential for using AI to bring new, improved products and services to market, create exceptional experiences for customers and employees, and create ways to operate that enhance performance across the board.
We learned that regardless of which use cases the companies pursue and the role that AI currently has, taking a strategic outlook to assess the implications for the business and responding accordingly are increasingly seen as crucial for any executive agenda.
Contributions from open-minded and collaborative companies
We are extremely thankful for the time and effort the many executives have put into participating in interviews and providing data for this study. We’re particularly appreciative of their willingness to openly share experiences and provide their perspectives on where the future is heading within AI.
While this indicate a general interest in the AI topic, it also speaks to the increasingly collaborative approach many leading companies are taking when entering new technology domains and embarking on journeys into unknown territories.
During the past few years, we have learnt what is easy, what is hard, what is realistic and what is only hype.
—DNA
Telecommunications
10 |
11 |

vk.com/id446425943
Artificial intelligence in Europe
When working with AI initiatives, it is important to focus on key business issues that benefit the whole and not just doing suboptimization at small scale.
— Novo Nordisk Pharmaceuticals
I don´t see why speaking openly about our ongoing AI intiatives should be a big fuss. What really makes a difference from a competitive perspective is a company´s abilitity to execute.
— PFA Pension & Insurance
Setting the Scene
Rich Data
Which sources of information is the study based on?
This report combines multiple sources of data to answer the questions of why, where and how AI is currently being used in business. It provides an inside view across markets and sectors. It provides
a pan-European view, and adds value through a quantitative perspective on how advanced companies are with AI, and a qualitative perspective on how to develop the skills required to succeed with AI. We have received input from over 300 people from 277 participating companies. This has resulted in a range of interviews and case studies as well as 269 company responses to our survey.
Extensive online survey data from business leaders in 269 companies
We have surveyed people with a leading role in managing the AI agenda in all the companies that have contributed to the study. This gives us an aggregate dataset that enables a perspective for each market and each sector, as well as comparative insights for the respective company types, sectors, and countries in Europe.
Qualitative in-depth interviews with senior business executives
In addition, we conducted deep-dive interviews to gain deeper, qualitative insights into how AI is affecting the executive agenda. Through conversations with business leaders, we report on where they expect AI will have an impact, how important AI is to their current and future business strategies, what benefits they hope to realize from implementing AI, and which capabilities they believe are key to advance AI maturity in their companies.
We also present case studies of specific companies from different countries to provide an understanding of what they are doing with AI and why, drawing
on lessons learned and obstacles to overcome when putting AI to use for specific use cases and to derive value on a strategic level.
Proprietary AI investment data
We have supplemented the primary source input from the companies with acquisition data from numerous sources, to take the pulse of the AI investment market in Europe. These insights help provide a picture of the wider European AI ecosystem and its development.
AI expert perspectives
With this wider understanding of AI start-up acquisitions, partnerships, and investment funding, we outline how investments in AI are skyrocketing, where AI investment is taking place geographically, and which sectors are making bets. As we are on the cusp of widespread change driven by AI, we also reached out to AI experts from academia for an outlook of AI technologies going mainstream, and to gain an understanding of the macro scale of business effects that they expect will materialize when looking into a distant future.
Recognizing and mitigating potential survey and interview bias
In terms of methodology, this report follows robust research design and protocol. Doing so minimizes potential bias, but does not eliminate it, as it
is inevitable in market research. One potential type is social desirability and conformity bias, as the topic of AI receives lots of media and political attention. Response bias, including extreme responding, cultural bias, and acquiescence bias (“yea-saying”), are
potential factors as we ask respondents to self-report on their respective companies’ experience. Therefore, while this report follows best practices, some bias is possible.
Nonetheless, with the combination of extensive survey data, interview data, investment data, and expert perspectives, we believe the report provides a solid foundation for an indispensable view of executive experience with – and future plans for – AI in business.
12 |
13 |

vk.com/id446425943
Setting the Scene
Executive Perspective
Who are the respondents that have contributed to the study?
The data approach used allows us to identify trends across industries and countries based on input from various functional business areas. Consequently, we have captured a range of insights, learnings, and perspectives from both strategic and technical points of view.
Respondents predominantly in senior level positions
To ensure that these insights and perspectives are relevant at the executive level, we surveyed and interviewed high-ranking officers with a responsibility for driving the AI agenda in their respective companies. With 60% of respondents being either part of top management or the executive management team, their input is likely well attuned to the general perspective and overall strategic direction of the companies they represent.
Functional diversity
The respondents cover very different functions, of which the most common are designated AI/digital department, followed by IT, and strategy/general management functions. This functional diversity increases the breadth of the report, with insights and perspectives covering widely different aspects of AI.
Surveyed companies span multiple sectors
The participating companies are spread fairly evenly across seven sectors, with the majority of companies belonging to Industrial Products & Manufacturing, followed by Financial Services, and Transportation, Energy & Construction.
Services and Life Science are represented to a lesser extent.
A combined annual revenue of $2.3 trillion
Participants come from both major listed companies, privately held companies, and in some case relatively small companies. In totality, they represent a combined revenue of approximately $2.3 trillion. Despite covering a significant part of total European business, our selection criteria have also favored more niche oriented companies with extensive AI experience and capabilities.
More than 300 participants |
Majority hold a top management or executive position |
Number of participants interviewed |
Organisational level of person participating in the study |
and/or online surveyed in the study |
|


 +
+
C-suite/Executive |
27% |
Top Management |
|
(non-executive) |
33% |
Management |
|
|
|
Level |
37% |
|
|
Employee |
|
|
|
(non-managerial level) |
3% |
|
|
15 European markets |
|
|
15 European markets |
|
|
||
|
|
Setting the Scene
Large group of respondents |
Surveyed companies are well represented across |
with a specific AI/digital role |
each of the 15 European markets |
Organizational function of respondents |
Number of online surveyed companies per country |
in the online survey |
|
67 |
|
|
|
|
|
|
|
|
60 |
|
|
|
|
|
Norway |
|
|
|
|
|
|
|
|
|
|
45 |
|
|
|
|
|
|
|
|
39 |
|
|
|
Denmark |
|
|
|
|
|
|
|
|
|
|
|
|
27 |
26 |
|
25 |
|
|
|
|
|
|
||
|
|
|
|
|
|
|
|
|
|
|
|
|
|
|
21 |
|
|
|
|
|
|
|
Austria |
|
|
|
|
|
|
5 |
|
|
|
|
|
|
|
|
22 |
Digital/AI |
General IT/Technology |
General Management, Strategy & Business Development |
R&D/Product Management |
Customer Service & Marketing |
Admin & Finance |
Other |
Portugal |
|
Netherlands |
|
||
|
|
22 |
20 |
21 |
|
|
|
|
|
269 |
|
|
|
online survey |
|
|
|
companies |
|
|
|
in total |
|
|
20 |
21 |
|
|
|
|
|
Spain |
|
& Belgium Luxenbourg |
|
|
|
|
|
Ireland |
|
|
Sweden |
20 |
Switzerland |
|
|
|
20 |
20 |
Italy |
|
|
22 |
15 |
Finland |
|
United |
France |
|
|
& |
|
Kingdom, |
|
Germany |
Seven major sectors covered in the study participating category
9% |
21% |
17% |
7% |
Life Science |
Industrial Products |
Finance |
Services |
Pharmaceutical, Healthcare, |
Manufacturing, |
Banking, Insurance, |
Professional Services, |
Biotech |
Materials, Equipment |
Investments |
Hospitality, Public Services, |
|
|
|
Membership Organization |
13% |
16% |
17% |
CPR |
TMT |
Infrastructure |
Consumer Products |
Technology, |
Transportation, Energy, |
& Retail |
Media/Entertainment & Telecom |
Construction, Real Estate |
14 |
15 |

vk.com/id446425943
Setting the Scene
277 Companies
A.P. Moller - Maersk, Acciona, Adamant-Namiki of Europe, Aegon, Aena, Ageas, Agfa-Gevaert, Agrifirm Group, Ahlstrom-Munksjö, AIB, AkzoNobel, Almirall, Alpro, ALSA, Amadeus, AMAG, Ambea,
APM |
Terminals, Aprila Bank, |
Arcelor Mittal, Ardagh |
Group, |
Arval |
BNP Paribas Group, |
Asiakastieto Group, Assa |
Abloy, |
Assicurazioni Generali, Atea, Audi, Austrian Airlines, Austrian Federal Computing Centre, Autogrill, BAM Group, Barco, BASF, BAWAG P.S.K, Baxter, BBVA, Besix, Bolloré, BTG, BUWOG, C&C
Group, |
Campbells |
International, |
Capio, Carmeuse, |
Carnival |
UK, CEiiA, Cermaq, Chr. Hansen, Cirsa, City of Amsterdam, |
||||
Colruyt Group, Com Hem, Combient, Comifar Distribuzione, |
||||
Constitutional Court of Austria, Coolblue, COOP Nederland, |
||||
Cosentino Group, Costa Crociere, Credit Suisse, Crédito Agrícola, |
||||
DAF Trucks, Danfoss, Danske Bank, Dawn Meats, DFDS, DNA, |
||||
DNB, |
DSM, DSV, |
Dümmen Orange, |
Dynamic ID, DAA, |
Edison, |
EDP - Energias de Portugal, Egmont, EQT, Ericsson, Erste Group Bank, ESB, ESIM Chemicals, Esprinet, Europac, Fazer, FDJ, Federal Office of Meteorology and Climatology MeteoSwiss, Ferrovial, Fexco, Finnair, Fortum, Galp, Geberit, Genalice, Generali Versicherung, GetVisibility, Gjensidige Forsikring, Glen Dimplex Group, Globalia, GN Store Nord, GrandVision, Grupo Antolin, Grupo Ascendum, Grupo Codere Cablecom, Grupo Juliá, Grupo Nabeiro – Delta Cafés, Grupo Pestana, Grupo Visabeira, GSK, GAA, H. Lundbeck, Hafslund, Handelsbanken, Hera, Hostelworld, Husqvarna, IKEA Group, Ilmarinen Mutual Pension Insurance Company, Implenia, Impresa,
Setting the Scene
Indie Campers, Intesa Sanpaolo, ISDIN, ISS, Jansen AG, Julius Baer, Katoen Natie, KBC Group, Kemira, Kingspan Group, KLP Banken, Komplett, Kongsberg Gruppen, LafargeHolcim, LanguageWire, LEGO, LEO Pharma, Lerøy Seafood, Liga Portugal, L’Occitane, Lonza, L’Oreal, Lusíadas Saúde, Luz Saúde, Länsförsäkringar, MAPFRE, Merkur Versicherung, Metall Zug , Metro, Metso, M-Files, Millicom, Mota-Engil, Mutua Madrileña Automovilista, Møller Mobility Group, Neste, NH Hotel Group, Nilfisk, Nokia Corporation, NorgesGruppen,
Norstat, |
Novabase, Novartis, Novo Nordisk, |
Novozymes, |
Now TV, OBI, Oesterreichische Nationalbank, OP Financial Group, |
||
Opportunity Network, Orion, Paddy Power Betfair, Peltarion, |
||
Pernod |
Ricard,PFA, Philips, Planeta DeAgostini, Poste Italiane, |
|
Posti, PostNord, Proximus, Pöyry, Rabobank, Raiffeisen Software, |
||
Raiffeisen Switzerland, Ramada Investimentos SA, Randstad, Rexel, |
||
ROCKWOOL Group, Room Mate Hotels, Royal College of Surgeons in |
||
Ireland,SGroup,Saipem,SaintGobain,SakthiPortugal,Salsa,SaxoBank, |
||
Sbanken, |
SBB Swiss Federal Railways, Schindler, SEB, SGS, |
|
Siemens |
Mobility, SimCorp, Skandia, Solvay, Sonae, |
Sonae Arauco, |
SpareBank 1 SMN, SpareBank 1 Østlandet, Sportmaster, Statkraft, Stedin, Steyr Mannlicher, Stora Enso, Styria Marketing Services, Suomen Terveystalo, Swedbank, Swisscom, Taylor Wimpey, TDC, Teamwork, Telefónica, Telekom Austria, Telenor Global Shared Services, Telia, Tesco, Tetra Pak, The Navigator Company, TIM, Tine, Tokmanni , TomTom, Tryg, TTS Group, TVH, Ubimet, UDG Healthcare, UniCredit, Unilin, UPM, Vaisala, Valmet, Valora Group, Van Lanschot, Vattenfall, Version 1, Visana, Vodafone Automotive, VodafoneZiggo, Voestalpine High Performance Metals, WABCO, WALTER GROUP, Western Bulk, William Demant, Wind Tre, WIT Software, Wolters Kluwer, Zurich Airport, Zurich Insurance, Öhman, Ørsted, Österreichische Post.
Note: Of all contributing companies, 14 chose to be anonymous
16 |
17 |

vk.com/id446425943
Setting the Scene
Bits and Bytes
What technologies and data solutions are within the scope of the study?
AI can be defined as the ability of a machine to perform cognitive functions which are normally associated with humans. This includes reasoning, learning, problem solving, and in some cases even exercising human behavior such as creativity.
Advanced AI applications are not yet widespread
AI holds the potential to transform business in a radical way given its wide variety of use. Quite simply, business leaders need to understand AI in order to grasp the opportunities and threats the technologies pose.
While companies acknowledge the significant potential of broader, more advanced AI technologies such as computer vision, speech recognition, and virtual agents, they are currently
not in common use by companies in Europe. Companies surveyed are currently focused on narrower and more specific use-cases that support existing business. These efforts will undoubtedly help companies build capabilities that are necessary to deploy more advanced AI solutions in the future.
Machine Learning
The most commonly used AI technology among the surveyed companies is Machine Learning. This is inarguably due to its wide-ranging applicability, making it relevant for a variety of
use-cases across the value chain. Of the different types of Machine Learning, the most common is supervised Machine Learning, where software is fed structured data and finds patterns that can be used to understand and interpret new observations.
While companies historically have primarily have used internal data for supervised Machine Learning, many have begun exploring the possibility of combining internal and external datasets in order to produce even deeper insights.
Machine Learning and Smart Robotics were found to be the most useful. It is not clear from the study if this is because they are simply the most common starting points before deploying more advanced technologies, or if they also longer term hold the most wide and sigificant application potential.
A broad definition of technologies are included in this AI definition
Technologies included in the definition of AI used in this study
Natural Language Processing
Computer interpretation, understanding, and generation of written natural human language.
Virtual Agents
Computer-generated virtual personas that can be used to interact with people in both B2C, C2B, and B2B contexts.
Speech Recognition
Enables computers to interpret spoken language and to transform it into written text or to treat it as commands for a computer.
Smart Robotics
The combination of AI and robots to perform advanced tasks compared to traditional non-intelligent robots.
18
Text Analysis
Computational analysis of texts, making it readable by other AI or computer systems.
Biometrics
Analysis of human physical and emotional characteristics – used also for identification and access control.
Machine Learning
A computer’s ability to ‘learn’ from data, either supervised or non-supervised.
Neural Networks and Deep Learning
Machines emulating the human brain, enabling AI models to learn like humans.
Computer Vision
Gives computers the ability to “see” images similar to how humans see.
Setting the Scene
Companies are using a combination of on-premise and cloud solutions
Companies are increasingly using cloudbased AI solutions for both storage and on-demand computing power - 83% of companies reporting using Cloud technology to some extent to enable their AI capabilities. Key benefits of cloud solu-
tions mentioned by many respondents are the flexibility to swiftly scale systems up and down to accommodate changing demand, a variable cost structure, and access to larger data sets. However, many companies are still relying on on-premise solutions, not least due to existing data infrastructure.
Machine Learning and |
Companies are using a mix of Data Sources and Storage |
Smart Robotics found to be |
Solution: How are you primarily dealing with the computing demands |
the most useful |
needed for AI? |
Which of the following technologies have |
Data Source: 1.Are you currently using unstructured or structured data |
you found to be most useful in your com- |
types in your AI process? 2.Are you currently using internal or external |
pany’s deployment of AI? |
data sources in your AI process? |
|
|
|
|
Data Source |
Solution |
77% |
44% |
40% |
|
|
|
Machine |
Smart |
Natural |
|
|
|
learning |
robotics |
language |
|
|
|
|
|
processing |
38% |
32% |
27% |
|
|
|
Internal |
Structured |
In Cloud |
39% |
39% |
26% |
|
|
|
Neural |
Text |
Virtual |
|
|
|
networks and |
analysis |
agents |
3% |
7% |
17% |
deep learning |
|
|
|||
|
|
|
External |
Unstructured |
On premise |
21% |
20% |
6% |
|
|
|
Speech |
Computer |
Biometrics |
44% |
43% |
56% |
recognition |
vision |
|
|||
|
Both |
Both |
Both |
||
Affirmative responses, 15 European markets |
|
Note: Remaining percent ‘Don’t know’ responses |
|||
|
|
|
|
|
19 |
vk.com/id446425943
Setting the Scene
Follow the Money
How much is invested in AI in Europe? |
|
Finland |
|
Norway |
$24M |
|
21 deals |
|
|
|
|
A few big AI transactions |
|
$30M |
|
5 deals |
|
influencing the overall picture |
|
|
Company AI investments in mUSD and transaction volume per market (accumulated 2008-2018)
Ireland
$39M
37 deals
$254M 


 73 deals

Sweden
|
$330M* |
|
|
21 deals |
|
$7262M |
Denmark |
|
|
||
533 deals |
The Netherlands |
|
United Kingdom |
||
|
||
|
$43M |
|
|
45 deals |
$110M |
$520M |
|
14 deals |
||
140 deals |
||
Belgium |
||
Germany |
||
|
|
|
|
|
$107M |
$75M |
|
|
|
|
31 deals |
|
|
|
|
|
17 deals |
|
|
|
|
$1357M |
Switzerland |
|
|
|
|
|
||
|
|
|
165 deals |
|
Austria |
|
|
|
France |
|
|
|
|
|
|
|
|
|
|
|
$3M |
|
|
|
|
|
8 deals |
|
$47M |
|
|
Portugal |
|
|
|
|
|
|
|
29 deals |
|
|
|
|
|
|
|
|
|
European |
$131M |
|
Italy |
|
|
|
|||
|
|
markets |
79 deals |
|
|
|
|
UK bubble size not represenative |
|
|
|
*Universal Robots acquired for $285M |
v |
|
|
||
|
|
|
|
|
|
The acquisition data from numerous sources enabled us to explore the European AI ecosystem and gain insights into investment activity.
An exponential increase in AI in- vestment over the past decade


Looking at AI transaction activity across Europe, there has been a steep consistent growth trend over the past 10 years, totaling 1,334 transactions involving AI by 2017 – with a six-fold increase in activity in the last 5 years
alone. This trend is on track to con- 
 tinue, with an exponential
 increase
in interest in AI driving more large companies to invest in AI or acquire AI bilities from innovative start-ups. Of 
the 15 markets surveyed, some include

 one or two transactions that are significantly large deals.
Majority of investments in AI from private equity and venture capital
Private equity (PE) and venture capital
(VC) firms are significantly more ac-
 tive investors and acquirers of AI than corporates, accounting for 75% of deal
volume in the last 10 years. This is an
indication that AI companies are in the
 early stages of high risk/high growth
 dynamics. It also indicates that, for
 large corporates, acquiring or investing in external AI businesses in order
to obtain AI capabilities is relatively limited. This is confirmed by our survey results where only 10% of companies are seeking to obtain needed AI capabilities through external investment or
Note: Several transactions in the dataset did not have publically disclosed deal values, suggesting that actual total values are higher than what’s shown above
20
Setting the Scene
acquisitions, and is also much in line |
TMT most active, behind private |
||||
with what we’re seeing when compar- |
equity and venture capital |
||||
ing with the US and Asia. |
Investments into AI companies per sector, |
||||
Investment activity concentrated in |
mUSD (accumulated 2008-2018)* |
||||
|
|
|
|
|
|
major European markets |
|
|
|
|
|
It comes as no surprise that a lot of |
|
|
|
|
|
investment activity is in the UK, France, |
|
|
|
|
|
and Germany, having attracted 87% of |
|
|
|
|
|
investment in AI companies over the |
|
|
|
|
$7,453M |
|
|
|
|
||
past decade. The UK leads significantly |
|
|
|
|
|
in this regard, with 533 of the total |
|
|
|
|
1,027 deals |
|
|
|
|
Private Equity / |
|
1,362 AI transactions in Europe. From |
|
|
|
|
Venture Capital** |
an investment perspective, it is also |
|
|
|
|
|
worth noting that in April 2018, the EU |
|
|
|
|
|
|
|
|
|
|
|
committed to a 70% increase in invest- |
|
|
|
|
|
ment in European AI by 2020, suggest- |
|
|
|
|
|
ing further growth and potential in the |
|
|
|
|
|
region. |
|
|
|
|
|
Steady increase in European AI investment |
|
|
|
|
$1,843M |
|||||
AI companies invested into, transaction volume, Europe (from 2008-2018)** |
|
|||||||||
|
|
|
|
|
|
|
|
|
|
220 deals |
|
|
|
|
|
|
|
|
|
|
TMT |
Number of |
|
|
|
|
|
|
|
|
|
$494M |
transactions |
|
|
|
|
|
|
|
|
|
17 deals |
|
|
|
|
|
|
|
|
|
|
Industrial Products |
450 |
|
|
|
|
|
|
|
|
|
$368M |
|
|
|
|
|
|
|
|
|
398 |
|
|
|
|
|
|
|
|
|
|
12 deals |
|
400 |
|
|
|
|
|
|
|
|
|
|
|
|
|
|
|
|
|
|
|
Infrastructure |
|
|
|
|
|
|
|
|
|
|
|
|
350 |
|
|
|
|
|
|
|
327 |
|
$254M |
|
|
|
|
Total |
|
|
|
|
|
|
300 |
|
|
|
investment |
|
|
|
|
21 deals |
|
|
|
|
$10.5bn |
|
|
|
|
Life Science |
||
|
|
|
|
|
|
|
|
|||
250 |
|
|
|
|
|
|
228 |
|
|
|
|
|
|
|
|
|
|
|
|
|
$70M |
200 |
|
|
|
|
|
|
|
|
|
41 deals |
|
|
|
|
|
|
148 |
|
|
|
Finance |
150 |
|
|
|
|
|
|
|
|
|
|
|
|
|
|
|
|
|
|
|
|
|
100 |
|
|
|
64 |
88 |
|
|
|
|
$38M |
|
|
|
|
|
|
|
|
|
10 deals |
|
50 |
|
29 |
|
|
|
|
|
|
|
CPR |
|
27 |
|
|
|
|
|
|
|
||
14 |
11 |
|
|
|
|
|
|
|
|
|
|
|
|
|
|
|
|
|
|
$22M |
|
0 |
|
|
|
|
|
|
|
|
|
|
|
|
|
|
|
|
|
|
|
|
14 deals |
2008 |
2009 |
2010 |
2011 |
2012 |
2013 |
2014 |
2015 |
2016 |
2017 |
Services |
Europe |
|
|
|
|
|
|
|
|
|
**Including governmental investment |
*For all of Europe, 34 countries (not just the 15 markets focused on in this report) |
|
|
|
|||||||
|
|
|
|
|
|
|
|
|
|
21 |

vk.com/id446425943
Artificial intelligence in Europe ( Case Study )
Ageas
Ageas is currently using various forms of AI, while also investigating the potential to use even more. For its daily operations, AI models are used to forecast many aspects of the business. These forecasts are used by Ageas employees to make informed decisions. Ageas currently has
over 100 internal predictive analytics projects running or in the pipeline for the coming two years, of which more than 10 have already been implemented into the business.
However, for Ageas the most interesting aspect of AI lies in its ability to process unstructured data. Ageas has begun using AI to analyze customer photos to estimate the damage of
cars in insurance claims, which frees Ageas from having to send investigators to assess the damage. This application of AI makes the process significantly faster and more convenient for both the client and Ageas. The appli-
cation of image analytics started in the UK and is now being quickly rolled out to its other markets due to its success.
Ageas is also anticipating going beyond pictures, towards AI that can interpret videos. Furthermore, Natural Language Processing (NLP) is being applied in call centers and will soon play a pivotal role in transforming cus-
tomer service. Ageas is implementing Artificial Intelligence in client-facing areas to respond quickly and accurately, while freeing up employees to focus on the most critical aspects of the business. The key problem it faces with many AI technologies is their dependence on language. For example, a successful sys-
tem implemented in the UK cannot be simply transferred and implemented in Belgium or Portugal.
Ageas is a Belgium-based insurance company, employing over 50,000 people globally to serve 39 million customers across 15 countries, predominantly in Europe and Asia. With over 3 million clients in Belgium, almost 1 in 2 Belgians households are customers of Ageas, making it a market leader in life insurance and number
2 in non-life. Its revenue in Belgium was over €5 billion in 2017. Ageas is also a major player in auto insurance and travel insurance in the UK.
What next?
Going forward, Ageas will expand its AI initiatives to scale early successful use cases with intelligent automation in the frontend and back-end of the business. The goal of this is to further automate processes and increase the efficiency of employees on a large scale by empowering them with AI tools. Ageas is
progressively rolling out an AI-driven system aimed at forecasting what employees need and pushing it to them. The system will also play an important role in systemically mining the knowledge embedded in the company.
We believe that AI will bring significant disruptions, such as enabling self-driving cars. If cars can become self-driving, why would there be a need for personal insurance?
You need experts that truly know the technological playing field. You have to work with PhDs that understand both technology and semantics. These people are hard to find, they know they are precious on the market and they are typically more willing to join start-ups.
Setting the Scene
Expert Perspective
What does the future look like according to AI analysts?
We also spoke to a range of leading AI experts from business and academia to gain insights into the kind of change which we are on the cusp, and the
role AI is expected to play as part of a broader transformational wave.
AI is entering the mainstream and here to stay
One thing was clear from the experts we spoke to: as far as the peaks and troughs of hype and technological leaps surrounding AI go, there is no doubt that we are living through a particularly prominent peak, with no indication that the buzz nor the potential will fade away any time soon. In a world increasingly dominated, disrupted and driven by innovative tech powerhouses, large and small, it is no understatement to suggest that AI will be a chief protagonist in the change transcending all elements of business in what has been labelled the Fourth Industrial Revolution.
Business-minded people will drive the transformation
The AI experts confirmed some of the key ingredients necessary for AI in organizations: a combination of domain and technical expertise, the appropriate technology, the right talent, and lots and lots of data. While letting tech-savvy individuals drive innovation is great for building understanding, true transformation will not come until business people start suggesting problems for AI to solve - not the other way round.
Agile culture enables AI
Culture was a recurring theme as well.
It can either stifle forward momentum in organizations, or be the silver bullet that enables the potential of AI to be realized from top to bottom.
Some of the experts even argue that it’s not only technical skills that hold up AI projects, it’s also the need for a culture of experimentation.
Companies that are more natively digital or have gone down that road understand the value of experimenting and iterating. They don’t think in traditional terms of committing to yearlong projects that need to produce specific outputs, but rather to explore and test ideas before scaling.
When it comes to AI, knowledge is power
Expert opinion also seemed unanimous in that most people not directly involved with AI must still have quite a basic understanding of what AI is and what it can actually do. Therefore, the
task is to educate and improve understanding, from C-suite leadership teams to employees at the coal face. This also ties in with the importance of partnering to get started and access the expertise needed to use AI. While partnering and collaborating solves the perennial AI challenge concerning the scarcity of talent, the significant cost and substantial benefit that can be gained from AI means that organizations also need to be cognizant of building capabilities in-house for the long-term.
Finally, as AI develops, we are also going to see innovation and expertise spreading outside of the dominant clusters of the likes of Silicon Valley, as governments, businesses and universities increasingly invest in building knowledge, resources and capabilities.
Farmers and growers are still reasonably conventional, with an average age of 55 years. The chances are that this will change significantly in the future. It could just be that technology companies will become the disruptors of our market.
—Royal Agrifirm Group
Agricultural cooperative
22 |
23 |

vk.com/id446425943
Setting the Scene
From the Horse’s Mouth*
*From the highest authority
The full extent of the AI story remains in its early stages. What we do know is that big data, computing power and connectivity are changing the industrial landscape. The opportunity rests in accelerating the digitization of businesses, making them more data driven by building applications that deliver machine-assist- ed insights.
— Mona Vernon, CTO, Thomson Reuters Labs
In some cases, there is too much hype, but paradoxically, the potential opportunities and benefits of AI are still, if anything, under-hyped. Often, the impact of new technologies is overestimated in the short term and underestimated in the long term, and while there is a lot of noise regarding AI, there’s been a lack of in-depth discussion and analysis of how it’s actually going to transform businesses.
— Nigel Duffy, Global AI Innovation Leader, EY
Setting the Scene
We believe that every organization is going to have to write their own AI manifesto: what they believe about AI, how they’re going to use or not use data, how they’re going to publish data, and make the consumers of their products and services aware of that. The creation of those manifestos is going to become a gateway to the success of AI.
— Norm Judah, Chief Technology Officer of Worldwide Services at Microsoft
If you have a ton of data, and your problem is one of classifying patterns (like speech recognition or object identification), AI may well be able to help. But let’s be realistic, too: AI is still nowhere near as flexible and versatile as human beings; if you need a machine to read, or react dynamically, on the fly, to some kind of ever changing problem, the technology you seek may not yet exist. Intelligence is a really hard problem.
— Gary Marcus, Founder & CEO, Geometric Intelligence, and Professor, New York University
AI is a general purpose technology, so will eventually affect all industries. However, this impact can be slowed by the lack of data in particular industries. There’s also more innovative cultures inside different organizations, that can either drive adoption or prevent it.
— Marc Warner, CEO, ASI Data Science
24 |
25 |

vk.com/id446425943
Artificial intelligence in Europe
Role of AI
in European
Business
There is a lot of hype surrounding AI at the moment, and few doubt its potential. We examine how important is AI compared to other digital priorities and where AI fits on the strategic agenda.
We look at the impact of AI on the company’s core business, as well as adjacent and new areas of business.
We also examine the current AI maturity levels across sectors and markets, the potential drivers for deploying AI, and where AI is applied within organizations, across customer-facing functions, operations, product development, and internal business support.
Role of AI in European Business
A Strategic Agenda
Where is the AI conversation currently taking place?
A good starting point to understand how large European companies are handling AI is to look at who in the organization is driving the AI agenda, whether it be the Board, the C-suite, managers, or employees.
AI is particularly relevant at higher organizational levels
From driving strategic considerations at the Board level to being a topic of interest or concern at the employee level, the results are clear: AI is important and resides across all levels at many of the organizations we interviewed.
Only a few companies stated that AI is not currently an important topic at any level of the organization - while the vast majority of companies view AI as generally important regardless of how advanced they are, or how much AI is being considered for deployment in the near future.
Active C-suite and Board of Directors involvement
In 71% of the companies surveyed, AI is already an important topic on the C-suite agenda and across various roles - from cost-focused CFOs looking for efficiency through automation, to
CDOs with customer-oriented ambitions as part of wider digitalization efforts, to the CTOs who is often still responsible for a type of AI Center of Excellence.
Companies more advanced in AI tend to have stronger involvement of the C-suite and the Boards of Directors than the rest. They focus less on the technology itself and more on the business problems that AI can addresses. Relatively speaking, the AI topic seems to not yet having reached the same level of importance at the non-mana- gerial level (employees) than at the top.
Speculating about the reason, it could both pertain to job insecurity and to the fact that AI is still a highly abstract topic for many when it comes to proving day-to-day business value.
AI is an important topic on the C-suite level in particular
On what hierarchical levels in your company is AI an important topic?
STRATEGIC LEVEL |
|
|
|
|
|
|
Board |
|
|
|
38% |
|
|
|
|
||
|
of Directors |
|
|
|
|
|
level |
|
|
|
|
|
Executive |
|
|
|
|
|
Management |
|
|
|
71% |
|
level |
|
|
|
|
|
Managerial |
|
|
||
|
|
|
56% |
||
|
level |
|
|
|
|
|
Employee |
|
|
|
|
|
(non managerial |
|
|
28% |
|
|
level) |
|
|
|
|
|
|
|
|
|
|
OPERATIONAL LEVEL |
|
|
|
|
|
AI is in particular an important topic at the Executive Management level
Affirmative responses, 15 European markets
26 |
27 |
vk.com/id446425943
Role of AI in European Business
Among Friends
What is the importance of AI against other digital priorities?
In a business era driven by innovation and tech-led disruption, AI is obviously not the sole priority.
AI as a digital priority
When asked on a scale of 1 to 5 how important AI is to the business relative to other digital priorities, the majority of respondents told us that it is about equal. Very few organizations said it was their most important digital priority, or not formalized as a digital priority at all, with the spread of responses leaning slightly towards the upper end of the importance spectrum.
This slant is likely to increase as many companies expect AI to become more important, as the technology develops and use-cases become more clear to companies.
The participating companies are generally in the process of understanding the potential of existing data, including to what extent it can be used, what it can be used for, and how to capture and leverage it.
Furthermore, many of the companies are focused on building the appropriate data infrastructures or modernizing legacy systems as a top digital priority, both being prerequisites
for introducing AI into the company. Considering that AI is heavily reliant on data as its fuel, this development suggests that the foundations are being laid for further AI integration in the years to come.
AI is seen as one of many digital priorities - but rarely the most important
How important is AI relative to your company’s other digital priorities? |
|
|
The majority consider |
||||
|
|
|
|
|
|
|
AI to be important |
|
|
|
|
44% |
|
|
Avg. Score |
|
|
|
|
|
28% |
|
|
|
|
|
|
|
|
|
|
9% |
12% |
|
|
7% |
3.1 |
||
|
|
|
|
|
|
|
|
1 |
2 |
3 |
4 |
5 |
|
||
|
|
Not important |
|
Important |
|
Most important |
|
|
|
AI is not formalised |
|
AI is one of many |
|
AI is the most important |
|
|
|
as a digital priority |
|
digital priorities |
|
digital priority |
|
|
|
15 European markets |
|
|
Note: Remaining percent ‘Don’t know’ responses |
||
|
|
|
|
||||
|
|
|
|
||||
Role of AI in European Business
Push or Pull
How is AI predominately deployed into the organizations?
To understand the drivers behind the adoption and deployment of AI in the companies, we took a closer look at how AI is approached in a top down-bottom up management context, and from a functional techvs. business driven dynamic.
AI driven from a combination of top down and bottom up
Contributing companies are quite evenly split across deploying AI as a top down process, as a bottom up, or as a combination of the two. However, when looking at the self-reported most advanced companies, they are more top down than bottom up in their approach. It was clear from speaking with them, that this is partly a result of AI being increasingly important enabler in the company, and playing an increasingly significant role in the the overall strategy.
AI driven from a combination of technology push and business pull
According to a large part of the companies and despite still being a technically complex thing that requires many specially skilled employees, AI is most often deployed as a combination of business pull and technology push.
This resonates well with one of the most consistent inputs from the executives on the most sought after AI profiles which centered in on the hybrid profile that understand the business needs and the ability to match them to the technological possibilities.
AI deployed and managed in a balanced way
How would you characterize the way AI is being managed in your company? How would you characterize the way AI is being deployed in your company?
Top Down |
Bottom up |
Both |
Approach |
34% |
29% |
28% |
||
|
|||||
Deployment |
Business Pull |
|
IT Push |
|
Both |
|
|
||||
|
|
||||
|
|
||||
|
|
|
|||
24% |
23% |
45% |
15 European markets
Note: Remaining percent ‘Don’t know’ responses
28 |
29 |

vk.com/id446425943
Role of AI in European Business
Ready, Set...
What is the maturity of AI in different sectors?
We have multiple sources of ideas for AI. They can come from the business but also from data science teams presenting different possibilities in a proactive approach, as these are new skills within the company. At the end, there has to be agreement between both groups to sign off on AI projects.
—Tetra Pak
Food processing and packaging
While working with AI should be considered a continuous journey, the AI maturity of surveyed companies provides a tangible indication of the level of advancement of current initiatives.
Multiple use cases, limited scalability and advanced use
The majority of companies have begun exploring use-cases, while some companies have made early investments with the intention of taking a leading position in AI. The levels of advancement also vary in that some companies are focusing on narrow use-cases to support their existing business, while others are taking an explorative approach. Among the small group of companies with no or only little AI activity to date, several respond that they are planning to drastically ramp up efforts soon.
Technology immaturity and internal data quality are key obstacles
Many companies that have already implemented AI initiatives in their businesses are seeing tangible benefits.
Consequently, many of them are exploring more use-cases and structuring their learnings from previous AI projects into a modus operandi that can speed up new initiatives.
Meanwhile, a substantial number of companies have intentionally chosen to take a ‘follower’ position, reporting the perceived immaturity of AI technologies as a key reason. Another reported obstacle to rolling out broader AI initiatives are rooted in data and data infrastructure, where companies have separate projects aimed at improving
the structure of existing data, collection of new data, and data access in general. However, the trend is clear:
AI maturity is on the rise as adoption of key technologies accelerates and internal capabilities grow.
The vast majority of European businesses are currently either conducting pilot projects to test selected usecases, or have commenced implementing AI in the business. When talking with executives, it is evident that many companies are struggling with how to integrate pilot projects into daily operations.
Clear sector patterns, with TMT, Services, and Finance on top
Companies currently leading the way in terms of AI maturity are in TMT, Services & Hospitality, and Financial Services. Companies in those sectors gravitate towards grading their AI maturity as ‘Released’ (AI in active use, though selectively or not with very advanced tasks), or ‘Advanced’ (AI actively contributing to many processes and enabling advanced tasks). A logical explanation for the maturity in TMT and Finance is their tendency to be digitally advanced and more savvy with analytics, favoring these companies to progress beyond piloting by having data science capabilities in place to evolve towards more advanced AI stages.
Infrastructure and IP with relatively many projects in ‘piloting’ phase
The Infrastructure and Industrial Products sectors both stand out as having no companies responding that they are ‘Advanced’ in AI at this stage.
Role of AI in European Business
TMT sector with largest percentage of companies that are either released or advanced
How would you describe your company’s general AI maturity? Sectors arranged by maturity based on Advanced and Released
TMT |
|
2% |
10% |
|
|
|
|
|
|
40% |
|
|
|
|
|
|
|
45% |
|
|
|
|
|
|
|
2% |
|
||||||||
Services |
|
|
|
|
|
|
|
|
|
|
|
|
|
|
|
|
|
|
|
|
|
|
|
|
|
|
|
|
|
||||||
|
|
|
|
|
|
|
|
|
|
|
|
|
|
|
|
|
|
|
|
|
|
|
|
|
|||||||||||
|
5%6% |
|
|
22% |
|
|
|
|
27% |
|
|
|
|
|
27% |
|
18% |
|
|
|
|
|
|||||||||||||
Finance |
|
|
|
|
|
|
|
|
|
|
|
|
|
|
|
|
|
|
|
|
|
|
|
|
|
|
|
|
|
|
|
||||
|
|
|
|
|
|
|
|
|
|
|
|
|
|
|
|
|
|
|
|
|
|
|
|
|
|
|
|
|
|
|
|
|
|
|
|
|
4% |
|
|
|
22% |
|
|
|
|
34% |
|
|
|
|
|
36% |
|
|
|
|
|
|
4% |
|
|||||||||||
Infrastructure |
|
|
|
|
|
|
|
|
|
|
|
|
|
|
|
|
|
|
|
|
|
|
|
|
|
|
|
|
|
|
|
|
|
|
|
|
|
|
|
|
|
|
|
|
|
|
|
|
|
|
|
|
|
|
|
|
|
|
|
|
|
|
|
|
|
|
|
|
|
|
|
|
5%9% |
|
|
21%17% |
|
|
|
32% |
46% |
|
|
|
|
|
|
|
|
28% |
|
|
|
|
|
|
|||||||||||
Industrial Products |
|
|
|
|
|
|
|
|
|
|
|
|
|
|
|
|
|
|
|
|
|
|
|
|
|
|
|
|
|
|
|
|
|
|
|
|
|
|
|
|
|
|
|
|
|
|
|
|
|
|
|
|
|
|
|
|
|
|
|
|
|
|
|
|
|
|
|
|
|
|
|
|
4% |
|
|
|
21%25% |
|
|
|
|
|
|
|
|
53%44% |
|
|
|
|
|
21% |
|
|
|
|
|
|
|||||||||
Life Science |
|
|
|
|
|
|
|
|
|
|
|
|
|
|
|
|
|
|
|
|
|
|
|
|
|
|
|
|
|
|
|
|
|
|
|
|
|
|
|
|
|
|
|
|
|
|
|
|
|
|
|
|
|
|
|
|
|
|
|
|
|
|
|
|
|
||||||
|
4%7% |
|
|
25% |
|
|
|
|
|
45% |
49% |
|
|
|
|
|
34% 17% |
|
|
4% |
|
||||||||||||||
CPR |
|
|
|
|
|
|
|
|
|
|
|
|
|
|
|
|
|
|
|
|
|
|
|
|
|
|
|
|
|
|
|
||||
|
|
|
|
|
|
|
|
|
|
|
|
|
|
|
|
|
|
|
|
|
|
|
|
|
|
|
|
|
|||||||
|
|
|
|
|
|
25% |
|
|
|
|
29% |
|
|
|
|
|
|
29% |
|
|
9% |
|
9% |
|
|
||||||||||
|
|
|
|
|
|
|
|
|
|
|
|
|
|
|
|
|
|
|
|
|
|
|
|
|
|
|
|
|
|||||||
|
0% |
|
|
|
|
20% |
|
|
40% |
|
60% |
80% |
|
|
|
|
100% |
||||||||||||||||||
|
|
|
|
None |
|
|
|
Planned |
|
|
|
|
|
Piloting |
|
Released |
|
|
Advanced |
||||||||||||||||
|
|
|
|
|
|
|
|
|
|
|
|||||||||||||||||||||||||
This indicates slower technology adoption lead times in these slightly more conservative sectors. Yet, with 74% of companies being in the ‘Piloting’ or ‘Released’ phases, the Infrastructure sector also seems to be evolving onto more advanced AI maturity.
Life science and CPR have fewest released projects
Consumer Products & Retail companies have a broad spread in terms of AI maturity, where 25% state they have no plans at present for how and when to use AI – much higher than other sectors – while others in the same sector are already at the ‘Released’ or
‘Advanced’ stage of AI maturity. Several companies in both Consumer Products & Retail and Services & Hospitality cite the challenges of knowing what relevant AI technologies are available, utilizing unstructured data, as well as affording the payback period where there may be large upfront costs and undetermined returns on investment.
30 |
31 |

vk.com/id446425943
Role of Ai in European Business
AI Maturity Curve
Majority of companies are in the ‘Piloting’ or ‘Released’ stage
We asked companies to self-report their current AI maturity level, grading themselves at None, Planned, Piloting, Released, or Advanced - as defined below.
LEVEL OF MATURITY
Advanced
AI is actively contributing to many processes in the company and is enabling quite advanced tasks
Released
AI is put to active use in one or a few processes in the company, but still quite selectively, and/or
not enabling very advanced tasks
Piloting |
59 / 269 |
AI is put to active use, but still |
(22%) |
|
|
only in early stage pilots |
|
|
20 / 269 |
Planned |
(7%) |
|
|
AI is being planned, but not yet |
|
put to active use, not even in |
|
early stage pilots |
|
None
Not yet thinking about AI
15 European markets
Role of Ai in European Business
10 / 269 74/ 269 (4%) (28%)
106 / 269
(39%)
32 |
33 |

vk.com/id446425943
Role of AI in European Business
State your Business
Where is AI currently deployed across the companies’ value chains?
Looking at the business functions that most commonly use AI provides a good indication of where companies are placing their bets. These functions are driving the company AI agenda, influencing the future direction of the company’s AI efforts.
Many AI in R&D and IT/Digital functions
On top of an expected high prevalence of AI within IT departments, AI is also commonly used within R&D functions. This primarily comes down to three factors: employees in R&D are often engineers who tend to have a good understanding and appreciation of AI; the R&D function is often already wired
towards taking an experimental, agile approach which is key to AI; and the
R&D function often sits on significant amounts of useful data leading to high potential use-cases.
Online customer interactions generating front-end data
Customer-facing, commercial functions such as Marketing, Sales and Customer Service are also heavier users of AI, partly driven by their digitization levels. Although AI is generally adopted more slowly in customer facing interactions than in back-end functions, the abundance of data from increased use of online channels is expected to make these functions obvious candidates for
AI technologies in the future. Operations and back-end functions use AI to increase efficiency by automating processes and informing decision-making. The key enabler is data infrastructure, and many companies – currently limited by legacy systems and processes that impede capture and retrieval of data – need to upgrade their infrastructure.
AI most commonly applied in IT & R&D functions
Which of your company’s business functions currently use AI?
6% |
|
4% |
7% |
|
14% |
|||||
|
|
Strategy |
|
General Management |
|
|
HR |
|
|
Admin / Finance |
|
|
|
|
|
|
|
||||
|
|
|
|
|
|
|
||||
|
|
|
|
|
|
|
|
|||
Group
Affirmative responses, 15 European markets
36% |
9% |
||||
|
|
R&D / Product Development |
|
|
Product Management |
|
|
|
|
||
|
|
|
|
||
|
|
|
|
||
Product
Limited use in HR and Procurement
There are several functions where AI is hardly in use among the participating companies. This includes people- ‘intensive’ functions such as HR and Procurement. This is not due to lack of potentially valuable AI use-cases, which in the case of HR include talent acquisition (avoiding human bias), onboarding (Q&A), performance evaluation (analyzing data), etc. but rather seems to be a result of prioritizing other functions and priorities first.
Role of AI in European Business
We can increase productivity, increase our service level, provide new values, transform the way we work and interact with costumers and suppliers. AI is an opportunity to offer smarter solutions than competitors and increase market relevance.
—Walter Group
Logistics and supply chain
|
4% |
12% |
23% |
47% |
22% |
19% |
24% |
|||||||||||||
|
|
Procurement |
|
|
Manufacturing |
|
|
Operations / Logistics |
|
|
IT / Technology / Digital |
|
|
Marketing |
|
|
Sales |
|
|
Customer Service |
|
|
|
|
|
|
|
|
|
|
|
|
|
|
|||||||
|
|
|
|
|
|
|
|
|
|
|
|
|
|
|||||||
|
|
|
|
|
|
|
|
|
|
|
|
|
|
|||||||
|
|
|
|
|
|
|
|
|
|
|
|
|
|
|
||||||
|
|
|
|
Operations |
|
|
|
|
|
|
Commercial |
|
|
|
||||||
|
|
|
|
|
|
|
|
|
|
|
|
|
|
|
|
|
|
|
|
|
34 |
35 |

vk.com/id446425943
Artificial intelligence in Europe ( Case Study )
TomTom
For TomTom, the constant need to |
|
teams working in partnership with very |
mapping vehicles, community input |
||
revise its comprehensive digital maps |
efficient, increasingly intelligent soft- |
from hundreds of millions of users |
|||
that are delivered to its customers on |
ware. |
globally and GPS probe data from 550 |
|||
a weekly basis means that the ques- |
|
million connected devices, TomTom’s |
|||
tion is how quickly, not whether, it |
|
The changes made to TomTom’s digital |
employees work with AI to leverage |
||
can integrate AI into its operations. |
|
maps include a complex mixture of ge- |
this wealth of data in its mapping prod- |
||
TomTom now makes up to 1.5 |
|
|
|
ucts. What used to require |
|
billion updates to its digital |
|
|
|
thousands of hours of manual |
|
maps a month in its efforts |
What used to require thousands of hours |
interpretation is now increas- |
|||
to support its customers in a |
ingly automated, meaning |
||||
of manual interpretation is now increas- |
|||||
world that increasingly relies |
TomTom employees can be |
||||
on digital maps as accurate |
ingly automated, meaning TomTom em- |
dramatically more productive |
|||
representations of reality. |
ployees can be dramatically more pro- |
in updating the platform. |
|||
The challenge of updating |
|
ductive in updating the platform. |
|
TomTom realizes this is the |
|
its digital maps is concerned |
|
|
key to staying competitive |
||
|
|
|
|||
with volume, quality and lead |
|
|
|
as it moves towards a future |
|
time – in other words need- |
|
|
|
of mobility that will involve |
|
ing to make lots of accurate changes as |
ometry and road features, from points |
real-time updates of digital maps and |
|||
quickly as possible. With 570 updates |
of interest and altered road junctions |
autonomous vehicles which are ena- |
|||
made every second, this would not |
|
to new addresses and traffic signs. |
bled by a high quality understanding of |
||
be possible without TomTom’s human |
With laser radars on its fleet of mobile |
their surroundings. |
|||
TomTom is one of the global leading navigation solutions companies, offering navigation products, software and services. The company is headquartered in the Netherlands, where it is listed on the Amsterdam stock exchange. TomTom has more than 4500 employees around the globe. In 2017, TomTom had €903 million in revenue, of which 46% stemmed from consumer products, 36% from automotive & enterprise, and 18% from telematics. The majority of TomTom’s business is in Europe, in which it is the market leader.
What next?
AI is set to play a crucial role in the near future as an enabler of accurate and scalable data processing, with an ultimate aim of real-time updates to TomTom maps. This will help TomTom
offer its users a safer and more comfortable driving experience. Further, with a growing number of sensors and devices on vehicles everywhere, this exponentially growing volume of traffic data, paired with increasingly powerful processing solutions, can bring TomTom’s technology a step closer to enabling safe autonomous driving vehicles.
We process and interpret trillions of data |
We don’t see any limitations due to regulation |
points - when all cars on the A1 highway |
at the moment. However in our branch where |
suddenly move 30 meters to the right, then the |
we are collecting data, regulations are a very |
road has probably been changed. |
important topic. |
Artificial Intelligence in Europe
Business
Benefits and
Risks
As a number of industries are beginning to reap the benefits of AI, we investigate what AI is actually doing for businesses today and what is expected in the future.
We look at how big an impact executives expect AI will have in terms of driving growth or causing disruption in their industry, and examine AI’s basic and more advanced uses - highlighting examples of these functionalities in operational mode.
We also present a strategic approach to understanding AI’s four benefit domains from a business perspective, summarizing the value executives expect to generate by using AI, and touching on what business leaders see as the most prevalent business risks.
36 |
37 |

vk.com/id446425943
Business Benefits and Risks
Another World
What is the expected impact from AI within the next 5 years?
Of the surveyed companies, 81% believe that AI will have a high or significant impact on their industry within the next five years. Digging deeper into the data, many of these companies expect AI to fundamentally change their competitive landscape, driven by increasing risk of competition, including from new types of start-ups and companies from adjacent industries. The majority of companies also believe that AI will play a key role in their efforts to continuously cut costs to stay competitive.
Strongholds and premiums to change as AI gains ground
Many companies expect competition to intensify due to the ‘winner takes all’ dynamic often associated with the massive scale that AI and digital can create.
They also expect significant impact on their products, increasingly in the form of new services, and they believe the speed of developing new products and taking them to market will drastically decrease - making current competitive strongholds less viable in the long-term.
This is particularly clear in R&D intensive sectors such as Pharma, where big datasets and intelligent algorithms to speed up the drug discovery process (10x mentioned as realistic) can impact the dynamics towards existing peers, while new AI based entrants (e.g., intelligent devices) can influence how premiums are distributed in future value chains.
Across sectors, executives expects significant impact
Services comes out on top in the ‘High Impact’ category, but all sectors expect a significant degree of impact from AI.
An overwhelming share also anticipate that AI will result in entirely new products, services, and business models.
Companies from Industrial Products and CPR expect relatively least ‘high’ impact from AI, but even in these sec-
tors, more than 30% expect the industry to be disrupted.
Limited sync of maturity and expected impact
The biggest disparity is within Finance, specifically Pension and Insurance, where ambitious companies are making significant investments in building data infrastructure and AI capabilities, while others are taking a waiting stance, and will jump on the AI train when the technology is more mature.
In the opposite end of the expected impact scale, Ireland, Austria, and Spain, in that order, are the countries where most companies expect only ‘some’ impact from AI or less.
Services the sector with the highest expected impact from AI
How much impact do you expect AI will have on your industry within the next 5 years?
Services |
Infrastructure |
Life Science |
Finance |
TMT |
Industrial Products |
CPR |
100% |
|
|
|
|
|
5 |
|
|
|
|
|
|
33% |
80% |
|
|
|
|
33% |
|
43% |
42% |
40% |
40% |
|
4 |
|
|
|
|
|
|
|
|
50% |
|
|
|
|
|
|
60% |
|
|
|
|
|
3 |
|
|
|
|
|
|
44% |
|
30% |
|
|
|
46% |
|
40% |
|
|
|
|
2 |
|
|
|
|
45% |
|
||
|
|
|
|
|
|
|
|
|
|
47% |
|
|
|
39% |
|
54% |
|
|
|
|
20% |
|
|
|
|
|
1 |
|
24% |
|
|
|
|
|
|
|
|
9% |
10% |
21% |
17% |
|
|
|
|
|||
11% |
|
|
|
|
|
|
|
|
|
|
|
3% |
|
|
|
4% |
|
5% |
|
|
0% |
3% |
4% |
|
3% |
||
|
|
|
||||
|
|
|
|
|
Significant impact
AI will disrupt the industry, resulting in entirely new products, services, and business models
High impact
Some impact
AI will create significant industry change to the industry, but key structures will remain as is
Limited impact
No impact
AI will not recognizably change products, services and business models in the industry
Don’t know
38
Business Benefits and Risks
Some country variation with regards to expected impact from AI
When approaching impact from a country perspective, the tendency remains; there are very high expectations across the board. Sweden, Switzerland, and Italy are the countries where most companies expect ‘significant’ or ‘high’ impact from AI. Although Portugal stands out as the country where the largest share of companies expect
‘significant impact’ impact from AI, the result is very different if consolidating-
with the ‘high impact’ expected category as well.
In the opposite end of the expected impact scale, Ireland, Austria, and Spain, in that order, are the countries where most companies expect only ‘some’ impact from AI or less. Noticeably, Finland has the lowest share of companies expecting ‘significant impact’. As with Portugal, the result is very different if consolidating with the ‘high impact’ category.
Every industry and every aspect will be affected by AI. At least for machine learning, it is like statistics on
steroids and shown to be very powerful. There is a risk that many business areas will be disrupted fully. But this is also the opportunity.
—Postnord postal services
High expected impact from AI consistently across countries
How much impact do you expect AI will have on your industry |
|
|
|
|
|
|
|||||||
within the next 5 years? |
|
|
|
|
|
|
|
|
|
|
Portugal has the high- |
||
|
|
|
|
|
|
|
|
|
|
|
|
|
est share of companies |
|
|
|
Netherlands |
|
|
|
|
UK, France & Germany |
|
Belgium & Luxemburg |
Switzerland |
|
expecting ‘significant |
Portugal |
|
Norway |
Sweden |
Denmark |
|
|
|
|
impact’ from AI |
||||
Italy |
Spain |
Ireland |
Austria |
Finland |
|
||||||||
100% |
|
|
|
|
|
|
|
|
|
|
|
|
5 |
|
|
|
|
|
|
|
|
|
|
|
|
9% |
Significant impact |
|
|
|
|
|
|
|
|
|
|
|
|
|
AI will disrupt the industry, re- |
|
|
|
|
|
|
|
|
|
|
|
25% |
|
sulting in entirely new products, |
|
|
|
|
|
|
|
|
|
33% |
29% |
|
services, and business models |
|
|
|
|
|
|
|
|
|
|
|
|
|||
|
|
|
|
|
|
|
|
|
|
|
|
|
|
80% |
|
|
|
403% |
40% |
40% |
40% |
35% |
|
|
|
|
4 |
|
|
|
|
|
|
|
|
||||||
|
|
48% |
45% |
|
|
|
|
|
|
|
|
|
High impact |
|
55% |
|
|
|
|
|
|
|
|
|
|
||
|
|
|
|
|
|
|
|
|
|
|
|
|
|
64% |
|
|
|
|
|
|
|
|
|
|
|
|
|
60% |
|
|
|
|
|
|
|
|
|
|
|
|
3 |
|
|
|
|
|
|
|
|
|
|
|
|
|
Some impact |
|
|
|
|
|
|
|
|
|
33% |
|
|
77% |
AI will create significant |
|
|
|
|
|
|
|
25% |
|
|
|
change to the industry, but key |
||
|
|
|
|
|
|
|
|
|
|
|
|||
|
|
|
|
|
|
|
|
|
|
|
|
||
|
|
|
|
|
|
|
|
42% |
|
57% |
65% |
|
structures will remain as is |
|
|
|
|
|
|
35% |
|
|
|
|
|||
40% |
|
|
|
|
|
|
|
|
|
|
|
|
|
|
33% |
|
|
|
|
|
|
|
|
|
|
2 |
|
|
|
|
|
48% |
|
|
|
|
|
|
|
Limited impact |
|
|
|
|
41% |
|
|
|
|
|
|
|
|
||
|
|
|
|
|
|
|
|
|
|
|
|
|
|
|
|
|
|
50% |
|
|
|
|
|
|
|
|
|
18% |
35% |
|
|
|
|
|
|
|
|
|
|
|
|
20% |
|
|
|
|
|
15% |
35% |
|
29% |
|
|
|
1 |
|
|
|
|
|
|
|
|
|
|
|
No impact |
||
|
|
14% |
|
|
|
|
|
22% |
|
|
|
|
AI will not recognizably change |
|
|
|
|
|
|
|
|
|
|
|
products, services and business |
||
18% |
5% |
|
|
5% |
|
|
|
|
|
|
5% |
|
|
|
14% |
|
5% |
|
|
|
14% |
14% |
models in the industry |
||||
|
|
12% |
|
|
|
||||||||
|
|
|
|
|
|
|
|
|
|
|
|
|
|
0% |
5% |
5% |
|
5% |
|
5% |
|
|
5% |
|
5% |
|
Don’t know |
|
|
|
|
|
|
|
|
|
|
|
|
||
15 European markets
39

vk.com/id446425943
Business Benefits and Risks
AI Here, There, Everywhere
What is the proximity of AI’s future impact to core business?
Companies expect impact across all horizons
To what degree do you expect AI will create impact for your company within each of the following areas?
Avg. Score
Core Business |
|
|
|
|
|
Primary areas of |
|
29% |
28% |
37% |
|
|
|
|
|||
|
|
|
|
4.0 |
|
the company’s |
|
|
|
|
|
|
|
|
|
|
|
current business |
1% |
4% |
|
|
|
|
|
|
|
|
|
Adjacent Business |
|
|
|
|
|
Business areas on |
|
31% |
33% |
|
|
|
|
22% |
|
||
|
|
|
3.7 |
||
the edge of the |
|
|
|
||
|
7% |
|
|
||
company’s core |
1% |
|
|
|
|
business |
|
|
|
|
|
New Business |
|
|
|
|
|
Business areas |
|
22% |
24% |
32% |
|
|
|
3.8 |
|||
entirely new to |
|
10% |
|
|
|
|
|
|
|
|
|
the company |
3% |
|
|
|
|
1 |
2 |
3 |
4 |
5 |
Not at all |
|
To some degree |
|
To a very high degree |
15 European markets |
|
|
Note: Remaining percent ‘Don’t know’ responses |
|
Many of the participating companies are expansive, with diversified business units offering a range of products and services. We questioned where they expect AI to have an impact - in their core, adjacent and/or new business.
AI will impact across the board, but less consensus on timelines
Companies expect AI to have a relatively equal impact on core, adjacent and new areas of their business. In interviews, they say impact depends on the timeline, for instance AI impacting the core business now, but adjacent and new business later on. The range of answers for “Adjacent” and “New” across
Europe are more split and contain more “Don’t Know” responses than for “Core”
– perhaps because there is an inherent challenge in making predictions about AI’s impact on new business areas where business results are not yet realized, and where the role of current and upcoming AI technology is not clear.
Yet, interestingly 32% feel confident AI will impact areas that are “entirely new to the company.” This is not far behind the 37% of respondents who expect a very high degree of impact on the core areas of the current business.
( Case Study ) |
Artificial Intelligence in Europe |
A.P. Moller – Maersk
There is no doubt that AI has the potential to transform Transportation & Logistics, giving rise to a new class of intelligent logistics assets and operating models. Data science
is not new to A.P. Moller – Maersk, yet only recently has AI become a part of Maersk’s core strategy as a functional technology with tangible applications. As a designated new discipline positioned close to the core of group strategy, Maersk is developing AI capabilities as part of a broader transformation of the business.
Maersk takes a broad view of
AI, applying intelligent technology to three main areas: product offerings, (using AI to develop new products
and services and improve existing products and services); enhanced customer experience (service delivery, issue resolution, empowering custom-
er-facing employees); and operational efficiencies (for example via network optimization).
Treating AI as a distinct part of wider digital initiatives, Maersk established an in-house software development and innovation unit, consisting of 100 em-
ployees and growing. The aim is to deliver AI products and solutions rooted in the group business strategy, building on well-defined use-cases with deep sponsorship from the business, thereby avoiding the trap of living separately from the business and not adding value.
Maersk’s early investment in agile transformation and people capabilities has resulted in the organizational structure
and concentration of talent necessary to drive AI forwards in a large global organization.
A.P. Moller – Maersk is a Danish conglomerate with activities in two sectors: Transport & Logistics and Energy. Maersk is the largest company in Denmark, and the world’s largest operator of container ships and supply vessels. The company
has approximately 88,000 employees, a fleet of more than 1,100 vessels, and subsidiaries and offices in 130 countries. Its 2017 revenue was $31 billion.
At Maersk, we build things that have deep business sponsorship and add value.
What next?
Maersk is developing a platform to leverage company data to develop products, partly by optimizing the company’s data architecture to ensure faster development. To meet these demands, Maersk is changing its approach to attracting talent. AI also requires an entire new skillset among company leaders, transforming them into AI leaders who are deeply engaged in implementing AI in the business.
There’s good awareness about what AI can bring to the shipping industry. In the future, Maersk won’t just be a shipping company, but an integrated forwarder of logistics.
40 |
41 |

vk.com/id446425943
Business Benefits and Risks
Use It or Lose It
How is AI put to use in companies today?
AI enables a wide range of uses, broadly split into personalizing, automating, predicting, prescribing and generating insights. We asked companies how relevant each was to their business and found a significant degree of variance in terms of what executives expect to use AI technologies for.
Prediction is the top use
With 74% of companies seeing prediction as a relevant use of AI, this functionality, which includes churn analysis, predictive analysis, and predictive maintenance, comes out as the top use. Companies with a large customer base use churn analysis to identify and proactively engage customers with exit potential. Sales teams use predictive analysis to identify leads with the highest likelihood of conversion. Companies that sell or use advanced costly machinery use predictive maintenance to save money through decreased downtime.
Intelligent automation for effectively dealing with routine tasks
Smart automation is seen as widely applicable by 74% of companies surveyed. With estimates that 20-30% of current
tasks can be done without human intervention, a substantial number of companies are currently in the process of training chatbots to transform the way information is acquired.
Generating insights to make informed decisions
Focusing on generating insights based on internal and external data, 58% of companies view AI as a way to make better decisions. This requires a sophisticated data infrastructure. Companies reliant on R&D are using AI to speed up the process of analyzing data for new product development and to inform future research.
Personalization is becoming a common feature
Among the surveyed companies, 44% are using AI to personalize the user experience, for instance by tailoring content to individual interactions as an effective way of driving mass-person- alization. Next steps in personalization include chatbots and virtual assistants, where some companies already have fully automated customer front-end solutions in place.
Prescriptions’ potential is big
Prescription is the laggard among the five AI uses, with current use-cases typically being early stage, such as suggestion engines and decision recommendations for salespeople and advisors. AI for advanced prescription such as complex decision making lies in the future, as it requires collecting large amounts of data and understanding which variables are significant, including some that are difficult to digitize.
Prediction and automation relevant to most companies
What are the relevant uses of AI in your company?
74% |
72% |
58% |
44% |
24% |
To predict |
To automate |
To generate insights |
To personalize |
To prescribe |
Affirmative responses, 15 European markets
Predict
Anticipate events and outcomes
Automate
Handle tasks without human intervention
Business Benefits and Risks
AI will help make our products more reliable and allow real predictive actions based on various data sources.
― Siemens (Mobility Division) Mobility solutions
In the manufacturing industry, all processes will be impacted through the expanded use of AI. They will be simplified, automated and improved. AI will have an impact on the industry business model, from product-oriented to platform/ services-oriented.
― Carmeuse Mining
Insights
Identify and understand patterns and trends
Personalize
Tailor content and user-experience
Prescribe
Suggest solutions to defined problems
In all areas where a lot of data is reviewed and processed and has to be understood and assessed by people – we believe that in those areas AI can help us a lot to improve our efficiency.
― Handelsbanken Bank
We can provide a more personalized service to our guests, both before check-in, during the stay and after check-out. Content personalization and recommendations will further improve customer engagement.
― Grupo Pestana Hotel chain
We use Natural Language Processing to group customer inquiries and suggest which of our 300+ templates we should use in response. Our employees only need to confirm the choice or tweak it slightly. This dramatically lowers the time it takes to respond.
― PFA Pensions and insurance company
42 |
43 |

vk.com/id446425943
Business Benefits and Risks Business Benefits and Risks
Making AI Simple |
|
Improved production and efficiency |
ented sectors, AI enables provision of |
|
What is a good framework to map the potential benefits from AI? |
through optimized operations |
new services via multilingual cognitive |
||
While digital transformation in general |
tools, geo-location suites, sentiment |
|||
|
|
|
is based on customer engagement, op- |
analysis, cognitive robotic advisory ca- |
|
|
|
pabilities, personalized service agents |
|
|
|
|
timizing operations is what companies |
|
|
|
|
and more to transcend the sectors to |
|
|
|
|
first look to when putting AI to use. It |
|
|
|
|
a new level of value-add -with signifi- |
|
|
The contributing companies generally |
text, voice, and images; and ‘interact- |
draws on multiple levers such as: intelli- |
|
|
cantly increased scale and reach in real |
|||
|
gent prediction, e.g., identifying chron- |
|||
|
expect to benefit in all four key do- |
ing’ with employees, customers and |
time. |
|
|
ic diseases, anticipating non-perform- |
|||
|
mains as outlined in Microsoft’s Digi- |
other stakeholders in natural ways. |
|
|
|
ing products, or adaptive modelling |
|
||
|
tal Transformation framework: opti- |
|
Enabling employees to be more |
|
|
Applying AI to these domains can be |
to flag corrective actions; operational |
||
|
mizing operations; engaging customers; |
efficient and capable |
||
|
efficiency, e.g., optimizing forecasting |
|||
|
transforming products and services; |
transformational to a business, ulti- |
|
|
|
and order-to-fulfilment flows across |
Across sectors, numerous AI use-cases |
||
|
and enabling employees. Each domain |
mately changing the landscape of the |
||
|
the value chain, or processing huge |
focus on increasing employee produc- |
||
|
draws on underlying AI functionali- |
business itself and the industries and |
||
|
sets of documents in a fraction of the |
tivity or serve to enhance the human |
||
|
ties – ‘reasoning’ through learning and |
eco-systems in which it operates. |
||
|
time; and deep insights, e.g., detecting |
ingenuity and the ability to fulfil a |
||
|
forming conclusions with imperfect |
|
||
|
|
anomalies to surface irregularities such |
given function. AI helps employees in |
|
|
data; ‘understanding’ through inter- |
Let’s look in more detail at what that |
||
|
as fraud, or identifying new pockets of |
B2C companies expand organizational |
||
|
preting the meaning of data including |
entails. |
||
|
opportunity before competitors do. |
knowledge by analyzing vast customer |
||
|
|
|
||
|
|
|
|
behavior datasets in order to adapt |
|
|
|
Engaging customers more effec- |
online and offline store layouts, driving |
|
|
|
tively through AI |
conversion and sales. Customer per- |
|
|
|
After optimized operations, companies |
sonalization is used at scale, powered |
|
|
|
by AI solutions that reveal real-time |
|
Artificial Intelligence impacts business in four benefit domains |
|
look to customer engagement as the |
||
|
customer insights, identifying the best |
|||
|
domain in which to seek most business |
|||
Companies must consider how they approach the benefit domains in their AI strategy formulation |
benefits. Early examples of AI appli- |
next actions for up-sell and cross-sell |
||
|
|
|
cations in the customer engagement |
opportunities, as well as predictive |
|
|
|
models that obtain a 360-degree view |
|
|
|
|
space involve levers such as conversa- |
|
|
|
|
of the customer by integrating cus- |
|
|
|
|
tional agents, e.g., bots providing per- |
|
|
|
|
tomer data and sentiment to generate |
|
|
|
|
sonal recommendations and transac- |
|
|
|
|
targeted offers. |
|
|
|
|
tional advice; personal assistants, e.g., |
|
|
|
|
|
|
|
|
|
guiding decision-making, shortening |
|
|
|
|
conversion cycles; and self-service, e.g., |
|
Engage your customers |
|
Transform your |
options to help customers reduce time |
|
|
to resolution. |
|
||
|
products & services |
|
||
E.g., provide customers |
|
|
||
|
|
|
||
|
E.g., speed up prod- |
|
|
|
advice, shorten conver- |
|
Staying ahead of the competition by |
|
|
|
uct innovation cycles, |
|
||
sion cycles, and reduce |
Artificial |
|
||
transforming products and services |
|
|||
enable new value add |
|
|||
time to resolution |
|
|||
|
Intelligence |
services, and provide |
Transforming products and services, |
|
|
real time support |
and enabling employees, came out on |
|
|
|
benefit |
|
the same level, slightly below the two |
|
|
|
|
|
|
|
domains |
|
other domains when it comes to where |
It is important is to invest not because |
|
|
companies expect to generate future |
||
|
|
of hype, but where it provides business |
||
|
|
|
business benefits. |
|
|
|
|
Transforming products and services, |
benefits. |
|
|
|
|
|
|
|
|
ultimately giving rise to entirely new |
— Schindler |
|
|
Optimize your |
business models, is mostly favored in |
|
Enable employees |
|
Manufacturing |
||
|
R&D-heavy sectors where companies |
|||
E.g., increase employee |
|
operations |
|
|
|
consider AI and advanced analytics as |
|
||
|
E.g., improve plan- |
|
||
efficiency through pre- |
|
|
||
|
levers to speed up the product innova- |
|
||
|
ning and reduce costs |
|
||
dictions, enabled sup- |
|
|
||
|
tion and discovery process. In B2C-ori- |
|
||
|
through intelligent |
|
||
port, and automation of |
|
|
||
|
|
|
||
|
prediction, operational |
|
|
|
repetitive tasks |
|
|
|
|
|
efficiency, and deep |
|
|
|
|
|
|
|
|
|
|
insights, predictive |
|
|
|
|
maintenance |
|
|
44 |
|
|
|
45 |

vk.com/id446425943
Business Benefits and Risks
Where Value Hides
What benefits do business leaders particularly expect from AI?
Respondents were asked to assess the potential of AI within each of the four benefit domains.
Optimizing operations and engaging customers to deliver most value
Among all companies surveyed, 89% expect AI to prove beneficial in optimizing operations, with use-cases most highlighted by executives being monitoring results, predicting trends, and prescribing future solutions. A lot of focus is given to intelligent automation, such as making compliance cheaper and more robust, improving risk analysis, optimizing supply chains, providing predictive maintenance capabilities, and more.
Not surprisingly, the ability to structure repeatable processes and reduce human error and bottlenecks is something most executives can get behind from a cost-saving perspective.
74% of companies surveyed expect AI to help them engage customers and enhance the user experience, including tailoring content, increasing response speed, adding sentiment, creating experiences, and anticipating needs.
Fewer expect products and services and employee engagement
Although executives speak of the potential in making sense of existing and new sources of data to introduce higher margin services to product portfolios, expedite new product development, and introduce innovative new offerings, only 65% expect AI to help transform products and services.
Even fewer (60%) expect AI to provide benefit from empowering employees to improve productivity, enable innovation, support problem solving, etc.
What we did hear overwhelmingly, however, was the importance of bringing all employees along on the company’s AI journey. This involves getting internal buy-in that AI will be a force for good, generating excitement about working with intelligent technologies, and making existing jobs easier and more engaging.
Most companies expect to generate benefit from optimizing operations
What business benefit do you expect AI to generate?
89% |
74% |
65% |
60% |
Optimizing operations |
Engaging customers |
Transforming products & services |
Empowering employees |
Affirmative responses, 15 European markets
( Case Study ) |
Artificial Intelligence in Europe |
Stora Enso
There is strong support for AI within Stora Enso. The group leadership is aware of the possibilities of AI and
AI projects are being given sufficient resources. Digital and AI capabilities form Stora Enso’s
Digital Office, which supports the projects within business divisions and functions. However, some of the functions also have their own digital and AI capabilities so that they are able to exploit AI fully with domain expertise. Finance has its own RPA & Data Analyst teams, although they cooperate tightly with the group-wide digital unit.
Stora Enso has a target to train 1,000 employees in AI so that they are able to identify its possibilities in the business.
Business controllers will have data analytics training organized together with Aalto University Executive Education.
Stora Enso believes that AI will make it more agile and adaptive as a whole. The more they have systems that can automatically adapt to changing sit-
uations, the quicker they can react to them. AI will be most visible in operations and logistics because of massive amounts of data. Although the focus of
Stora Enso has been in optimizing the current business model, there have been some initiatives in new services, such as intelligent packaging initiatives that collect data which can be further analyzed and sold to customers or other players in the supply chain.
However, before AI can be exploited to its full extent, the processes and particularly the master data must be suitable.
Currently, data is not all in the same place, and Stora Enso has an ongoing project to consolidate it.
Stora Enso is one of the oldest corporations in the world (with a history dating back to 1288) and is a leading provider of renewable solutions in packaging, biomaterials, wood constructions and paper on global markets. Its customers include packaging producers, brand owners, paper and board producers, publishers, retailers, print houses, converters, and joinery and construction companies. Its aim is to replace fossil
based materials by innovating and developing new products and services based on wood and other renewable materials. Stora Enso employs some 26 000 people in over 30 countries.
What next?
One major future focus of AI use in Stora Enso is predictive maintenance. The machines started to be automated in the 1970’s, but the schedule for their expensive maintenance breaks has not changed much since then. With predictive maintenance solutions, machines could be stopped only when the maintenance is actually required and not simply because it has been a year since the last one. Further, Stora Enso expects that AI resources will be further decentralized in the future and that new applications will be found, both for business functions and to develop new products and services.
We are finding ways to exploit AI in all areas |
We think AI is one of the most important |
of our business. |
digital initiatives at Stora Enso. |
46 |
47 |
vk.com/id446425943
Business Benefits and Risks
Sector Benefits Landscape
We asked companies across sectors what business benefit they expect AI to generate across Engaging customers, optimising operations, Empowering employees, and Transforming products & services
Life Science
Pharmaceutical,
Healthcare,
Biotech
Engaging customers |
Optimising |
Transforming |
Empowering |
|
operations |
products & services |
employees |
Tailoring content, increasing |
Automating processes, |
Adding data services, gener- |
Improving productivity, en- |
response speed, adding sen- |
monitoring results, pre- |
ating new business models, |
abling innovation, exploring |
timent, creating experiences, |
dicting trends, prescribing |
extending reach, etc. |
new capabilities, supporting |
anticipating needs, etc. |
solutions, etc. |
|
problem solving, etc. |
71% |
88% |
71% |
54% |
CPR |
|
|
|
|
Consumer |
78% |
78% |
58% |
|
Products |
||||
|
|
|
||
& Retail |
|
|
|
|
Industrial Products |
|
|
|
|
Manufacturing, |
61% |
96% |
70% |
|
Materials, |
||||
|
|
|
||
Equipment |
|
|
|
|
TMT |
|
88% |
64% |
|
Technology, |
81% |
|||
Media/Entertainment |
||||
& Telecom |
|
|
|
|
Finance |
|
|
|
|
Banking, |
78% |
84% |
67% |
|
Insurance, |
||||
|
|
|
||
Investments |
|
|
|
|
Infrastructure |
|
|
|
|
Transportation, |
74% |
96% |
54% |
|
Energy, Construction, |
||||
|
|
|
||
Real Estate |
|
|
|
|
Services |
|
|
|
|
Professional Services, |
83% |
83% |
78% |
Hospitality, Public
Services, Membership
Organization
44%
56%
52%


73%


70%


78%


Affirmative responses by sector
Business Benefits and Risks
Front to Back
What are the expected benefits by sector?
Executives surveyed and interviewed in the various sectors recognize the distinct benefits of AI, speaking about the myriad of ways they see AI transforming their businesses and industries. Although there are clear patterns to discern, executives from different sectors often speak to different benefit areas from which they particularly hope to capitalize from.
Services companies expect the most benefits from AI
Services companies reported the highest expected benefits across all four domains, expecting significant value from AI through engaging customers and empowering employees, for example via improving resource and skills allocation across their large human capital pools. (Note: the Services sample is the smallest of all sectors.)
Expedited drug discovery and disease prediction in Life Science
Executives in Life Science are among those most excited about benefits pertaining to transforming products and services. Many see AI leveraging existing internal and external datasets to speed up the drug discovery process and enable the transition towards precision medicine.
Deep learning with huge datasets is also expected to assist with disease prediction. Customers can be engaged using new health-oriented IoT-related
wearables, paving the way to valuable data collection and even entirely new business models.
Engaging customers in new ways in Consumer Products and Retail
The Consumer Products and Retail companies we spoke to rank lowest in terms of expecting benefits from AI, pulled down by only 44% expecting benefits from AI to empower employees. However, with multilingual cognitive tools and being able to bring targeted, tailored offerings to customers, many spoke of the potential to engage customers, and of using AI for crucial activities such as understanding brand performance and sentiment analysis.
Virtually all Industrial Products and Infrastructure companies look to optimize operations
Companies from the Infrastructure and Industrial Products & Manufacturing sectors top the list at 96% respectively in terms of expecting efficiency gains through AI optimized operations. The heavy focus on equipment, complex supply chains and materials means there is ample scope for intelligent optimization. Yet, there is a relatively small focus on engaging customers and empowering employees. This is likely due to the frequent B2B nature of these businesses, and the potential for automated machinery to play an ev- er-growing role in the industrial sector.
TMT expects AI to increase engagement, insights, and connectivity
The focus in many Telecom, Media and Technology companies seem to be on using AI to reduce costs of retaining and growing customer bases. AI is projected to help build seamless experiences across devices, predicting churn, and automating customer service capabilities to solve some of the sector’s longstanding challenges while bringing down costs.
AI to revolutionize Financial Services firms
Finance companies reported some of the highest expectations for AI benefits across the four domains, which can explain the sector’s current frontrunner when it comes to current AI maturity. From using machine learning to detect fraud and automation to streamlining
KYC efforts in the back office, and to reducing compliance and regulatory costs via technologies that digest vast quantities of legal documents, banks and other financial institutions are looking to provide higher quality service at faster speeds and lower costs. Similarly, mortgage applications can be approved in a matter of minutes, and investment decisions can be guided
by robo-traders to transform products and engage customers in the front office.
As a railway company, we have significant physical assets that need to be maintained. With AI we see significant opportunities, like automatically detecting faults in railway tracks and predicting maintenance needs. This improves not only efficiency but also security.
—SBB Swiss Federal Railways
Railways
48 |
49 |

vk.com/id446425943
Artificial Intelligence in Europe
Today AI is often somewhat a ‘black box’, however we need to know why AI came up with a certain conclusion, such as telling a customer why their loan application was declined or similar. Trust in AI is lacking, so there is a risk that customers remain on the fence with regards to the application of AI.
— KLP Banken Bank
Use cases where we got the best results were when we had a strong lead on the business side to coordinate the work and act as ‘data translators’ between the data scientists and their own colleagues.
— Proximus Telecommunications
Business Benefits and Risks
Risky Business?
What do business leaders need to pay attention to when implementing AI?
There are inevitable concerns about the business risks associated with AI, as many of the applications of the relatively new technology are still in their early development while receiving significant media and political attention.
However, from what business leaders tell us, they are balancing their excitement about AI’s potential with some healthy reflections on key business risks, not at least the risk of investing in a technology that may not prove its commercial value if not done correctly.
Broad concern with regulatory landscape
Over half of all companies surveyed expressed concern regarding regulatory requirements. This concern can broadly be split into compliance with existing requirements and navigating the nascent, often ill-defined regulatory landscape for AI. For the former, companies
need to take advantage of solutions in accordance with everything from GDPR to cybersecurity concerns. For the latter, the lack of clarity around AI regulation can slow down scaled im-
plementation as business leaders worry about investing in solutions when the rulebook is still being written. Many first movers within our AI report feel they need to write the rules themselves and hope for the best.
Concern with the human in the new machine age
A prevailing risk many companies were also concerned with was impact on personnel. The need for employees across the organization to buy in and adapt to working with AI touches on all industries and markets. The instinctual fear of job losses among personnel is one that needs to be managed as AI will often transform the daily tasks of
employees, rather than replace them altogether, allowing for more peo- ple-oriented or creative work. There is also a larger task in training employees to work together with AI, usually a challenge and risk in itself.
Seeing the wood for trees
A further dominant risk articulated by several surveyed business leaders is about feeling information overload. AI can help make sense of huge quantities of data, but setting up AI and learning to use it effectively requires feeding the technology the right data and working out what is useful versus what is noise. A further element in the risk of overload is understanding the different AI technologies and solutions available and making sense of technological as well as market developments to know where to make strategic use of AI.
Top 3 business risks in Europe
1 |
Regulatory |
2 |
Impact on |
3 |
Information |
||||
Requirements |
Personnel |
Overload |
|||||||
|
|
|
53% |
|
|
35% |
|
|
35% |
|
|
|
|
|
|
|
|||
More than half of Norwegian companies expressed concern about regulatory requirements, and in particular, the need for clear guidelines and regulations regarding AI. Without such clarity, investment in AI can be perceived as risky for companies because they may invest in something allowed at the time that may not be later on. Norway shares this concern with other European countries surveyed: for almost all of them, regulatory requirements was one of the top three risks.
AI is not just about technology. The adoption of AI is equally about change management, including culture and mindset shifts. It requires balancing employees’ fear of losing their jobs with the awareness that once AI frees them from menial tasks, they will gain more time to help customers and develop products and services. It is also about recruiting new employees and supporting current employees as they adopt new kinds of technology.
Information overload may occur when trying to figure out what is useful in vast amounts of data, identifying insights or establishing predictive trends. Working with such large amounts of data requires consideration for the users looking for understandable, actionable results. As companies implement AI, they are considering both the technical aspects of working with very large datasets and the human aspects of interpreting the results in a real-world, business context.
50 |
Note: Affirmative responses, Europe. The respondents were asked to select all that applied of the following response options included: Diffusion of |
51 |
|
resources, Loss of control, Upkeep of the system, Information overload, Regulatory requirements, Impact on personnel. |
|

vk.com/id446425943
Artificial Intelligence in Europe
Learn from the Leaders
The promise of AI lies in creating business value.
We have identified the eight most recognized capabilities needed to successfully create value from AI, and assessed how competent companies are within each.
Perhaps more importantly, the executives we spoke with highlighted the importance of these 8 competencies as those needed to successfully create value from AI.
Capabilities. How?
What competencies are required to get AI right?
This section explores the necessary eight capabilities to develop AI maturity, realize tangible business benefits, and minimize risk. As exhibited in the chart on the following page, we asked the companies to rank the importance of these capabilities in terms of incorporating AI into their business, as well as to self-assess how competent their companies are with regards to each AI enabling capability.
The human element and technology
Some of the eight capabilities center around human elements: AI Leadership; Open Culture; Agile Development; Emotional Intelligence. Others are more technology oriented: Advanced Analytics; Data Management; Emerging Tech; External Alliances.
Ranking of key capabilities for realizing AI potential
Advanced Analytics comes out on
top as the most important AI enabling capability among the companies surveyed. Data Management is second.
AI Leadership is perceived as the third most important capability. Open Culture refers to collaboration and the ability to embrace change and uncertainty.
Understanding how to deploy the right Emerging Technologies in a future proven way is ranked fifth, followed by
Agile Development, where self-organ- ized teams are characterized by shorter project cycles, the ability to work with constantly evolving technology, and transparency regarding success and failure that leads to wider buy-in and scaling.
Entering into External Partnerships ranks second to last in terms of importance, perhaps because it’s the area that resonates most with existing capabilities and where business leaders perceive themselves most in control.
As the majority of companies we spoke to are looking to supplement their in-house skills with external partners when building their AI solutions, particularly for pilot projects, it is not due to a general lack of relevance.
Bringing behavioral science into play via Emotional Intelligence to build solutions that understand and mimic human behavior, and make it easier for humans to interact with the technology, is seen as the relatively least important AI enabling capability. An explanation for this could be that the technical skills are still so relatively complex for companies to grasp and establish, that more advanced human cognitive skills become less of a priority at this stage.
Noticeable sector deviation
As exhibited in the following chart where business leaders are asked how competent their company is in relation to the most important AI enabling capabilities, the sector aggregate scores land at or just above the median, with a fairly close spread. Sectors that are more mature in using AI are those that report higher competency in Advanced Analytics - particularly TMT (Telecom, Media/Entertainment & Technology), as well as Finance (including Banking, Investment & Insurance), and Life Sciences (including Healthcare & Pharma) all report lower competency in AI Leadership. A possibility is that in the pharmaceutical industry, AI chiefly resides in R&D, and has yet to affect the broader organization on the wider strategic level.
Companies intend to use various levers to obtain these AI capabilities. Companies are relatively evenly split between using recruitment (60%), training (56%), partnering (57%). Only 10% of the companies use acquisition of teams or businesses as a way to fast track building much needed AI capabilities.
Learn fom the Leaders
8 capabilities
1. Advanced Analytics
Obtaining and deploying specialized data science skills to work with AI by attracting talent and working with external parties
2. Data Management
Capturing, storing, structuring, labeling, accessing and understanding data to build the foundation and infrastructure to work with AI technologies
3. AI Leadership
The ability to lead a transformation that leverages AI technology to set defined goals, capture business value and achieve broadly based internal and external buy-in by the organization
4. Open Culture
Creating an open culture in which people embrace change, work to break down silos, and collaborate across the organization and with external parties
5. Emerging Tech
The organizational-wide capability to continuously discover, explore and materialize value from new solutions, applications, and data platforms
6. Agile Development
An experimental approach in which collaborative, cross-functional teams work in short project cycles and iterative processes to effectively advance AI solutions
7. External Alliances
Entering into partnerships and alliances with third party solution providers, technical specialists, and business advisors to access technical capabilities, best practices - and talent
8. Emotional Intelligence
Applying behavioral science capabilities to understand and mimic human behavior, address human needs, and enable ways to interact with technology and develop more human-like applications
52 |
53 |

vk.com/id446425943
Learn fom the Leaders |
Learn fom the Leaders |
AI Competency Model
Advanced Analytics and Data management considered most important AI capability
How competent is your company within these organizational capabilities?
|
|
Luxembourg |
European |
markets |
|||
|
& |
|
|||||
|
|
|
|
|
|
||
IrelandSwedenBelgiumSpain |
The |
Netherlands |
|
||||
|
Avg |
AustriaSwitzerlandItaly Finland |
|||||
NorwayDenmark |
Portugal |
.15 |
|
|
|||
|
|
|
|
|
|
||
TMT leads the other sectors in AI competency
How competent is your company within these organizational capabilities?
Products |
Infrastructure |
ServicesTMT |
IndustrialLife FinanceCPR |
||
Science |
|
|
Advanced
Analytics
Data
Management
AI Leadership
Open Culture
Emerging Tech
Agile
Development
External
Alliances
Emotional
Intelligence
54
Advanced
Analytics
Data
Management
AI Leadership
Open Culture
Emerging Tech
Agile
Development
External
Alliances
|
|
|
|
|
|
|
Emotional |
|
|
|
|
|
|
|
|
|
|
|
|
Intelligence |
|
|
|
|
|
2,0 |
2,5 |
3,0 |
3,5 |
4,0 |
4,5 |
5,0 |
2,0 |
2,5 |
3,0 |
3,5 |
4,0 |
4,5 |
Note: ‘Don’t know’ answers not included in average score. |
|
|
|
|
Note: ‘Don’t know’ answers not included in average score. |
|
|
|
||||
Average competency and importance for 15 European markets (1: lowest – 5: highest). |
|
|
|
Average competency by sector (1: lowest – 5: highest). |
|
|
|
|||||
Capabilities ranked according to highest importance in 15 European markets. |
|
|
|
|
|
|
|
|
55 |
|||
|
|
|
|
|
|
|
|
|
|
|
|
|

vk.com/id446425943
Learn from the Leaders
1. Advanced Analytics
Obtaining and deploying specialized data science, data engineering, data architecture and data visualization skills by training employees, attracting talent and co-creating with external partners
Telecom is advanced and challenging technologically so we need to combine the best minds in deep domain competence with the best minds with deep knowledge in machine learning and AI. So we are working with talent on multiple layers.
—Ericsson
Telecommunications
The backbone of AI is made up of skilled, intelligent minds who are capable of understanding business problems at the granular level, and deploying AI to effectively solve or support others in solving these problems. This requires technical data science and mathematical engineering skills, to hybrid profiles with sufficient business acumen to decode problems and ability to tackle them using quantitative methods.
A self-fulfilling talent prophecy
It is evident from the study that there is a major lack of technical data skills to meet the drastically rising demand for AI. As a result, the hunt for AI experts has become extremely competitive, and it is far from uncommon that functional AI experts are paid higher salaries than their superiors are - in some cases leading to new HR policies to reflect evolving requirements.
Several business leaders state that the lack of AI talent is the greatest barrier to implementation within business operations. Interestingly, companies that have chosen an early adopter strategy for AI have been successful in attracting senior professionals who again have been able to build out sizeable AI teams in their companies – based on the premise that talents seek talent – making AI recruitment a self-fulfilling prophecy for these pioneering companies.
In other words, the longer you wait, the harder it can be to get the right people. Consequently, a ‘wait-and-see’ strategy can be risky for companies that are AI followers due to the scarcity of talent, which may prove impossible to attract once the company is ready to make a more ambitious move into AI.
While many companies struggle with acquiring AI talent, we also experienced companies - even in traditional industries such as Transportation and Industrial Products - with AI teams of +25 experienced data scientists holding Ph.D’s in mathematics, astrophysics, etc., from high profile universities. Most often, these companies have been
first movers on AI and attracted senior practitioners tasked with building out sizeable AI communities to work on the most strategic business agendas.
Hybrid profiles becoming the hardest currency
One of the most consistent inputs from the executives was the need for people with deep domain knowledge combined with strong technology proficiency. This hybrid profile is essential to identify relevant use-cases in the business with possible AI solutions.
Learn from the Leaders
Companies consider themselves moderately competent within Advanced Analytics
How competent is your company within Advanced Analytics?
|
|
|
|
|
|
Avg. Score |
|
|
|
|
|
|
4.4 |
|
|
|
|
36% |
27% |
Importance |
|
|
|
18% |
|
|
|
|
|
|
|
|
14% |
|
|
|
|
|
|
|
|
4% |
|
|
|
3.3 |
||
|
|
|
|
|
|
Competency |
1 |
2 |
3 |
4 |
5 |
||
|
|
Not competent |
|
Moderately competent |
|
Highly competent |
Limited analytics skills beyond tra- |
|
Semi-autonomous examination of |
|
Significant data science activity using |
||
ditional business intelligence based |
|
data using sophisticated techniques |
|
techniques such as complex event |
||
primarily on historical data |
|
and tools to predict future events |
|
processing, neural networks, etc. |
||
|
|
15 European markets |
|
|
Note: Remaining percent are ‘Don’t know’ responses |
|
|
|
|
|
|||
Contrary to data scientists, software engineers, and even data architects that can be recruited externally, the hybrid profile is often nurtured by training existing employees from the line of business and adding AI skills. To succeed however, a fundamental appreciation for technology is required.
Co-creating to compensate for blind spots - while avoiding the black box
The scarcity of available talent has led companies to increasingly co-create solutions with external partners who bring with them specialized know-how. However, executives very clearly point to the need for internal AI capabilities in the receiving end to understand the real problems and evaluate the performance of external partners.
Companies find that AI solutions implemented by external parties become black boxes unless the organization
is capable of contributing and taking over the solutions after delivery. Avoiding black boxes is a general concern among executives. Consequently, internal data scientists must be able to decode and dissect AI applications to explain of the underlying rationales.
Such rationales are important in making AI driven solutions creditable, and greatly reduce the risk that an AI application draws wrong conclusions based on false assumptions.
What to learn from AI leaders:
1.Providing interesting problems, good data, and a freedom to thrive in a noncorporate environment is key to attracting talent
2.A wait-and-see follower strategy can prove risky and put companies in a talent scarcity trap.
3.Training existing staff with deep business intrinsics is key to make AI work - and effective when access to talent is challenged.
The way we manage and plan operations will change dramatically through data capabilities.
—Finair
Airlines
56 |
57 |

vk.com/id446425943
Learn from the Leaders
2. Data Management
Capturing, storing, structuring, labeling, accessing and governing data to build the foundation and infrastructure to work with AI technologies
Companies tend to focus their AI efforts in areas where they already have relevant data. We found that the amount of available data varies significantly by sector but regardlessly, a significant proportion of the time companies dedicate to AI is spent on data management related tasks.
Data governance is no trivial task
One of the major hurdles companies face regarding data is governance, particularly who ‘owns’ it, how data is stored, how to access it, and who may access it are all essential questions when working with AI. Questions that used to be about efficiency suddenly become highly strategical and complex to respond to without rethinking governance structure and policy. Governance aside, the most common obstacles to using data are organizational silos or legacy systems built for specific purposes, resulting in decentralized storage that limits access.
Companies reported that they typically spend 2-3 years building the appropriate data infrastructure for AI, and many respondents with the most ambitious AI visions are still spending the majority of their time fine-tuning their infrastructure.
Data privacy regulations
Data infrastructure is not only a prerequisite for effectively working with AI, but is increasingly needed to comply with data privacy regulations, which respondents see as a key risk. The recent implementation of GDPR in the EU has highlighted the need to govern what data is being used for. AI-specific regulation is in many ways still immature, and AI leaders find that a lack of clear guidelines can limit their progress.
An algorithm is as good as the data that supports it. You can make bad analytics by having a bad algorithm but also by using bad data. It is important to get those things in order and have processes and people to make sure that the quality of data is driven and maintained.
—Vattenfall
Energy
Learn from the Leaders
A significant share of companies consider themselves moderately to highly competent within Data Management
How competent is your company within Data Management?
38% |
31% |
19%
8%
3%
Avg. Score
4.4
Importance
3.2
Competency
1 |
2 |
3 |
4 |
5 |
||
|
|
Not competent |
|
Moderately competent |
|
Highly competent |
Limited discipline and method to en- |
|
Traditional DM with embedded busi- |
|
Agile governance, processing of data |
||
sure currency and quality of reference |
|
ness rules to validate, reconcile, and |
|
from disparate sources incl. external |
||
data across subjects and systems |
|
align data to corporate policy |
|
networks, fast query access, etc. |
||
|
|
15 European markets |
|
|
Note: Remaining percent are ‘Don’t know’ responses |
|
|
|
|
|
|||
Advanced companies (also) appreciate external and unstructured data
To build precise and useful AI solutions, companies not only need a lot of data, but also accurate data that is appropriately structured and labeled. Data is often reported to be in a state that it is simply unusable, as it could lead to undesirable or unreliable outcomes.
While most companies are preoccupied with cleaning, structuring and migrating historical data, some have chosen to build new data structures from scratch to collect the correct data going forward. Interestingly, we found that while companies that are less mature in AI
tend to use mostly structured data from internal data sources, a significant 80% of the most advanced companies also use both structured and unstructured data, and an equivalent 80% use data from both internal and external sources.
Similarly, 60% of these self-rated most advanced companies report use of hybrid architectures of on-premise and cloud based storage, while the less advanced predominantly rely on on-premise platforms.
What to learn from AI leaders:
1.Make sure that the value of data is understood and prioritized throughout the organization.
2.Engage the C-suite in defining data governance and strategy - it is key to getting AI right.
3.Build your data structure to embrace unstructured data, also from external sources - advanced companies indicate that you may soon need it.
The ethical use of data is a challenge or risk. Data must be stored properly. The person who generates the data is also the owner of the data, and that person has to decide what to do with it.
—Royal Phillips
Health technology
58 |
59 |

vk.com/id446425943
Learn from the Leaders
3. AI Leadership
The ability to lead an AI transformation from top to bottom - by articulating a vision, setting goals and securing broad buy-in across the organization
Going from talking and building to doing means that you take it to the decision point where leadership has to decide A or B, based on an AI-generated result. From an intellectual perspective, it is easy to say that you
will follow AI results. But when the moment comes where you choose between recommendations based on old methods and AI, if you choose AI, that is when change truly happens.
—EQT
Private equity group
As with any corporate transformation, the foundation for successful deployment of AI is executive leadership buy-in and sponsorship. The C-suite must be aligned in what they want
to achieve, and AI must be placed on the strategic agenda to ensure that AI efforts are an integrated part of the company’s overall strategic goals, that capital is allocated, and employee time is dedicated.
AI Leadership among the lowest competency of all capabilities
Given the relative importance of AI Leadership (avg. 4.2 across all sectors), it is interesting to see that business leaders self-assess their level of competency as among the lowest of all eight AI enabling capabilities, with an avg. competency of only 2.9; 66% of respondents state that their companies have moderate, little or no AI Leadership competency. Many executives are realizing that business acumen is not
enough in itself for understanding how AI is impacting the business. As AI technologies become increasingly complex, leaders must be able to launch, support and, where necessary, challenge relevant AI initiatives against strategic business imperatives. The disruptive potential that companies believe AI will have also means that leaders should anticipate and prepare for a broader change management exercise aimed at embracing the change from AI on multiple levels.
Significant variation in AI conversations from top to bottom
Interestingly, data revealed that AI is considered an “important topic” on the C-suite level among 73% of the companies surveyed. However, less so on the Board of Director level where it is only considered an important topic in 38% of companies, and even less so on the operational employee level with 28%.
We observed in the interviews that companies very rarely have AI capable leaders across the Board of Directors, Executive Management, and Functional Management layers. Senior AI leaders can sometimes be found on one of the levels, but rarely with any speaking leadership colleagues to challenge ideas. This leadership vacuum was often pointed to as an issue from lower level AI experts.
Learn from the Leaders
A large proportion of companies consider themselves to have limited or no AI Leadership competency
How competent is your company within AI Leadership?
|
|
|
|
Avg. Score |
|
|
|
|
4.2 |
|
24% |
32% |
23% |
Importance |
|
|
|
||
10% |
|
|
|
9% |
|
|
|
|
2.9 |
|
|
|
|
Competency |
1 |
2 |
3 |
4 |
5 |
Not competent |
|
Moderately competent |
|
Highly competent |
Limited strategic priority assigned |
|
Substantial resources deployed to AI, |
|
AI recognized as a key strategic pri- |
to AI activities and only vague fo- |
|
mandates assigned, and leadership |
|
ority, with strong C-suite sponsorship |
cus on AI in the management team |
|
articulation of an AI vision |
|
and high tolerance of uncertainty |
15 European markets |
Note: Remaining percent are ‘Don’t know’ responses |
|
Accepting loss of control
As new technological opportunities foster innovative, dynamic business models, organizations will need to tear down silos to become more agile and collaborative. To achieve this change, it is paramount for leaders to create and convincingly articulate a vision so stakeholders understand the bigger picture.
A general characteristic of this challenge is that leadership needs to accept that it will lose some control. Projects will increasingly be explorative, bot- tom-up and have less certain outcomes, requiring leaders to be ready to adjust the overall direction of the company more frequently. Increasingly, AI projects will rely on open source code and off-site cloud solutions, building on collaborative capabilities outside the company.
What to learn from AI leaders:
1.The organizational transformation driven by AI will be continuous - this requires seeing AI as a process, not a project.
2.Leadership must be accustomed to AI technologies to
understand how it will affect the company.
3.Articulating a clear AI vision is key to achieving buy-in and motivating exploration of use-cases with uncertain outcomes.
60 |
61 |

vk.com/id446425943
Learn from the Leaders
4. Open Culture
Creating an open culture in which people embrace change from AI, navigate confidently in uncertainty and ambiguity, work to break down silos, and collaborate seamlessly across the organization
You cannot only have data scientists do it. They have a super important role but you also have to complement them with designers. Because you need to find the use cases where you apply those types of technologies. Even though it is the fantastic technology that can bring fantastic results, it has to be embedded in a design approach to meet the customer needs and solve real problems.
—IKEA Group
Furniture retail
New technologies have often disrupted how work is conducted. AI is no different. Establishing an open, collaborative culture to minimize resistance and enable human performance can prove efficient to prepare the organization for transition. However, this may be difficult, as the magnitude of impact driven by AI can imply a fear of uncertainty, ambiguity, and a general resistance to change.
Risk to employees less of a concern among most advanced companies
Companies reported that employees generally have a positive attitude towards AI. Yet, one thing is having a positive attitude in general, another is to retain an open attitude once new technologies start impacting the way work is done.
To achieve buy-in, business leaders must make the changes due to AI tangible to reduce organizational uncertainty. However, companies expect a significant impact from AI which will
drive a fundamental transformation and increasingly assist in tasks previously performed by humans.
Interestingly, the companies that self-rated as most advanced see a lower risk to personnel than the less advanced (only 20% of advanced reported this risk as a concern vs. 43% for the companies still in the “planning” phase).
Relatively small competency gap
With a relatively small gap between importance (avg. 3.9) and competency (avg. 3.2), creating an Open Culture is one of the capabilities where business leaders feel most comfortable.
An obstacle mentioned by many respondents is the ability to work collaboratively across the organization despite AI most often being put to use towards quite narrow use-cases. With benefit areas being limited to specific domains or functions, it is often not seen as relevant to involve the organization in a broad and collaborative approach on AI.
Furthermore, many companies have had difficulties in carrying out effective
AI programs, which are closely modelled on the lean processes of startups. The primary purpose of such programs is to enable brief, agile projects to gauge the applicability of AI use-cases, requiring a substantial change to company culture. Silos between departments in the company have to be bro-
Learn from the Leaders
Most companies rate themselves moderately competent in Open Culture
How competent is your company within creating an Open Culture?
|
|
|
|
|
|
Avg. Score |
|
|
|
|
|
|
3.9 |
|
|
|
|
41% |
23% |
Importance |
|
|
|
|
18% |
13% |
|
|
|
|
|
|
||
|
|
|
|
|
|
|
4% |
|
|
|
3.2 |
||
|
|
|
|
|
|
Competency |
1 |
2 |
3 |
4 |
5 |
||
|
|
Not competent |
|
Moderately competent |
|
Highly competent |
Gravitation towards linear processes, |
|
Emerging transparency, participation, |
|
Truly collaborative and open approach, |
||
and organization of AI in separate |
|
empowerment, community building to |
|
with clear accountability across both |
||
silos within existing structures |
|
increase speed and agility |
|
internal and external domains |
||
|
|
15 European markets |
|
|
Note: Remaining percent are ‘Don’t know’ responses |
|
|
|
|
|
|||
ken down in order to promote a culture where AI-teams work in conjunction with the rest of the company to create value, circumventing needless complexity and time-consuming processes.
Another issue relates to the concept of sharing data openly, when the value of the data largely remains unknown until it has been treated, processed or combined with other datasets.
Cooperation across the organization
Many of the most advanced companies that have been able to produce several AI projects have also managed to establish links and cooperation across the organization. These cases indicate that the benefits of an open work culture far exceed the difficulties and associated risks.
An obvious obstacle to an open culture is the fear of job losses with the introduction of AI. According to respondents, the fear of workforce redundancy has some merit, but the concern should not overshadow the significant benefit potential of AI. A pivotal task for company leaders is to proactively articulate a tangible vision for AI initiatives. This will make it easier for employees to understand the AI opportunities on a personal level, and thereby embrace the change ahead.
What to learn from AI leaders:
1.Establish crossorganizational projects to foster collaboration and learning across functions.
2.Ensure employee buy-in by being open and clear about on-going projects and desired outcomes.
3.Ensure that governance structures support collaboration through projects co-owned by AI experts and business leaders.
Essentially the use of AI involves enabling employees and the creation of energy in the organization to fully exploit the solutions. The will of employees
to share their knowledge and to be able to recycle it in the rest of the organization is also an essential capability in order to use AI.
—Ageon
Financial services
62 |
63 |

vk.com/id446425943
Learn from the Leaders
5. Emerging Technology
The organization-wide ability to continuously discover, deploy, and create value from intelligent solutions, applications, and data platforms
Evidence of the rapid pace of technological change are plentiful in today’s digital world. What we have seen is that there is a definite correlation between companies that are ahead of the pack with AI and with the wider technological adoption. That AI benefits from being able to identify and implement emerging technology may seem intuitive and obvious, yet finding the right formula is no trivial exercise.
How strong is your tech radar?
With an average score of 3.3, the ability to explore and implement emerging technology is an area where business leaders perceive their companies to
be most competent across the eight AI enabling capability areas.
One factor in working with emerging and rapidly developing technology to build a stack fit for AI is a well-calibrat- ed ‘radar’ by which large companies pick up on the trends outside of their own walls. Many companies mention
that being unable to quickly integrate innovative trends and cutting edge technology due to the burden of legacy systems, siloed business units, and complex governance processes is proving a real challenge for their AI adoption.
While there is some truth behind such stereotypes, we also heard from several executives who are able to build radars that pick up what’s happening in technology domains and applications that this continuous explorative process is serving them well to get an overview of workable AI solutions that could prove successful in production.
Do you enable or hinder innovation?
Once companies are able to selectively source new solutions from the outside world, the challenge is then how to enable it. This can be a case of actively encouraging enablement, or at the very least not hindering it. Many companies treat AI as a crucial piece of a
wider digital puzzle, where dots need to be connected across technologies. This means success with established technologies, from cloud and SaaS platforms to getting the basics right with analytics, is key to building on what is already there.
Working with emerging technology also relates to agile development and the ability to trial, test and experiment in iterative, short cycles. This kind of working culture allows companies to work with less stable, untested technology. Enabling innovation requires an outlook from the very top
of the organization that accommodates longer investment horizons and at times uncertain financial returns. This is particularly key when working with AI technology that, according to the executives, is often not as mature as the digital solutions deployed for other purposes.
A big challenge is to follow all the rapid evolutions in the market and match that to the right business initiative.
—DAF Trucks
Manufacturing
Emerging Technology is the AI-enabling capability with most ‘Moderately Competent’ replies
How competent is your company within adopting Emerging technology?
|
|
42% |
29% |
|
|
|
|
|
13% |
|
|
3% |
|
|
|
1 |
2 |
3 |
4 |
Not competent |
|
Moderately competent |
|
Legacy oriented tech stack, typically |
|
Increasingly AI enabled tech stack with |
|
on-premise based and with limited |
|
on-demand cloud computing, agile |
|
future proofing of AI technologies |
|
software, scalable architecture, etc. |
|
Learn from the Leaders
Avg. Score
3.9 Importance
12%
3.3 Competency
5
Highly competent
Tech stack optimized for AI across hardware, interface, algorithms, architecture, people, services, etc.
15 European markets |
Note: Remaining percent are ‘Don’t know’ responses |
Not all that glitters is gold
Despite the need to explore and navigate a tech sea characterized by uncertainty, a recurring theme when interviewing executives is the importance of balancing excitement with new technology and commitment to an innovative mindset, with one foot planted firmly on the ground.
Seeing past the hype, remembering the business model, and not wasting finite resources on every shiny object is also important. In other words, remembering as a leader that while experimenting is crucial, not all that glitters is gold.
The importance of execution
Finally, this capability is also effective execution. Many companies we surveyed across Europe had developed prosperous use cases supported by robust concepts and AI applications - on paper. But technical limitations tend to get in the way of implementation.
Employees with limited technical ability often need upskilling to work with new technology. IT and business may need to work closely together and speak each other’s languages to reach common goals. In addition, organizations need to learn to move more quickly and nimbly in this space - whether to complete an acquisition of new tech, to ensure compliance with IT standards, or simply to pair new tech with legacy systems. This ability is often also about speed, not far from the development pace that characterizes the emerging tech itself.
What to learn from AI leaders:
1.Build a radar to pick up on merging tech trends and connect them to market opportunities.
2.Look past the technology hype and remember the business model - it may likely need to change in the not so distant future.
3.Cloud solutions can be helpful to engage with multiple datasets across sources - increasingly a priority to capture value from new pockets.
We cannot do AI entirely internally as we do not have the needed resources. There is a risk that we won’t be able to keep up with all developments.
—Raiffeisen Switzerland
Bank
64 |
65 |

vk.com/id446425943
Learn from the Leaders
6. Agile Development
An experimental approach in which collaborative, cross-functional teams work in short, iterative project cycles to effectively progress AI solutions
It is important to work with AI in an agile way and start with small steps, otherwise it will drown in long and costly projects. Our focus is on proving that it creates value via proof of concept.
—Egmont
Media
Considering that many AI technologies are still in their infancies, working with them is far from plug and play. To overcome this, many of the companies that are successfully working with AI tend to take an agile, iterative approach to projects. Using this approach, these companies greatly increase their ability to explore AI potential due to a drastically reduced project cycle time and dynamic risk reduction. Short project cycles result in project teams receiving constant feedback on what works and what does not, to continuously steer the direction of the project. This creates a process centered on learning and experimentation, helping to build internal knowledge and capabilities.
Most advanced companies deploy top down or via a hybrid model
With an average competence level of 3.2, Agile Development is an area where companies are self-reported to be reasonably skilled. Quickly establishing proof of concept is key to
organizational buy-in, and many companies report that an agile, iterative approach helps them build evidence and proof in a fraction of the time it takes for a more traditional project,
This has great significance, as they find that tangible proof of concept instrumental in achieving buy-in and understanding in the wider organization. Efforts to develop proof via agile development processes are often orchestrated by a central unit that collaborates with business units to identify
use-cases. Of the most advanced companies, 80% deploy AI into the organization via top down only or a via hybrid of top down and bottom up.
It varies whether these central units take a leading role in pushing the agenda, or instead focus on gathering knowledge and experience from already existing efforts that are decentralized in the organization.
Agility provides the opportunity for informed changes of direction
Taking an iterative approach can also help mitigate risks. Frequent feedback loops allow the project team to better identify, understand, and correct undesired outcomes before the AI application is put into production, potentially doing harm. This flexibility does not only apply to risks, as agile projects can generally use continuing knowledge and experience to make informed changes of direction and avoid the “black box” syndrome.
Contrary to agile projects, ‘big bang’ projects are more destined to fail as they skip the learning process, and lack the important feedback loop pivotal to developing good AI solutions. The world of AI is simply too complex for humans to foresee potential issues, and therefore an agile approach is better.
Learn from the Leaders
Companies seem relatively competent within Agile Development
How competent is your company within Agile Development?
|
|
|
|
|
|
Avg. Score |
|
|
|
|
|
|
3.8 |
|
|
|
|
37% |
30% |
Importance |
|
|
|
16% |
|
|
10% |
6% |
|
|
|
|||
|
|
|
3.2 |
|||
|
|
|
|
|
|
|
|
|
|
|
|
|
Competency |
1 |
2 |
3 |
4 |
5 |
||
|
|
Not competent |
|
Moderately competent |
|
Highly competent |
Linear approach without iteration |
|
Applied agile principles and method- |
|
Agile development fully deployed, with |
||
loops, and limited continuous plan- |
|
ologies, but only limited use outside |
|
people empowered to make quick deci- |
||
ning, testing, integration and feedback |
|
software development functions |
|
sions together across functions |
||
|
|
15 European markets |
|
|
Note: Remaining percent are ‘Don’t know’ responses |
|
|
|
|
|
|||
Agile development new to many business departments
Most companies fully understand the need for agile development, but less reckon that they have the necessary capabilities for it. Working in an agile manner is very different from what most organizations are used to. While the department running an AI project might be accustomed to following an agile approach, the vast majority of project teams consist of people from other parts of the business.
Several IT and AI departments indicate that this collaboration can be difficult, but still see it as pivotal to drive value from the projects. Getting the business accustomed to working in an agile manner is not easy, as it requires acceptance of new ways of governing and evaluating projects.
The outcome of agile projects is typically less predictable than for traditional projects, and for stakeholders to fully embrace an agile approach, they have to accept this randomness and recognize the value of learning.
What to learn from AI leaders:
1.Agile development is effective in engaging people across functions, fostering collaboration, and bridging tech and business.
2.Iterative processes promotes quick internal learning due to their frequent feedback loops
3.Fast experimentation with pilot projects and usecase testing can quickly show how to create value through AI.
We totally believe in an iterative, agile process where you have POCs, then train the bot enough, release it and program the next flows, instead of doing a big bang
solution that will probably fail as these things are not simply plug and play. Start small and then grow it.
—Com Hem
Telecommunications
66 |
67 |
vk.com/id446425943
Learn from the Leaders
7. External Alliances
Entering into partnerships and alliances with academia, solution providers, and AI specialists to access technical capabilities, best practices and talent
AI leaders are increasingly opening up to create collaborative alliances with external partners, enabling them to tap into a significantly larger pool of capabilities and talent, and to reduce the time it takes to develop or deploy working solutions.
This trend seems to be the new modus operandi, unfolding across markets and sectors. It is also the capability with the smallest gap between perceived importance and competence level among the participating companies.
Technology, data, and service delivery partnerships
Development of AI and delivery of related projects are most often done with a mix of internal and external stakeholders. The rationale is multifaceted – some companies are simply struggling to obtain the needed talent, whereas others see a partnership approach to be a faster, more flexible solution. These external alliances typically come in two forms: being focused on technology
and technical AI know-how, or focused on strategy and business development. To address one of the biggest prerequisites of working with AI, access to large amounts of data, companies state that they are increasingly looking to entering into data partnerships where they either buy or exchange data with other parties. This is a way for companies to get hold of data that they are unable to capture themselves, or simply a way of quickly increasing the size of their datasets.
Others report that they look to pre-de- veloped, out-the-box algorithms, in order to increase the speed of bringing quality solutions in to product.
Academia playing a more noticeable role in collaborating with companies
It is becoming increasingly common for companies to enter into partnerships with universities in order to position themselves within AI and get access to crucial knowledge.
We will definitely pursue a partnership strategy. Instead of trying to build everything in-house we will join forces with others to build a strong ecosystem.
—Nilfisk
Manufacturing
Learn from the Leaders
Companies generally consider themselves moderately to highly competent forging External Alliances
How competent is your company within building External Alliances?
|
|
|
|
|
|
Avg. Score |
|
|
|
|
|
|
3.7 |
|
|
|
|
37% |
28% |
Importance |
|
|
|
18% |
|
12% |
|
|
|
|
|
|
||
3% |
|
|
|
3.2 |
||
|
|
|
|
|
|
Competency |
1 |
2 |
3 |
4 |
5 |
||
|
|
Not competent |
|
Moderately competent |
|
Highly competent |
External relations mostly based on |
|
Multiple strategic alliances, often be- |
|
Significant alliances with AI partners |
||
traditional sourcing of external ven- |
|
tween equal partners working collab- |
|
in open eco-systems enabling access |
||
dors providing specific AI services |
|
oratively to mutually benefit from AI |
|
to external assets and (big) data |
||
|
|
15 European markets |
|
|
Note: Remaining percent are ‘Don’t know’ responses |
|
|
|
|
|
|||
Companies also see this as a way of establishing a pipeline of AI talent already familiar with their business and the problems they face. Some of the more ambitious companies have a strategy of positioning themselves within AI, comprised of active conference participation and multiple university partnerships in which they actively participate in developing courses and programs.
Documentation of code is proving a challenge - also to externals
The lack of code documentation for self-learning algorithms was often mentioned as very practical issue with AI in general. This led some companies to prefer internal teams and individuals in order to ensure that despite poor documentation, the knowledge about the code at least stays inhouse.
What to learn from
AI leaders:
1.Make sure to have internal people in the receiving end before widely engaging with external partners.
2.Academic partnerships are an increasingly sought after way to access innovative eco-systems, gain new insights, and explore emerging AI opportunities.
3.Partnerships can pose a challenge to many business processes; consider involving key functions like legal early, to ensure a productive partnership structure and effective collaboration model.
Our way of building our AI capabilities in the company is through innovation. We are innovation driven by the use of start-ups program and trying to develop win-win strategies through partnerships with companies that are not our main competitors.
—Acciona
Infrastructure
68 |
69 |

vk.com/id446425943
Learn from the Leaders
8. Emotional Intelligence
Applying behavioral science to understand and mimic human behavior, address needs, improve human-machine interactions, and ultimately create more human near applications
It is given that we will see the rise of AI. All the big tech companies are spending money on AI capabilities. They have explicit visions to master human thinking and behavior. That may or may not happen in the next five years but certainly
within a certain time frame. When you combine it with computing power, it will be inevitable.
—Skandia
Pensions and insurance
AI has for long focused on cognitive capabilities and skills within mathematics, statistics and logical reasoning. Adding human emotion and intelligence, these capabilities move to a new, more complex level: the understanding of human behavior, and the ability to interact accordingly with technology.
Changing the way people interact with technology
One of the limits of traditional AI has been the inability to understand human traits such as emotional state, for instance exhibited in writing, physical condition, or tone of voice. With AI’s cognitive intelligence capacities within reach, machines are increasingly able to sense, recognize, and decode human traits.
This holds the potential to fundamentally change the way people interact with machines, making technology capable of handling more complex tasks and ultimately augmenting humans to an extent previously unachievable.
Emotional Intelligence in its infancy
Except for advanced companies, survey results indicate that companies view the adoption of emotional intelligence in AI processes as the least important capability, and the one where they have the lowest competency. When asked to address why this is, companies across sectors and markets note that
they are still at a relatively low maturity stage where more immediate requirements such as Advanced Analytics, Data Management and AI Leadership are more relevant and prevalent.
However, when taking a deeper look at the companies that have assessed themselves to be ‘Advanced’ in terms of general AI maturity - meaning that AI is actively contributing to many processes and enabling quite advanced tasks in the company - it is interesting to see that they perceive the Emotional Intelligence capability as more important with a score that is noticeable higher than the average score for all companies.
Many advanced companies perceive this to be either ‘very’ or ‘highly’ important. Notably, these companies come from five different markets and a wide variety of industries, including Life Sciences, Financial Services, TMT, CPR, and Services & Hospitality.
Value in customer-facing applications
The need for behavioral science to understand human needs is expected to increase with the integration of AI in smart devices, and in customer facing applications such as chat bots, roboadvisories, customer inquiries processing, etc. The most advanced companies’ AI technologies are beginning to decode human emotions from text, such as
Learn from the Leaders
Companies consider themselves least capable within Emotional Intelligence
How competent is your company within applying Emotional Intelligence?
|
|
|
|
|
|
Avg. Score |
|
|
|
|
|
|
|
|
3.3 |
|
|
|
29% |
34% |
15% |
Importance |
|
14% |
|
|
|
|
|||
|
|
|
|
|
|||
|
|
|
|
|
|
2% |
2.4 |
|
|
|
|
|
|
Competency |
|
1 |
2 |
3 |
4 |
5 |
|
||
|
|
Not competent |
|
Moderately competent |
|
Highly competent |
|
Limited experience with adopting |
|
Appreciation of behavioral science |
|
Human-centered approach, ethical mind- |
|
||
behavioral science into the AI devel- |
|
and cultivation of uniquely human |
|
set and values that engender trust and |
|
||
opment process, at best outsourced |
|
skills to increase value from AI |
|
human ingenuity beyond business effects |
|
||
|
|
15 European markets |
|
|
Note: Remaining percent are ‘Don’t know’ responses |
|
|
|
|
|
|
|
|||
|
|
|
|
|
|||
irony, anger, and frustration. This will obviously become more valuable as it is increasingly applied in customerfacing solutions with the ability to learn and improve.
Human centrism requires strong leadership
While emotional intelligence holds great potential that could lead to early adopters gaining a competitive advantage, long-term success is dependent on not only technological development, but also leadership.
Leaders must drive the transformation that will make humans comfortable with intelligent technology, as a prerequisite for harvesting its potential benefits. What the most advanced companies have shown is that this transformation must augment human ingenuity to become truly effective.
What to learn from AI leaders:
1.The most advanced companies are putting emotional intelligence to use within their AI applications, despite its relatively infant stage.
2.Companies must develop their behavioral science capabilities to mimick human behavior and translate it to technology.
3.Many have virtual assistants, chat bots, and NLP a powerful way to get started with building emotional intelligence into AI solutions.
70 |
71 |

vk.com/id446425943
Artificial Intelligence in Europe
This is going to go insanely fast, so it is just a matter of hanging in there and identifying which trains to follow.
— Tine Dairy
It’s about having the right mindset. It’s not that tomorrow everything will be different. It’s all about building up capabilities and speeding up constantly. The power of technology in general is overestimated in the short term and underestimated for the longterm and I think that’s the case with AI too.
— VodafoneZiggo Telecommunications
( Case Study ) |
Successful Value Creation |
Novartis
Novartis sees AI as a business necessity, and has CEO-sponsored AI initiatives in several business functions, including drug discovery and clinical trials. In drug discovery, AI systems use predictive hypotheses to systematically and repeatedly search through possibilities, looking for
compounds that interact desirably with biological processes and mechanisms, at a pace much faster than humans can accomplish.
fies more patients who would benefit from a particur drug therapy. This also increases the accuracy of the trials by controlling variables that might confound a study.
AI enhances Novartis’ pa-
tient-centric clinical trials by identifying patients most appropriate for a particular study, including through genetic analysis. By broadening the patient search while simultaneously looking for precise characteristics, AI identi-
Novartis is also exploring how data and AI can support hospital decision-mak- ing and enhance patient treatment outcomes. In so doing, Novartis remains focused on what matters most: patient health.
To support these scientific uses of AI,
Novartis is focused on digitization of workflow, company collaboration, as well as data, data ownership, and data privacy. This includes the legal implications of working with data globally,
including complying with the rules and regulations of various countries, as well as the quality of the data.
As Novartis digitizes its workflow, it pays attention to its culture and people by continuously evaluating
whether its culture is supporting the adoption of AI and other digital advances, and by highlighting agile concepts and enabling its workforce.
Novartis is one of the world’s leadig pharmaceutical companies and one of the largest by both market capitalization and sales. Based in Switzerland, it traces its history back more than 250 years through a comprehensive legacy of companies brought together through mergers and acquisitions. As it exists today, Novartis started in 1996 through the merger of Ciba-Geigy and Sandoz. It develops and produces a wide portfolio of healthcare products, including within oncology, vaccines, eye care and generic medicines. Novartis employs 126,000 people worldwide and brought in $50 billion in revenue in 2017.
What next?
As it looks to the future, Novartis sees AI as a means to improve its drug discovery, clinical trials, and other business functions.
As a leader in the adoption and business benefits of AI, and with its strong reputation for quality and compliance, Novartis is positioned to remain ahead of the pack in AI development and adoption within the heavily regulated pharmaceutical industry.
We have to get the data right in order for new |
Among the risks commonly associated with |
AI developments to be useful. AI allows us to |
AI, the primary AI-related business risk is not |
work faster, share information better, be even |
adopting it fast enough. |
more patient-centric, and extend the reach of |
|
the services we provide. |
|
72 |
73 |

vk.com/id446425943
What’s Next for You?
Fast Forward
How to get started and take AI to the next level?
1. Choose a step-by-step approach in getting familiar with AI
Given the wide scope of AI and variations in use cases, it is key to start out by identifying what problems to solve and what opportunities to pursue. High level prioritizing between engaging customers, optimizing operations, empowering employees and/or transforming products and services adds clarity, is helpful to structure the discussion on a strategic level, and ensures a step-change approach to taking the company to the next AI level. Identify the problems you aim for AI to solve, prioritize the value with business owners, and acknowledge the capability gaps to get there. You need to get on the AI train, but do not jump on the AI wagon blindly. AI should serve your business plan, not vice versa.
Read more in the blog on Linkedin about “AI for businesses: Not if, but when and how” by
Michel van der Bel, Microsoft President, EMEA
2. Display executive leadership and approach AI from a position of strength
Leadership comes from the top, also in the case of AI. For this to happen, executives must understand AI essentials and strategic perspectives, and they must communicate a clear AI ambition to the organization. AI leaders must actively sponsor and mobilize AI adoption on all levels, from the Board and Executive levels, through Management and the operational employees. Staying ahead in the accelerating AI race requires executives to make nimble, informed decisions about where and how to employ AI in their business. When doing so, look to strongholds before bringing in the AI ‘twist’. Amplifying existing company strengths is an excellent way to catalyze motivation and internal support.
Read more customer stories to see how others are using AI to transform their business, and learn from Microsoft Research on how AI is solving the most pressing challenges
3. Hire new skills ahead of the curve –
or focus relentlessly on training existing talent
A key challenge for putting AI to productive use and accelerate intended outcomes is the war for skills and talent. This not only relates to data scientists and software engineers, but also to skill sets and experience within human and behavioral science. Opting for a follower strategy and being late to the game can prove risky, as talent seeks to go where talent is already. If aggressive poaching for insourcing talent is difficult to embrace, then work bottom-up by training the engineers you already have on the new AI paradigm and collaboratively ride on the backs of the others. Regardless of strategy, focusing relentlessly on building required skills and talent is key to staying ahead and progressing along the learning curve.
Learn more in the Microsoft AI School about the open-source cognitive toolkit (previously known as CNTK) and how to help train deep learning algorithms
What’s Next for You?
AI |
4. Build a data strategy and technology stack purposefully fit-for-AI |
|
Training your AI products essentially requires significant data. Useful data. Valid data. Establishing a |
||
|
||
|
solid data strategy and practice in your organization to proficiently acquire data, identify data, clean |
|
|
data, measure data, and manage data will ultimately make your organization flourish with AI. Build |
|
|
your AI resources around data engineers who organize the data, data scientists that investigates the |
|
|
data, software engineers who develop algorithms and implement applications. Make sure that your |
|
|
structure and governance harness the power of data, and that your technology stack across products, |
|
|
solutions, and applications nimbly enables your AI priorities. When doing so, remember that your |
|
|
business model is likely to change. |
|
|
Learn more about how to build a flexible platform and portfolio of AI tools and next generation |
|
|
smart applications where your data lives - whether in the intelligent cloud or on-premise |
5. Beyond all, engender trust and enable human ingenuity
When designed with people at the center, AI can extend companies’ capabilities, free up creative and strategic endeavors, and help achieve more. Humans are the real heroes of AI – design experiences that augment and unlock human potential. Opt for a “people first, technology second” approach. This entails designing AI for where and how people work, play and live, bridging emotional and cognitive intelligence, tailoring experiences to how people use technology, respecting differences, and celebrating the diversity of how people engage, Thereby putting people first, reflects human values and promotes trust in AI solutions.
Learn more in the Microsoft Trust Center and the book ‘The Future Computed’ by Brad Smith and Harry Shum from Microsoft on artificial intelligence and its role in society
Designing for people
At Microsoft we believe that, when designed with people at the center, AI can extend your capabilities, free you up for more creative and strategic endeavors, and help you or your organization achieve more.
The following principles guide the way we design and develop our products:
•Humans are the heroes. People first, technology second. Design experiences that augment and unlock human potential.
•Know the context. Context defines meaning. Design for where and how people work, play, and live.
•Balance EQ and IQ. Design experiences that bridge emotional and cognitive intelligence.
•Evolve over time. Design for adaptation. Tailor experiences for how people use technology.
•Honor societal values. Design to respect differences and celebrate a diversity of experiences.
Innovation is what creates tomorrow.
Learn about our AI platform to innovate and accelerate with powerful tools and services that bring AI to every developer.
Explore Intelligent applications where you can experience the intelligence built into Microsoft products and services you use every day.
Learn about AI for business. Use AI to drive digital transformation with accelerators, solutions, and practices that empower your organization.
74 |
75 |

vk.com/id446425943
What’s Next for You?
Who to Contact
from Microsoft
The team that can empower your company to achieve more with AI
|
|
|
|
|
|
|
|
Pekka Horo |
Santina Franchi |
Michel N’guettia |
Roberto Andreoli |
||||
General Manager, Marketing |
General Manager, Enterprise |
Business Group Lead Cloud |
Director Data, Artificial Intel- |
||||
& Operations, Microsoft WE |
Commercial, Microsoft WE |
& Enterprise, Cloud & Enter- |
ligence and IoT, Microsoft WE |
||||
|
|
|
|
|
prise Marketing Group, Mi- |
|
|
Pekka is leading the market- |
Santina empowers Micro- |
crosoft WE |
|
|
|||
ing, business operations and |
soft’s largest customers |
|
|
|
|||
planning teams for Micro- |
and partners in their digital |
Michel N’guettia is responsi- |
Roberto Andreoli is passion- |
||||
soft’s Western Europe area. |
transformation. Passionate |
ble for marketing Microsoft’s |
ate in improving people’s live |
||||
Prior to his current role, he |
about customers she is fo- |
infrastructure software, data |
and supporting WE organiza- |
||||
was the country General |
cused on bringing relevant |
platform and cloud platform, |
tions in digitally transforming |
||||
Manager for Microsoft’s |
industry and/or role scenar- |
helping WE companies trans- |
through Data and AI. He |
||||
subsidiary in Finland starting |
io’s towards business and |
form their businesses and |
empowers WE organizations |
||||
in that role in 2015. Pekka |
technical audiences in these |
increase agility. |
in evangelizing and guiding |
||||
joined Microsoft through |
organizations, in very close |
|
them through all the differ- |
||||
the Nokia devices & services |
collaboration with our Servic- |
He empowers IT profession- |
ent AI technologies, sup- |
||||
business acquisition in 2014. |
es organization and the Mi- |
als, developers and business |
porting in their AI maturity |
||||
Pekka began his career as |
crosoft partner eco-system. |
decision makers to deliver |
journey and help to make the |
||||
a consultant at McKinsey & |
Previously Santina Franchi |
innovation to their organi- |
implementation of Data and |
||||
Company, and then over a 10 |
held several international |
zations with Microsoft Azure |
AI a success by applying a |
||||
year career at Nokia, he held |
executive positions at SAP |
Cloud Computing Platform |
360° approach. Andreoli held |
||||
various global and regional |
and IBM. |
& Services, Windows Server, |
several national and interna- |
||||
leadership roles in business |
|
|
SQL Server, and Visual Studio. |
tional positions at Microsoft |
|||
management, product and |
|
|
|
across audiences and prod- |
|||
portfolio management and |
|
|
Prior to leading the Cloud & |
ucts. He has been focusing |
|||
strategy & business devel- |
|
|
Enterprise business in West- |
on Public Sector, Small and |
|||
opment. Pekka is inspired |
|
|
ern Europe, N’guettia headed |
Medium Business, Technical |
|||
by Microsoft’s mission to |
|
|
the Server & Tools business |
Evangelism, Dynamics and |
|||
empower every person and |
|
|
in The Netherlands and lead |
our Services organization. |
|||
every organization on the |
|
|
Product Marketing at HP |
Previously he worked at SAP |
|||
planet to achieve more. He |
|
|
Software, ISV’s and Software |
and Cedati, now part of the |
|||
sees significant growth and |
|
|
Incubation businesses. |
Altran group. |
|||
value creation opportunities |
|
|
|
|
|
||
that can be achieved through |
|
|
|
|
|
||
digital transformation. |
|
|
|
|
|
||
76 |
77 |

vk.com/id446425943
What’s Next for You?
Contributors
from EY
Team responsible for the European edition of the study ‘Artificial Intelligence Report: Outlook for 2019 and Beyond’
|
|
|
|
|
Thomas Holm Møller |
Dr. Ellen Czaika |
|||
Partner EY | |
Innovation, Analytics, Digital |
|||
Co-founder EY-Box |
Deputy Leader, EMEIA |
|||
Thomas.moeller@dk.ey.com |
Ellen.czaika@parthenon.ey.com |
|||
EY-Box is focused on digital strategy, growth ventures, innovation architecture and tech-led transactions. Thomas works with leading companies to uncover plausible futures, launch new businesses, and rewire their
core through data and digital in the search for new profit pools and business models. He serves on the board for several entrepreneurial growth-stage businesses.
Thomas is responsible for the AI study across 15 markets
in collaboration with central and local EY strategy teams and AI specialists.
Ellen is a PhD in technology, policy, and management from MIT. She has masters degrees in engineering management and system design from MIT and in applied statistics from the University of Oxford. Ellen advised this study on research design, methodology, and analysis.
Ellen is engaged in the EY EMEIA Center of Excellence on innovation, analytics, and digital. She has worked with global organizations and start-ups, having recently served as the head of R&D for a precision Ag startup that uses AI to assist farmers.
Hanne Jesca Bax |
Vivek Nijhon |
Managing Partner Markets & |
Partner, Advisory, Global |
Accounts, EMEIA |
Lead AI & Robotics, EMEIA |
Hanne.jesca.bax@nl.ey.com |
Vnijhon@uk.ey.com |
Hanne Jesca Bax is the EMEIA Managing Partner Markets & Accounts and a member of EY’s EMEIA Executive. Hanne Jesca is responsible for leading EY’s integrated go-to-market and client service strategies for digital and emerging technologies, including AI and cognitive solutions. Further, she
is responsible for key account management, service portfolio innovation, strategic alliances and acquisitions, managed services, and asset based solutions.
Hanne Jesca serves as overall responsible for EY’s regional AI leads that have contributed to this study.
Vivek is EMEIA head of Intelligent Automation and established this business for EY three years back. Previous to EY, he has held senior leadership positions in the IT industry where he managed large scale BPO implementation programs globally and advised large fortune client on their global technology and offshoring strategies. In his intelligent automation role he is focused on building EY’s services within AI and cognitive, as has been involved in this study as a central AI content lead across the EMEIA regions.
Based in Copenhagen. |
Based in Zürich. |
Based in Amsterdam. |
Based in London. |
79

vk.com/id446425943

vk.com/id446425943
Ежеквартальный
обзор рынка нефти и газа России и Казахстана
Энергетический Центр EY
Центральная, Восточная, ЮгоВосточная Европа и Центральная Азия
Апрель 2019 г.
vk.com/id446425943
Апрель 2019 г.
Содержание
Определения ......................................................................................................................... |
2 |
||
1. |
Макроэкономика и рынки............................................................................................. |
3 |
|
2. |
Экономика СНГ (Россия и Казахстан)........................................................................... |
4 |
|
2.1 |
|
Россия ................................................................................................................... |
4 |
2.2 |
|
Республика Казахстан............................................................................................ |
5 |
3. |
Что волнует рынок? ..................................................................................................... |
6 |
|
4. |
Цены на углеводороды и динамика чистого дохода ...................................................... |
7 |
|
5. |
Новости ....................................................................................................................... |
8 |
|
5.1 |
|
Россия ................................................................................................................... |
8 |
5.2 |
|
Казахстан .............................................................................................................. |
9 |
6. |
Анализ операционной деятельности нефтегазовой отрасли России ............................ |
10 |
|
6.1 |
|
Добыча ................................................................................................................ |
10 |
6.2 |
|
Нефтепереработка............................................................................................... |
11 |
6.3 |
|
Нефтесервисные услуги ...................................................................................... |
12 |
7. |
Итоги работы нефтегазовых компаний России, Казахстана и мира (4 кв. 2018 г.) ...... |
13 |
|
7.1 |
|
Россия ................................................................................................................. |
13 |
7.1.1 |
Нефтяные компании......................................................................................... |
13 |
|
7.1.1 |
Нефтяные компании (продолжение) ................................................................. |
14 |
|
7.1.1 |
Нефтяные компании (продолжение) ................................................................. |
15 |
|
7.1.2 |
Газовые компании............................................................................................ |
16 |
|
7.2 |
|
Казахстан ............................................................................................................ |
17 |
7.3 |
|
Сравнение ключевых показателей анализируемых компаний СНГ и мира............. |
18 |
7.3Сравнение ключевых показателей анализируемых компаний СНГ и мира
(продолжение) ................................................................................................................. |
19 |
|
7.4 |
Международные «мейджоры».............................................................................. |
20 |
8. |
Темы выпуска............................................................................................................ |
21 |
8.1 |
Динамика спредов по UST: ждать ли нового кризиса на рынках? .......................... |
21 |
8.2 |
Рынок СПГ Японии: конкуренция с атомной генерацией растет ............................ |
21 |
8.3 |
Нефтяные «мейджоры»: взгляд за пределы 2020 г. ............................................. |
22 |
8.4 |
Мировой спрос на нефтепродукты: единой динамики не ожидается...................... |
23 |
9. |
Ключевые темы нефтегазового рынка России ........................................................... |
25 |
9.1 |
Налогообложение в нефтегазовой отрасли .......................................................... |
25 |
9.2 |
Разведка и добыча ............................................................................................... |
25 |
9.3 |
Нефтепереработка и сбыт.................................................................................... |
25 |
9.4 |
Нефтесервисные услуги ...................................................................................... |
25 |
9.5 |
Газовая отрасль ................................................................................................... |
25 |
9.6 |
Транспортировка ................................................................................................. |
25 |
1 Ежеквартальный обзор рынка нефти и газа России и Казахстана
vk.com/id446425943
Апрель 2019 г.
Определения
•Роснефть – ПАО «НК «Роснефть»
•ЛУКОЙЛ – ПАО «ЛУКОЙЛ»
•Газпром нефть – ПАО «Газпром нефть»
•Сургутнефтегаз – ПАО «Сургутнефтегаз»
•Татнефть – ПАО «Татнефть»
•Газпром – ПАО «Газпром»
•НОВАТЭК – ПАО «НОВАТЭК»
•РД КазМунайГаз - АО «Разведка Добыча «КазМунайГаз»
•Nostrum - Nostrum Oil & Gas PLC (ранее ТОО «Жаикмунай»)
•ЦБ – Центральный Банк
•Доход российских нефтегазовых компаний рассчитывается как разница между ценой Urals, экспортной пошлиной на нефть, базовым НДПИ и средними транспортными издержками по маршруту «Западная Сибирь – Приморск»
•Маржа переработки рассчитывается как отношение полученного дохода условного НПЗ в Центральной части России в расчете на один переработанный баррель нефти
•EBITDA расчетный финансовый показатель, определяемый как операционная прибыль до вычета износа и амортизации
•Свободный денежный поток расчетный финансовый показатель, определяемый как разница между денежным потоком от операционной деятельности и капитальными вложениями
•Рентабельность по EBITDA отношение расчетного показателя EBITDA к выручке
•EBITDA/барр. отношение расчетного показателя EBITDA к фактической добыче нефти
•FCF yield - отношение годовой величины свободного денежного потока к текущей капитализации
2 Ежеквартальный обзор рынка нефти и газа России и Казахстана
vk.com/id446425943
Апрель 2019 г.
1.Макроэкономика и рынки
•Экономика США по итогам 4 кв. 2018 г. продолжила замедляться: по данным Бюро экономического анализа Министерства торговли ВВП страны с октября по декабрь вырос на 2,2% против 3,4% в предыдущем квартале (всего по итогам 2018 г. – рост на 2,9% г-к-г). Темпы роста потребительских расходов, на долю которых приходится порядка двух третей ВВП США, в 4 кв. 2018 г. снизились до 2,8% г-к-г по
сравнению с 3,5% г-к-г кварталом ранее. Прогноз ФРС относительно динамики ВВП на 2019 г. был снижен с 2,3% до 2,1%, а на
2020 г. – с 2,0% до 1,9%.
•По итогам заседания ФРС в январе и марте Комитет по открытым рынкам сохранил ключевую ставку на уровне 2,25-2,50%, что было ожидаемо рынком. Однако в протоколе к мартовскому решению по ставке указывается на необходимость «терпения» при определении будущих корректировок целевого диапазона процентной ставки по федеральным кредитным средствам. По заявлениям руководства ФРС, регулятор не планирует повышение ставок в 2019 г., хотя в декабре 2018 г. предполагалось повышение дважды в течение года.
•Возможное окончание цикла ужесточения монетарной политики стало неожиданным для рынка, что спровоцировало падение курса доллара и неравномерное снижение доходности UST по всей кривой.
•В результате, смена парадигмы членов FOMC привела к тому, что в конце марта спред между 10-летними и трехмесячными обязательствами США стал отрицательным (впервые с августа 2007 года). Этот факт дал повод целому ряду аналитиков написать о неизбежном наступлении кризиса на рынках (инверсия доходностей «длинных» и «коротких» бумаг является одним из опережающих индикаторов грядущих экономических проблем). Справедливости ради отметим, что спред между десятилетними и двухлетними UST пока сохраняется выше нулевых отметок, однако вплотную подошел к нулевым отметкам.
•На фоне значительных успехов в процессе переговоров между США и КНР относительно торговый отношений, в Китае наблюдается восстановление PMI производственного сектора выше отметки «50», что говорит о росте деловой активности. По результатам 2019 г. рост китайского ВВП, по официальным прогнозам, ожидается в диапазоне от 6,0% до 6,5% (для сравнения, 6,6% в 2018 г., минимальный уровень с 1990 г.).
Значения индексов Purchasing Managers Index (PMI)1 |
||||||||||
для промышленности2 |
|
|
|
|
|
|||||
|
|
|
|
12.18 |
01.19 |
02.19 |
03.19 |
|||
Мировая экономика |
|
51,5 |
50,7 |
50,6 |
50,6 |
|||||
США |
|
|
|
|
53,8 |
54,9 |
53,0 |
52,4 |
||
Китай |
|
|
|
|
49,4 |
48,3 |
49,9 |
50,8 |
||
Еврозона |
|
|
|
51,4 |
50,5 |
49,3 |
47,5 |
|||
Германия |
|
|
|
51,5 |
49,7 |
47,6 |
44,1 |
|||
Франция |
|
|
|
49,7 |
51,2 |
51,5 |
49,7 |
|||
Италия |
|
|
|
49,2 |
47,8 |
47,7 |
47,4 |
|||
Испания |
|
|
|
51,1 |
52,4 |
49,9 |
50,9 |
|||
Россия |
|
|
|
51,7 |
50,9 |
50,1 |
52,8 |
|||
1 Индексы PMI рассчитываются на основании опроса промышленных и |
||||||||||
сервисных компаний агентством Markit. Значения индексов выше 50 - сигнал |
||||||||||
роста, ниже 50 - сокращения, 50 - стагнация. |
|
|
|
|
||||||
2 Промышленный PMI - композиция индексов, характеризующих выпуск, |
||||||||||
заказы, занятость и других компонентов |
|
|
|
|
|
|||||
Источники: HSBC, Markit |
|
|
|
|
|
|
||||
Динамика индексов к 1 января 2014 г. |
|
|||||||||
2.3 |
|
|
|
|
|
|
|
|
|
|
1.8 |
|
|
|
|
|
|
|
|
|
|
1.3 |
|
|
|
|
|
|
|
|
|
|
0.8 |
|
|
|
|
|
|
|
|
|
|
0.3 |
|
|
|
|
|
|
|
|
|
|
1/1/2014 |
7/1/2014 |
1/1/2015 |
7/1/2015 |
1/1/2016 |
7/1/2016 |
1/1/2017 |
7/1/2017 |
1/1/2018 |
7/1/2018 |
1/1/2019 |
РТС |
|
MSCI World Energy Sector |
|
||
FTSE Index (Великобритания) |
|
Dow Jones |
|
||
Nikkei Index (Япония) |
|
Shanghai SE Composite Index |
|
||
Bovespa Index (Бразилия) |
|
|
Динамика доходности по облигациям c |
|
1 января 2014 г. |
|
15% |
|
10% |
|
5% |
|
0% |
|
янв-14 мар-14 май-14 июл-14 сен-14 ноя-14 янв-15 мар-15 май-15 июл-15 сен-15 ноя-15 янв-16 мар-16 май-16 июл-16 сен-16 ноя-16 янв-17 мар-17 май-17 июл-17 сен-17 ноя-17 янв-18 мар-18 май-18 июл-18 сен-18 ноя-18 янв-19 мар-19 |
|
US Treasury |
Гособлигации Италии |
Гособлигации Испании |
Гособлигации Китая |
Гособлигации Греции |
|
Источники: Bloomberg, Энергетический Центр EY (Центральная, Восточная, Юго-Восточная Европа и Центральная Азия)
3 Ежеквартальный обзор рынка нефти и газа России и Казахстана

vk.com/id446425943
Апрель 2019 г.
2.Экономика СНГ (Россия и Казахстан)
2.1Россия
•Согласно данным Росстата, реальный рост ВВП России в 2018 г. достиг рекордных за последние шесть лет 2,3% г-к-г, что оказалось существенно выше ожиданий как Министерства экономического развития РФ, так и ЦБ РФ (в коридоре 1,5-2,0% г-к-г). Наибольший рост продемонстрировали финансы и страхование (+6,2%), сегмент гостиниц и предприятий общественного питания (+6,2% в большей степени за счет летнего ЧМ по футболу) и строительство (+4,7%), в то время как в сельском хозяйстве наблюдалось снижение на 2% г-к-г. В добыче полезных ископаемых добавленная стоимость выросла на 3,8%.
•По оценкам Минэкономразвития России, рост экономики в 2019 г. может составить 1,3%. Прогноз ЦБ РФ находится в интервале 1,2-1,7%.
•Индекс потребительских цен в 1 кв. 2019 г. составил 5,2% г-к-г (для сравнения, 3,9% г-к-г в 4 кв. 2018 г. и 2,2% г-к-г в 1 кв. 2018 г.). При этом, по оценке ЦБ РФ вклад повышения НДС с 01.01.2019 г. в годовые темпы прироста потребительских цен (около 0,6–0,7 п.п.) в значительной мере реализовался, однако в ближайшие месяцы возможно проявление отложенных эффектов. В результате, на фоне снижения краткосрочных проинфляционных рисков, Банк России в конце марта скорректировал прогноз годовой инфляции на конец 2019 г.
с 5,0–5,5% до 4,7–5,2% (с возвращением к целевым 4% в первой половине 2020 г.).
•На этом фоне ЦБ в марте принял решение сохранить ключевую ставку на уровне 7,75% годовых. При сохранении благоприятной инфляционной картины Банк России допускает переход к снижению ключевой ставки в 2019 г.
Динамика курса рубля к доллару и евро |
|
(RUB) |
|
100 |
|
80 |
|
60 |
|
40 |
|
20 |
|
0 |
|
янв-14 мар-14 май-14 июл-14 сен-14 ноя-14 янв-15 мар-15 май-15 июл-15 сен-15 ноя-15 янв-16 мар-16 май-16 июл-16 сен-16 ноя-16 янв-17 мар-17 май-17 июл-17 сен-17 ноя-17 янв-18 мар-18 май-18 июл-18 сен-18 ноя-18 янв-19 мар-19 |
|
RUB/EUR |
RUB/USD |
Источники: Bloomberg, Энергетический Центр EY (Центральная, Восточная, Юго-Восточная Европа и Центральная Азия)
Динамика доходности гособлигаций Россия-30, с начала 2014 г.
8.0
6.0
4.0
2.0
0.0
1 янв-14 10 апр-14 20 июл-14 1-ноя-14 10-фев-15 20-май-15 1-сен-15 10-дек-15 20-мар-16 1-июл-16 10-окт-16 20-янв-17 1-май-17 10-авг-17 20-ноя-17 1-мар-18 10-июн-18 20-сен-18 1-янв-19
Источники: Bloomberg, Reuters
4 Ежеквартальный обзор рынка нефти и газа России и Казахстана

vk.com/id446425943 |
|
|
|
|
|
Апрель 2019 г. |
|
|
|
2.2 |
Республика Казахстан |
• |
По заявлению Нацбанка, дальнейшие |
|
|
|
|
решения по базовой ставке будут |
|
|
• По итогам 1 кв. 2019 г. ВВП Казахстана |
|
направлены на удержание инфляции в |
|
|
увеличился на 3,8% г-к-г (4,1% - за |
|
рамках целевых ориентиров. Однако, в |
|
|
аналогичный период годом ранее). По |
|
целом регулятор намерен сохранить |
|
|
данным Министерства национальной |
|
денежно-кредитные условия на |
|
|
экономики РК, продолжающемуся росту |
|
нейтральном уровне для поддержания |
|
|
экономики способствовало улучшение |
|
темпов экономического роста. |
|
|
целого ряда показателей: прирост |
Динамика инфляции в Казахстане, г-к-г |
||
|
инвестиций в основной капитал (+7,0%), |
|||
|
|
|
|
|
|
увеличение объема промышленного |
20% |
|
|
|
производства (+3,2%) и строительных |
15% |
|
|
|
работ (+8,9%). Положительная динамика |
10% |
|
|
|
наблюдалась также в торговле (+7,2%), |
|
|
|
|
5% |
|
|
|
|
транспортной сфере (+4,4%) и сельском |
|
|
|
|
|
|
|
|
|
хозяйстве (+3,6%). |
0% |
янв-14 мар-14 май-14 июл-14 сен-14 ноя-14 янв-15 мар-15 май-15 июл-15 сен-15 ноя-15 янв-16 мар-16 май-16 июл-16 сен-16 ноя-16 янв-17 мар-17 май-17 июл-17 сен-17 ноя-17 янв-18 мар-18 май-18 июл-18 сен-18 ноя-18 янв-19 мар-19 |
|
|
|
|||
|
• Министерство национальной экономики РК |
|
||
|
сохраняет прогноз по темпам прироста |
|
|
|
|
ВВП в 2019 г. на уровне 3,8%. |
Динамика курса тенге к доллару и евро |
||
|
Международные эксперты (МВФ, |
|||
|
|
|
|
|
|
Всемирный банк, Евразийский банк |
500 |
|
|
|
развития) ожидают чуть более низких |
400 |
|
|
|
показателей – 3,2-3,5%. Среди основных |
|
|
|
|
300 |
|
|
|
|
причин небольшого «охлаждения» |
|
|
|
|
|
|
|
|
|
экономики РК называются более слабый |
200 |
|
|
|
|
|
|
|
|
рост добычи нефти (согласно прогнозам), |
100 |
янв-14 мар-14 май-14 июл-14 сен-14 ноя-14 янв-15 мар-15 май-15 июл-15 сен-15 ноя-15 янв-16 мар-16 май-16 июл-16 сен-16 ноя-16 янв-17 мар-17 май-17 июл-17 сен-17 ноя-17 янв-18 мар-18 май-18 июл-18 сен-18 ноя-18 янв-19 мар-19 |
|
|
продолжение реализации мер по |
|
||
|
|
|
|
|
|
оздоровлению бюджета и замедление |
|
|
|
|
экономической активности у основных |
|
KZT/EUR |
KZT/USD |
|
торговых партнеров. |
Динамика индекса промышленного |
||
|
|
|||
|
• В 1 кв. 2019 г. в стране наблюдалось |
производства, мес-к-мес |
|
|
|
|
|
|
|
|
улучшение инфляционной картины: 4,8% |
20% |
|
|
|
г-к-г в марте против 5,2% г-к-г в феврале и |
|
||
|
10% |
|
||
|
январе. Снижение инфляции обусловлено, |
|
||
|
|
|
|
|
|
главным образом, динамикой цен и |
0% |
|
|
|
|
|
|
|
|
тарифов на платные услуги (годовой |
-10% |
|
|
|
прирост по ним замедлился до 1,2%). В |
-20% |
|
|
|
целом, Нацбанк РК оценивает текущий |
|
янв-14 мар-14 май-14 июл-14 сен-14 ноя-14 янв-15 мар-15 май-15 июл-15 сен-15 ноя-15 янв-16 мар-16 май-16 июл-16 сен-16 ноя-16 янв-17 мар-17 май-17 июл-17 сен-17 ноя-17 янв-18 мар-18 май-18 июл-18 сен-18 ноя-18 янв-19 |
|
|
|
|
|
|
|
инфляционный фон как умеренный. |
|
|
|
|
Целевой коридор по инфляции на 2019 г. |
|
|
|
|
сохраняется в диапазоне 4-6%. |
Источники: Комитет по статистике МНЭ РК, |
||
|
• По результатам заседания в середине |
Национальный банк РК |
|
|
|
|
|
|
|
|
апреля регулятор принял решение о |
|
|
|
|
снижении базовой ставки до уровня 9,0%. |
|
|
|
|
Основными факторами в пользу |
|
|
|
|
корректировки стали: замедление годовой |
|
|
|
|
инфляции и стабилизация курса тенге, |
|
|
|
|
расширение потребительского и |
|
|
|
|
инвестиционного спроса, рост деловой |
|
|
|
|
активности, а также благоприятные |
|
|
|
|
тенденции на внешних сырьевых рынках. |
|
|
|
5 Ежеквартальный обзор рынка нефти и газа России и Казахстана

vk.com/id446425943
Апрель 2019 г.
3.Что волнует рынок?
•В апреле котировки Brent преодолели отметку в $70/барр., превысив прошлогодний консенсус-прогноз ведущих отраслевых аналитиков и экспертов на $8/барр. По сути, такая динамика нефтяных цен была предопределена тремя основными элементами.
•Во-первых, охлаждение мировой экономики (оказывает влияние на динамику спроса на сырье) происходит не столь быстрыми темпами, как это прогнозировалось еще несколько месяцев назад. В частности, темпы роста китайской экономики в 1 кв. 2019 г. остаются выше 6%, мартовская статистика по созданию рабочих мест в США оказалось выше ожиданий (около 200 тыс. против 180 тыс.), затяжное падение индекса Global PMI mfg приостановилось.
•Во-вторых, аппетит инвесторов к риску остается на достаточно высоком уровне (несмотря на перманентно возникающие опасения относительно дальнейшего развития ситуации на финансовых рынках Турции и Аргентины), что трансформируется в покупки рисковых активов, включая нефтяные фьючерсы. Ну, и наконец, в условиях продолжающегося падения добычи в Венесуэле и Иране на рынке появился дополнительный геополитический риск, связанный с Ливией.
•В сложившихся условиях перенос встречи стран-участниц соглашения «ОПЕК+» со второй декады апреля на 26 июня (дату завершения действия нынешнего договора) едва ли стал неожиданным – текущая картина выглядит благоприятной для производителей нефти как с точки зрения фундаментальных (см. график динамики коммерческих запасов нефти в странах ОЭСР), так и спекулятивных факторов (см. динамику CDS ряда EM). И, как следствие, если в ближайшее время не произойдет что-то экстраординарное, то ведущие мировые инвестбанки продолжат пересматривать свои прогнозы по цене на нефть в сторону повышения.
•Главный риск – это неопределенность в отношении дальнейшей политики ФРС (более подробно об итогах заседания FOMC см. раздел «Темы выпуска»), а также сохраняющиеся дисбалансы в экономике отдельных развивающихся стран.
Коммерческие запасы жидких углеводородов в ОЭСР (млн барр.),
2014-2020(П) гг.
3200 |
|
|
|
|
|
70 |
3000 |
|
|
|
|
|
65 |
2800 |
|
|
|
|
|
60 |
2600 |
|
|
|
|
|
55 |
2400 |
|
|
|
|
|
50 |
янв-14 |
май-14 |
сен-14 |
янв-15 |
май-15 сен-15 янв-16 май-16 сен-16 янв-17 май-17 сен-17 янв-18 май-18 сен-18 янв-19 май-19 сен-19 янв-20 |
май-20 |
сен-20 |
|
|
|
|
Коммерческие запасы жидких углеводородов |
|
|
|
|
|
|
Количество дней предложения (правая ось) |
|
|
Источник: EIA
Изменение CDS* по развивающимся странам в 2019 г. (середина апреля vs. начало января), б.п.
0
-20
-40
-60
-80
-100
Россия |
Китай |
Мексика |
ЮАР |
Бразилия |
Индия |
Казахстан |
Венгрия |
Украина |
* пятилетние
Источники: Bloomberg, Энергетический Центр EY (Центральная, Восточная, Юго-Восточная Европа и Центральная Азия)
6 Ежеквартальный обзор рынка нефти и газа России и Казахстана

vk.com/id446425943
Апрель 2019 г.
4.Цены на углеводороды и динамика чистого дохода
•Коррекция на нефтяном рынке, начавшаяся в конце прошлого года, не получила своего развития, и в апреле котировки вернулись в район $70/барр. (прирост к локальным минимумам ноября – почти 20%). Более подробно о причинах наблюдаемой динамики см. раздел «Что волнует рынок?».
•Форвардная кривая вернулась в положение «бэквордации» из пограничного с «контанго» состояния. Текущий диапазон рыночных ожиданий варьируется от $55 до $73 за баррель.
•Дисконт американского сорта WTI к европейскому Brent в 1 кв. 2019 г. сохранился на уровне $8,5/барр. на фоне сохраняющейся ситуации с логистикой на формации Permian.
•Стоимость природного газа на терминале Henry Hub в 1 кв. 2018 г. сохранились на уровне аналогичного периода прошлого года ($102/тыс. куб. м.): повышенный спрос, связанный с установившимися морозами, был нивелирован отрицательными ценами на попутный газ в регионе Permian (хаб Waha). Столь аномальная ситуация обусловлена тем, что ускоренный рост нефтедобычи на крупнейшей «сланцевой» формации привел к появлению избытка ПНГ и отсутствию достаточных мощностей по его подготовке и транспортировке.
•Снижение цен на газ в Европе в 1 кв. 2019 г. (-17% г-к-г в среднем по котировкам NBP и Zeebruge до
~$223/тыс. куб. м.) обусловлено более теплой погодой в сравнении с аналогичным периодом 2018 г. При этом, дополнительное давление на котировки оказал факт заполненности ПХГ: на конец марта ~40%, по данным Gas Infrastructure Europe, по сравнению с 18% годом ранее.
•Несмотря на взлет нефтяных котировок в район $70/барр., цены на СПГ контракты, базирующие на JCC, имеющие существенную зависимость от них, сократились по на 13% г-к-г (до ~$315/тыс. куб. м), что обусловлено продолжающимся ренессансом атомной энергетики в Японии (несмотря на трагедию с Фукусимой за последние 3 года в стране было введено в
строй 9 блоков АЭС и еще 6 получили необходимые разрешения на
строительство). Снижение японского импорта СПГ (на ~10 млн т в 2019-20 гг.) на фоне прогнозируемого ввода мощностей по сжижению (~80 млн т в ближайшие 3-5 лет) может привести к локальному профициту мощностей и «отвязке» цен СПГ для отдельных поставок от нефтяных котировок. При этом, в Китае объемы импорта СПГ продолжают увеличиваться, но более медленными темпами (+20% г-к-г в январе-феврале 2019 г. vs. 57% г-к-г в аналогичный период прошлого года).
Динамика цен на углеводороды |
|
|
|
(нефть - $/барр., газ - $/1000 куб. м) |
|
||
150 |
|
|
600 |
100 |
|
|
400 |
50 |
|
|
200 |
0 |
|
|
0 |
июн-14 сен-14 дек-14 мар-15 июн-15 сен-15 |
дек-15 мар-16 июн-16 сен-16 дек-16 мар-17 июн-17 сен-17 дек-17 |
мар-18 июн-18 сен-18 дек-18 |
мар-19 |
WTI |
Brent |
Urals |
|
Henry Hub |
NBP |
СПГ Япония |
|
Газпром |
|
|
|
Источники: Bloomberg, Министерство экономики, |
|
||
торговли и промышленности Японии, Энергетический |
|||
Центр EY (Центральная, Восточная, Юго-Восточная |
|
||
Европа и Центральная Азия) |
|
|
|
Прогноз цены Brent, март 2019 г. ($/барр.) |
|||||
70 |
|
|
|
|
|
65 |
|
|
|
|
|
60 |
|
|
|
|
|
55 |
2019 |
3 кв. 2019 |
4 кв. 2019 |
1 кв. 2020 |
2 кв. 2020 |
2 кв. |
|||||
Медианные прогнозы рынка |
Форвардные контракты |
||||
Источник: Bloomberg
Динамика дохода российских нефтедобывающих компаний ($/барр.)
120
100
80
60
40
20
0
14 14 14 14 14 14 15 15 15 15 15 15 16 16 16 16 16 16 17 17 17 17 17 17 18 18 18 18 18 18 19 19 |
|||||||||||||||
- - |
- |
- - - |
- |
- - - |
- |
- - - |
- |
- - - |
- |
- - - |
|||||
янв |
сенянв |
|
сенянв |
сенянв |
|
сенянв |
сенянв |
||||||||
|
мар майиюл |
ноя мар майиюл |
ноя мар майиюл |
ноя мар майиюл |
ноя мар майиюл |
ноя мар |
|||||||||
|
Чистый доход НК |
|
|
Экспортная пошлина |
|
НДПИ |
|
|
Транспорт |
||||||
|
|
|
|
|
|||||||||||
|
|
|
|
|
|||||||||||
Источник: Энергетический Центр EY (Центральная, Восточная, Юго-Восточная Европа и Центральная Азия)
7 Ежеквартальный обзор рынка нефти и газа России и Казахстана
vk.com/id446425943
Апрель 2019 г.
5.Новости
5.1Россия
Утверждение плана мероприятий по развитию нефтегазохимического комплекса в России на период до 2025 г.
(Нефть России, 14.03.2019 г.)
•Одной из ключевых целей программы развития нефтегазохимического комплекса является увеличение объемов экспорта продукции с $17,4 до $37 млрд к 2025 г.
•В рамках реализации плана предполагается разработка до октября 2019 г. нормативно-правовых актов, предусматривающих механизмы стимулирования инвестиций в развитие нефтегазохимических мощностей.
•План мероприятий, в частности, предусматривает: (а) создание налоговых стимулов для выделения этана из природного газа и переработки его в нефтегазохимическую продукцию (предположительно за счет введения вычетов по акцизам для мощностей, введенных в эксплуатацию или реконструированных для целей извлечения этана после 01.01.2022 г.); (б) изменение ставки ЭП на СУГ с целью расширения их использования на внутреннем рынке качестве моторного топлива и сырья для нефтегазохимии; (в) разработка механизма отрицательного акциза российским переработчикам СУГ за счет доходов от изменения ставки ЭП на них; (г) подготовка мер поддержки НИОКР в отношении продукции с высоким потенциалом импортозамещения и прочее.
Продажа 10%-ной доли в «Арктик СПГ 2»
(Interfax, 05.03.2019 г.)
•В рамках обязывающего соглашения об условиях вхождения в проект «Арктик СПГ 2», заключенного в мае 2018 г. компании НОВАТЭК и Total подписали договор купли-продажи в
отношении 10% доли участия, с закрытием сделки в 1 кв. 2019 г.
•При этом, французская компания имеет право довести долю в проекте до 15% в случае, если НОВАТЭК снизит свое участие ниже 60%.
•Total планирует осуществлять вывоз продукции по Северному морскому пути с перегрузкой на терминале на Камчатке для поставки в Азию и на терминале около Мурманска с грузами, направляющимися в Европу.
Планы по строительству СПГ-терминала компании НОВАТЭК на Камчатке
(Ведомости, 19.03.2019 г.)
•14 марта распоряжением Правительства РФ был утвержден комплексный план реализации инвестиционного проекта «Морской перегрузочный комплекс сжиженного природного газа в Камчатском крае».
•Получение разрешения на строительство перегрузочного комплекса (общая мощность – 21,7 млн тонн в год) НОВАТЭК может получить в начале 2020 г. при соблюдении оператором проекта сроков прохождения госэкспертизы. Завершение строительства первого пускового комплекса ожидается в 2022 г., второго – в 2023 г. Полная загрузка терминала может быть достигнута в 2026 г., что позволит увеличить перевозки по Северному морскому пути с 9,7 до 31,7 млн тонн.
•Стоимость проекта оценивается примерно в 108 млрд руб. (вкл. 70 млрд руб. инвестиций со стороны НОВАТЭКа и потенциальных партнеров)
Разрешение на транспортировку СПГ по Северному морскому пути для некоторых иностранных судов
(РИА Новости, 18.03.2019 г.)
•Согласно распоряжению Правительства РФ, иностранные суда, договоры фрахтования которых заключены не менее чем на 15 лет, получают право перевозки по Северному морскому пути до 30 декабря 2043 г. природного газа (вкл.
СПГ) и конденсата, добытого в России и загруженного в порту Сабетта, до первого пункта выгрузки или перегрузки.
8 Ежеквартальный обзор рынка нефти и газа России и Казахстана
vk.com/id446425943
Апрель 2019 г.
5.2Казахстан
Изменение законодательной базы в отношении экспорта нефтепродуктов из Казахстана
(ИнфоТЭК, 3-2019)
•4 марта Президент Республики Казахстан подписал закон «О ратификации протокола о внесении изменений в соглашение между правительствами Казахстана и Российской Федерацией о топливно-экономическом сотрудничестве в области поставок нефти и нефтепродуктов в Республику Казахстан от 9 декабря 2010 года». Основная причина корректировок - увлечение производства светлых нефтепродуктов вследствие завершения модернизации НПЗ Казахстана.
•В рамках изменений из-под условий соглашения выводится перечень нефтепродуктов, запрещенных к экспорту из Казахстана за пределы Таможенного союза, а также нефтепродуктов, запрещенных к вывозу из России в Республику Казахстан.
•В результате, по заявлению Министерства энергетики Казахстана, страна может начать экспорт нефтепродуктов в 1 пол. 2019 г. в страны Центральной Азии.
Запрет ввоза автомобильного бензина из России железнодорожным транспортом
(Нефтегазовая вертикаль, 22.02.2019 г.)
•19 февраля власти Казахстана ввели запрет на железнодорожные поставки российского бензина на три месяца. Данные меры были обусловлены избытком топлива на внутреннем рынке Казахстана.
Планы по строительству завода топливных присадок
(ИнфоТЭК, 1-2019)
•Итальянская компания Chimec S.p.A. заключила меморандум с СЭЗ «Павлодар» о строительстве завода по производству присадок для бензина (стоимостью около $6,6 млн) с применением сырья в виде отходов нефтяного производства с Павлодарского НПЗ.
•Согласно прописанным в документе срокам строительство может начаться в августе текущего года.
•Предполагается, что строительство будет осуществляться совместно с ТОО «КазМунайХим».
9 Ежеквартальный обзор рынка нефти и газа России и Казахстана

vk.com/id446425943
Апрель 2019 г.
6.Анализ операционной деятельности нефтегазовой отрасли России
6.1Добыча
•В 1 кв. 2019 г. объем добычи нефти и газового конденсата в России составил 11,34 млн барр./сутки (-1% кв-к-кв или -80 тыс. барр./сутки). Основным триггером снижения послужило принятое в начале декабря 2018 г. решение странучастниц «ОПЕК+» о совокупном сокращении добычи в первом полугодии 2019 г. на 1,2 млн барр./сутки от уровня октября 2018 г., в том числе на долю РФ приходится 228 тыс. барр./сутки. По состоянию на март 2019 г. выполнение таргета, предусмотренного соглашением, достигло в России 50%.
•Суммарные объемы производства нефтяных компаний в 1 кв. 2019 г. снизились на ~86 тыс. барр./сутки кв-к-кв: на Роснефть пришлось порядка 43% от общего сокращения по крупнейшим 6 компаниям, на Татнефть – 23%, на
Газпром нефть – 18%, на ЛУКОЙЛ – 14%. Производители газового конденсатов и участники СРП нарастили добычу на 13 тыс. барр./сутки и 3 тыс. барр./сутки кв-к-кв соответственно, независимые и
прочие компании снизили производство на 10 тыс. барр./сутки.
•По оперативным данным, добыча газа в России (вкл. ПНГ) в 1 кв. 2019 г. установила новый исторический максимум, достигнув 200 млрд куб. м. Среднесуточный объем производства составил 2,22 млрд куб. м, что на 3% выше уровня 1 кв. 2018 г. (предыдущий рекорд) и на 16-17% выше значений аналогичных периодов 2015-2016 гг. Доля Газпрома в общероссийской добыче газа по итогам января-февраля 2019 г. составила ~66%, что немного ниже уровней 1 кв. 2017-
2018 гг. (~67-68%).
Динамика удельных затрат на добычу по |
|
|||||
компаниям ($/барр.) |
|
|
|
|
|
|
6.0 |
|
|
|
|
|
|
5.0 |
|
|
|
|
|
|
4.0 |
|
|
|
|
|
|
3.0 |
|
|
|
|
|
|
2.0 |
|
|
|
|
|
|
Роснефть |
ЛУКОЙЛ |
Газпром нефть |
Татнефть |
|
||
1 кв. 2016 |
2 кв. 2016 |
|
3 кв. 2016 |
4 кв. 2016 |
|
|
1 кв. 2017 |
2 кв. 2017 |
|
3 кв. 2017 |
4 кв. 2017 |
|
|
1 кв. 2018 |
2 кв. 2018 |
|
3 кв. 2018 |
4 кв. 2018 |
|
|
Источник: отчетности компаний |
|
|
|
|||
Добыча углеводородов в России по компаниям |
|
|
||||
|
|
|
|
|
|
% |
|
03.18 |
01.19 |
02.19 |
03.19 |
(03.19), |
|
|
|
|
|
|
|
г-к-г |
Нефть |
10,97 |
11,38 |
11,34 |
11,30 |
+3,0% |
|
(млн.барр./ |
|
|
|
|
|
|
сутки) |
|
|
|
|
|
|
Роснефть |
4,20 |
|
4,37 |
4,34 |
4,32 |
+2,9% |
ЛУКОЙЛ |
1,63 |
|
1,66 |
1,66 |
1,65 |
+1,1% |
Газпром |
0,78 |
|
0,78 |
0,76 |
0,76 |
-3,0% |
нефть |
|
|
|
|
|
|
Сургут- |
1,21 |
|
1,24 |
1,23 |
1,22 |
+1,6% |
нефтегаз |
|
|
|
|
|
|
Татнефть |
0,58 |
|
0,60 |
0,60 |
0,59 |
+2,7% |
Газ |
2,17 |
|
2,23 |
2,26 |
2,18 |
+0,4% |
(млрд.куб.м/ |
|
|
|
|
|
|
сутки) |
|
|
|
|
|
|
Газпром |
1,46 |
|
1,47 |
1,47 |
н.д. |
н.д. |
НОВАТЭК2 |
0,12 |
|
0,18 |
0,20 |
0,20 |
+57,7% |
2 Без учета долей СП |
|
|
|
|
|
|
Источники: ИнфоТЭК, «Интерфакс» |
|
|
||||
Динамика среднесуточной добычи нефти |
|
|||||
(млн барр./сутки) |
|
|
|
|
|
|
11.0 |
6% |
10.8 |
4% |
10.6 |
2% |
10.4 |
0% |
10.2 |
-2% |
10.0 |
-4% |
14 14 14 14 14 14 15 15 15 15 15 15 16 16 16 16 16 16 17 17 17 17 17 17 18 18 18 18 18 18 19 19 |
||||
- - - - - - - - - - - - - - - - - - - - - - - - - - |
||||
янв- - сен янв - сен янв - сен |
янв - сен янв - сен янв |
|||
мар май июл ноя мар май июл ноя мар май июл ноя мар май июл ноя мар май июл ноя мар |
||||
|
|
Добыча нефти |
|
Темп роста, % г-к-г |
|
|
|
||
Источники: ИнфоТЭК, Reuters, Энергетический Центр EY (Центральная, Восточная, Юго-Восточная Европа и Центральная Азия)
Динамика среднесуточной добычи газа (млрд куб. м/сутки)
2.5 |
30% |
2.2 |
20% |
1.9 |
10% |
1.6 |
0% |
1.3 |
-10% |
1.0 |
-20% |
14 14 14 14 14 14 15 15 15 15 15 15 16 16 16 16 16 16 17 17 17 17 17 17 18 18 18 18 18 18 19 19 |
||||||||||||
- - - - |
- - - - |
- - - - |
- - - - |
- - - - |
- |
|||||||
мар майиюл ноя |
мар майиюл ноя |
мар майиюл ноя |
мар майиюл ноя |
мар майиюл ноя |
мар |
|||||||
янв- |
сен янв- |
сен янв- |
сен янв- |
сен янв- |
сен янв- |
|||||||
|
|
|
|
Добыча газа |
|
|
|
Темп роста, г-к-г |
|
|||
|
|
|
|
|
|
|
|
|||||
Источники: ИнфоТЭК, Reuters, Энергетический Центр EY (Центральная, Восточная, Юго-Восточная Европа и Центральная Азия)
10 Ежеквартальный обзор рынка нефти и газа России и Казахстана

vk.com/id446425943
Апрель 2019 г.
6.2Нефтепереработка
•В начале 2019 г. в уровне доходности российских НПЗ произошли значительные изменения, которые были обусловлены рядом внешних и внутренних факторов. Так, в 1 кв. 2019 г. продолжилось существенное сокращение спредов по нефтепродуктам на европейском рынке: в частности, по автомобильному бензину на ~40% кв-к-кв, по дизельному топливу и авиационному керосину на ~20% кв-к-кв. Помимо ухудшения внешней конъюнктуры дополнительное негативное влияние оказало снижение доходности поставок топлива на внутренний рынок: «дисконт» по автомобильному бензину превысил отметку в 10 тыс. руб./тонна, по дизельному топливу – 3 тыс. руб./тонна (следствие избытка предложения внутри страны). В результате, по итогам 1 кв. 2019 г. «чистая» индикативная
маржа переработки НПЗ в европейской части России, по нашим оценкам, находилась вблизи нулевых отметок.
•По оперативным данным, в 1 кв. 2019 г. объем суточной переработки в России находился на уровне 5,73 млн барр. (-0,5% кв-к-кв, +0,4% г-к-г). Небольшое улучшение операционной динамики в сравнении г-к-г (по данным за январьфевраль) обусловлено увеличением производства на заводах ВИНК (+2% г-к-г), переработчиками газового конденсата (+10% г-к-г) и мини НПЗ (+24% г-к-г). Объем переработки средними независимыми заводами снизился на ~3% г-к-г.
•В начале 2019 г. (январь-февраль) российские НПЗ продолжили сокращать выпуск мазута: его доля в общей структуре снизилась с 29% в 2014 г. до 17% (для сравнения, 28% - в 2015 г., 23% -
в 2016 г., 21% - в 2017 г., 18% - в 2018 г.).
Сохранился тренд и по росту производства «прочих» нефтепродуктов: 36% в структуре в 2019 г. против 22% в 2014 г. При этом доля моторных топлив (автобензин, дизельное топливо и авиакеросин) в нефтепродуктовой корзине НПЗ за последние 5 лет изменилась незначительно: с 45% в
2014 г. до 46% в 2019 г.
•На фоне снижения добычи ЖУВ в рамках выполнения соглашения «ОПЕК+» (-1% кв- к-кв) экспорт нефти из России уменьшился на 2% кв-к-кв и составил 5,33 млн барр./сутки. Снижение экспортных объемов произошло, главным образом, в связи с сокращением поставок на рынки дальнего зарубежья.
Динамика объемов переработки и экспорта (млн барр./сутки)
6.0
5.6
5.2
4.8
4.4
4.0
1 кв. 2013 2 кв. 2013 3 кв. 2013 4 кв. 2013 1 кв. 2014 2 кв. 2014 3 кв. 2014 4 кв. 2014 1 кв. 2015 2 кв. 2015 3 кв. 2015 4 кв. 2015 1 кв. 2016 |
2 кв. 2016 3 кв. 2016 4 кв. 2016 1 кв. 2017 2 кв. 2017 3 кв. 2017 4 кв. 2017 1 кв. 2018 2 кв. 2018 3 кв. 2018 4 кв. 2018 1 кв. 2019 |
||||
|
|
Объем переработки |
|
|
Экспорт нефти |
|
|
|
|||
|
|
|
|||
Источники: ИнфоТЭК, Reuters
Динамика мировых цен на нефтепродукты ($/тонна)
1200 |
900 |
600 |
300 |
0 |
14 14 14 14 14 14 15 15 15 15 15 15 16 |
16 16 16 16 17 17 17 17 17 17 18 18 18 18 18 |
19 |
|||||||||||||||||
- - - |
|
|
- |
- 16- |
- |
- |
- |
|
|
- |
- - 18- |
19- |
|||||||
мар майиюл |
ноя |
|
мар майиюл |
ноя |
мар майиюл |
ноя |
мар майиюл |
ноя |
мар майиюл |
ноя |
мар |
||||||||
янв- |
сен- |
янв- - |
|
сен- |
янв- |
|
|
сенянв- |
|
- сен- |
|
янв- |
сен- |
янв- |
|||||
|
|
|
|
Мазут |
|
|
|
|
Бензин 95 |
|
|
|
|
ДТ |
|
|
|||
|
|
|
|
|
|
|
|
|
|
|
|
|
|
||||||
Источник: Reuters
Структура выхода нефтепродуктов в России (январь-февраль 2019 г. vs. январь-февраль
2014 г.)
14%
36%
28%
4%
1% 17%
14%
22%
4%
3%
28%
29%

 Бензин
 ДТ
ДТ 
 Мазут
Мазут 
 Авиакеросин
 Нафта
Нафта 
 Прочее
Источник: ИнфоТЭК
11 Ежеквартальный обзор рынка нефти и газа России и Казахстана

vk.com/id446425943 |
|
|
|
|
|
|
||
|
Апрель 2019 г. |
|
|
|
|
|
|
|
6.3 |
Нефтесервисные услуги |
|
|
|
|
|
|
|
|
• На фоне роста нефтяных котировок |
Количество буровых установок в мире (штук) |
||||||
|
|
|
|
|
|
|
||
|
|
буровая активность к февралю достигла |
4000 |
|
|
|
|
|
|
|
максимальных значений за последние |
3000 |
|
|
|
|
|
|
|
4 года: количество действующих буровых |
2000 |
|
|
|
|
|
|
|
установок составило 2306 штук. Однако в |
|
|
|
|
|
|
|
|
|
|
|
|
|
|
|
|
|
последствие произошло небольшое |
1000 |
|
|
|
|
|
|
|
сокращение количества вовлеченных |
0 |
|
|
|
|
|
|
|
установок на 1% ниже уровня конца 2018 г. |
янв-14 мар-14 май-14 июл-14 сен-14 ноя-14 янв-15 мар-15 май-15 июл-15 сен-15 ноя-15 янв-16 мар-16 май-16 июл-16 сен-16 ноя-16 янв-17 мар-17 май-17 июл-17 сен-17 ноя-17 янв-18 мар-18 май-18 июл-18 сен-18 ноя-18 янв-19 мар-19 |
|||||
|
|
|
|
|
|
|
|
|
|
• |
Количество действующих буровых |
Источники: Bloomberg, Baker Hughes, Нефтегазовая |
|||||
|
|
установок в США с конца 2018 г. снизилось |
вертикаль |
|
|
|
|
|
|
|
на 7% до минимального за последние |
Динамика количества буровых установок в |
|||||
|
|
11 месяцев уровня - 1006 штук в конце |
||||||
|
|
США на конец месяца (штук) |
|
|
||||
|
|
марта 2019 г., что связано с реализацией |
|
|
||||
|
|
2500 |
|
|
|
|
|
|
|
|
независимыми производителями своих |
|
|
|
|
|
|
|
|
2000 |
|
|
|
|
|
|
|
|
планов по сокращению расходов |
|
|
|
|
|
|
|
|
1500 |
|
|
|
|
|
|
|
|
|
|
|
|
|
|
|
|
|
(минимальное значение – 400 штук в мае |
1000 |
|
|
|
|
|
|
|
2016 г., максимальное – 1931 штук в |
500 |
|
|
|
|
|
|
|
сентябре 2014 г.). Сохраняющиеся |
0 |
|
|
|
|
|
|
|
инфраструктурные ограничения в |
янв-14 мар-14 май-14 июл-14 сен-14 ноя-14 янв-15 мар-15 май-15 июл-15 сен-15 ноя-15 янв-16 мар-16 май-16 июл-16 сен-16 ноя-16 янв-17 мар-17 май-17 июл-17 сен-17 ноя-17 янв-18 мар-18 май-18 июл-18 сен-18 ноя-18 янв-19 мар-19 |
|||||
|
|
отношение транспортировки сырья, |
||||||
|
|
добываемого в регионе Permian, |
Наклонно-направленные |
Вертикальные |
Горизонтальные |
|||
|
|
продолжают влиять на статистику по |
Источник: Baker Hughes |
|
|
|
|
|
|
|
количеству пробуренных, но |
|
|
|
|
||
|
|
|
|
|
|
|
|
|
|
|
незаконченных скважин (DUC¹) (+67% г-к-г |
Проходка в эксплуатационном и разведочном |
|||||
|
|
по Permian до 4,0 тыс. штук и +25% г-к-г по |
бурении в России (тыс. м) |
|
|
|||
|
|
США до 8,6 тыс. штук в феврале 2019 г.) |
30000 |
|
|
|
|
1500 |
|
• Показатели разведочного бурения в России |
20000 |
|
|
|
|
1000 |
|
|
|
за 2018 г. вновь обновили исторические |
|
|
|
|
|
|
|
|
максимумы: проходка достигла 1,1 млн м, |
10000 |
|
|
|
|
500 |
|
|
|
|
|
|
|
|
|
|
|
что на 8% выше уровня 2017 г. Проходка в |
0 |
|
|
|
|
0 |
|
|
эксплуатационном бурении в 2018 г. |
|
|
|
|
||
|
|
2014 |
2015 |
2016 |
2017 |
|
2018 |
|
|
|
сохранилась на уровне 2017 г. |
|
Эксплуатационное бурение |
|
|
||
|
|
|
|
|
|
|||
|
|
(27,6 млн м), что во многом обусловлено |
|
Разведочное бурение (правая ось) |
||||
|
|
Источники: Нефтегазовая вертикаль, отчетность |
||||||
|
|
фокусом компаний на повышение |
||||||
|
|
«Славнефть-Мегионнефтегаз» |
|
|
|
|||
|
|
технологичности операций |
|
|
|
|||
|
|
CAPEX сегмента разведка и добыча на |
||||||
|
|
(в т.ч. горизонтальное бурение) |
||||||
|
|
территории России ($ млн) ³ |
|
|
||||
|
• В 4 кв. 2018 г. совокупные инвестиции |
|
|
|||||
|
5000 |
|
|
|
|
|
||
|
|
ключевых российских ВИНК4 в |
|
|
|
|
|
|
|
|
|
|
|
|
|
|
|
|
|
отечественном сегменте разведки и добычи |
4000 |
|
|
|
|
|
|
|
увеличились в национальной валюте на 9% |
3000 |
|
|
|
|
|
|
|
кв-к-кв, по сравнению с аналогичным |
2000 |
|
|
|
|
|
|
|
периодом 2017 г. снижение составило 9%. |
|
|
|
|
|
|
|
|
|
|
|
|
|
|
|
|
|
Наибольший объем капитальных вложений |
1000 |
|
|
|
|
|
|
|
|
|
|
|
|
|
|
|
|
был обеспечен компанией Роснефть |
0 |
|
|
|
|
|
|
|
(219 млрд руб.), а также ЛУКОЙЛом |
Роснефть ² |
ЛУКОЙЛ (РФ) |
Газпром нефть |
Татнефть |
||
|
|
|
|
|
|
|
|
|
|
|
(75 млрд руб.) и Газпром нефтью (73 млрд |
3 кв. 2014 |
4 кв. 2014 |
1 кв. 2015 |
2 кв. 2015 |
||
|
|
3 кв. 2015 |
4 кв. 2015 |
1 кв. 2016 |
2 кв. 2016 |
|||
|
|
руб.). При этом, Газпром нефть |
||||||
|
|
3 кв. 2016 |
4 кв. 2016 |
1 кв. 2017 |
2 кв. 2017 |
|||
|
|
единственная из перечисленных компаний |
3 кв. 2017 |
4 кв. 2017 |
1 кв. 2018 |
2 кв. 2018 |
||
|
|
увеличила вложения в сравнении г-к-г |
3 кв. 2018 |
4 кв. 2018 |
|
|
|
|
|
|
|
|
|
|
|||
|
|
(+2%), в то время как Роснефть и ЛУКОЙЛ |
Источники: отчетность компаний, Энергетический Центр |
|||||
|
|
сократили на 12% и 10%, соответственно. |
EY (Центральная, Восточная, Юго-Восточная Европа и |
|||||
|
|
|
Центральная Азия) |
|
|
|
|
|
|
|
|
1 Drilled but uncompleted wells |
|
|
|
|
|
|
|
|
2 активы Башнефти в сегменте разведка и добыча включены |
|
||||
|
|
|
3 компании, отражающие затраты на сегмент в своей отчетности |
|||||
|
|
|
4 Роснефть (вкл. Башнефть), ЛУКОЙЛ, Газпром нефть, Татнефть |
|||||
12 Ежеквартальный обзор рынка нефти и газа России и Казахстана
vk.com/id446425943
Апрель 2019 г.
7.Итоги работы нефтегазовых компаний России, Казахстана и мира (4 кв. 2018 г.)
7.1Россия
7.1.1Нефтяные компании
Компания Период
Роснефть |
4 кв. 18 |
3 кв. 18
2018
2017
|
|
|
|
|
|
|
|
|
|
|
|
|
|
|
|
|
|
|
|
|
|
Динамика ключевых финансовых показателей |
|||||||||||||
|
|
|
|
|
|
|
|
|
|
|
|
|
|
|
|
|
|
|
|
|
|
|
|
|
|
|
|
|
|
|
|
|
|
|
|
|
|
|
|
|
Абсолютные показатели (млрд долл. США) |
|
|
|
|
|
|
Удельные показатели (долл. США) |
|
|
|
|
|||||||||||||||||||
|
|
|
|
|
|
|
|
|
|
|
|
|
|
|
|
|
|
|
|
|
|
|
|
|
|
|
|
|
|
|
|
|
|
|
|
|
Изменение |
цены Urals |
кв-к-кв |
Выручка |
кв-к-кв (для |
годового |
периода г-к-г) |
|
EBITDA |
|
кв-к-кв (для |
годового |
периода г-к-г) |
Чистая |
прибыль |
кв-к-кв (для |
годового |
периода г-к-г) |
|
EBITDA/барр. |
кв-к-кв (для |
годового |
периода г-к-г) |
OPEX/б.н.э. |
кв-к-кв (для |
годового |
периода г-к-г) |
CAPEX |
(разведка и |
добыча)/барр |
|
кв-к-кв (для |
годового |
периода г-к-г) |
|
|
|
|
|
|
|
|
|
|
|
|
|
|
|
|
|
|
|
|
|
|
|
|
|
|
|
|
|
|
|
|
|
|
|
|
|
|
-9,3% |
|
33,1 |
-7,5% |
7,4 |
-24,5% |
1,6 |
-30% |
|
|
17,1 |
-27% |
|
3,1 |
6% |
|
8,0 |
|
2% |
|
|||||||||||||||
2% |
35,8 |
6% |
9,8 |
8% |
2,3 |
-36% |
23,2 |
2% |
2,9 |
-7% |
7,8 |
-12% |
31% |
133,7 |
26% |
33,1 |
38% |
8,9 |
>100% |
20,0 |
35% |
3,1 |
-4% |
8,5 |
-4% |
26% |
106,4 |
38% |
|
24,0 |
|
24% |
3,8 |
41% |
14,8 |
11% |
3,2 |
28% |
8,8 |
|
40% |
|
|
|
|
|
|
|
|
|
|
|
|
|
|
|
|
Результаты отчетного периода (4 кв. 2018 г.)
Комментарии к результатам отчетного периода
•Выручка компании в 4 кв. 2018 г. сократилась на 7,5% до $33,1 млрд: снижение нефтяных
котировок (-9,3% кв-к-кв) и европейских цен на нефтепродукты (особенно на прямогонный
бензин), а также уменьшение объемов экспорта дизтоплива были лишь частично
компенсированы ростом продаж нефти на зарубежных рынках.
•Ухудшение рыночной конъюнктуры вкупе с негативным эффектом от «ножниц Кудрина» (отставание изменения ставок экспортных пошлин от динамики цен на нефть) привело к
тому, что чистый доход добывающего сегмента внутри РФ, по нашим оценкам, снизился на $4,3/барр. до $18/барр. (минимальное значение за последние 5 кварталов). При этом рост
валовой маржи переработки для среднероссийского НПЗ (следствие изменения спредов по нефтепродуктовой корзине) был нивелирован динамикой операционных и
административных затрат заводов, а также увеличением тарифов естественных монополий и затрат на технологический транспорт. В результате показатель EBITDA в расчете на
баррель добычи нефти сократился с $23,2/барр. до $17,1/барр. Маржа по EBITDA
уменьшилась с 27,4% до 22,4%.
•Снижение величины EBITDA на $2,4 млрд стало основным драйвером сокращения
операционного денежного потока компании (с $7,8 до $5,7 млрд), при этом отметим
продолжающееся уменьшение оборотного капитала. Скорректированный на величину предоплат по долгосрочным договорам поставки нефти операционный денежный поток
снизился с $11,3 до $7,9 млрд.
•Капитальные вложения в 4 кв. 2018 г. выросли на $400 млн, из них примерно 43% было дополнительно направлено в сегмент «Разведка и добыча», 43% ― в «Переработку, коммерцию и логистику», остальное ― в прочие виды деятельности. Всего по итогам 2018 г. компания инвестировала $15 млрд, удельные вложения в сегмент «Разведка и добыча»
оставались ниже уровня $7/б.н.э.
•Сокращение скорректированного операционного денежного потока и увеличение капитальных вложений привели к снижению свободного денежного потока компании на $3,8 млрд (до $4 млрд). Всего по итогам 2018 г. величина свободного денежного потока
достигла $17,9 млрд, что позволило компании погасить полученные предоплаты на сумму $7 млрд.
13 Ежеквартальный обзор рынка нефти и газа России и Казахстана

vk.com/id446425943
Апрель 2019 г.
7.1.1 Нефтяные компании (продолжение)
|
|
|
|
|
|
|
|
|
|
|
|
|
|
|
|
|
|
|
|
|
|
|
|
|
|
|
|
|
|
|
|
|
|
|
Динамика ключевых финансовых показателей |
|
|
||||||||||||||||||||
|
|
|
|
|
|
|
|
|
|
Абсолютные показатели (млрд долл. США) |
|
|
|
|
|
|
|
|
Удельные показатели (долл. США) |
|
|
|
|
|
|
Результаты отчетного периода (4 кв. 2018 г.) |
|
||||||||||||||||||||||||||||||
|
|
|
|
|
|
|
|
|
|
|
|
|
|
|
|
|
|
|
|
|
|
|
|
|
|||||||||||||||||||||||||||||||||
|
|
|
|
|
|
|
|
|
|
|
|
|
|
|
|
|
|
|
|
|
|
|
|
|
|
|
|
|
|
|
|
|
|
|
|
|
|
|
|
|
|
|
|
|
|
|
|
|
|
|
|
|
|
|
|
|
|
Компания |
|
Период |
|
|
|
Изменение |
Uralsценыкв- |
кв-к |
Выручка |
|
кв-к-кв(для |
годового |
периодаг-к-г) |
|
|
EBITDA |
|
|
|
кв-к-кв(для |
годового |
периодаг-к-г) |
|
Чистая |
прибыль |
|
кв-к-кв(для |
годового |
периодаг-к-г) |
|
EBITDA/барр. |
|
|
|
кв-к-кв(для |
годового |
периодаг-к-г) |
|
б/OPEX.н.э. |
|
|
кв-к-кв(для |
годового |
периодаг-к-г) |
|
CAPEX |
разведка( и |
добыча)/барр. |
|
|
кв-к-кв(для |
годового |
периодаг-к-г) |
|
Комментарии к результатам отчетного периода |
|
|
|
|
|
|
|
|
|
|
|
|
|
|
|
|
|
|
|
|
|
|
|
|
|
|
|
|
|
|
|
|
|
|
|
|
|
|
|
|
|
|
|
|
|
|
|
|
|
|
|
|
|
|
|
|
|
|
|
|
ЛУКОЙЛ |
|
4 кв. 18 |
-9,3% |
30,7 |
-12% |
4,2 |
|
-12% |
|
2,4 |
|
-10% |
25,0 |
|
-12% |
3,6 |
|
2% |
|
|
7,1 |
|
3% |
|
|
• Выручка компании в 4 кв. 2018 г. сократилась на 12% кв-к-кв до ~$31 млрд в результате |
|||||||||||||||||||||||||||||||
|
|
|
|
|
|
|
|
|
|
|
|
|
|
|
|
|
|
|
|
|
|
|
|
|
|
|
|
|
|
|
|
|
|
|
|
|
|
|
|
|
|
|
|
|
|
|
|
|
|
|
|
|
|
|
|
ухудшения внешних условий (снижение стоимости Urals на 9,3% кв-к-кв и экспортных цен |
|
|
|
|
|
|
|
|
|
|
|
|
|
|
|
|
|
|
|
|
|
|
|
|
|
|
|
|
|
|
|
|
|
|
|
|
|
|
|
|
|
|
|
|
|
|
|
|
|
|
|
|
|
|
|
|
|
на нафту), а также сокращения объемов реализации нефти и нефтепродуктов |
|
|
|
|
|
|
|
|
|
|
|
|
|
|
|
|
|
|
|
|
|
|
|
|
|
|
|
|
|
|
|
|
|
|
|
|
|
|
|
|
|
|
|
|
|
|
|
|
|
|
|
|
|
|
|
|
|
(на 2,6 млн тонн и 1,3 млн тонн, соответственно) как на внутреннем рынке, так и за |
|
|
|
|
|
|
|
|
|
|
|
|
|
|
|
|
|
|
|
|
|
|
|
|
|
|
|
|
|
|
|
|
|
|
|
|
|
|
|
|
|
|
|
|
|
|
|
|
|
|
|
|
|
|
|
|
|
рубежом. |
|
|
|
3 кв. 18 |
2% |
|
35,0 |
5% |
|
4,8 |
|
0% |
|
2,7 |
|
-1% |
|
28,5 |
|
-2% |
|
3,6 |
|
-8% |
|
|
6,9 |
|
-11% |
|
• Значение показателя EBITDA на 1 барр. добычи ЖУВ сократилось на $3,5 кв-к-кв (до |
||||||||||||||||||||||||||||
|
|
|
|
|
|
|
|
|
|
|
|
|
|
|
|
|
|
|
|
|
|
|
|
|
|
|
|
|
|
|
|
|
|
|
|
|
|
|
|
|
|
|
|
|
|
|
|
|
|
|
|
|
|
|
|
$25,0/барр.): снижение очищенного среднеотраслевого дохода в сегменте «разведка и |
|
|
|
|
|
|
|
|
|
|
|
|
|
|
|
|
|
|
|
|
|
|
|
|
|
|
|
|
|
|
|
|
|
|
|
|
|
|
|
|
|
|
|
|
|
|
|
|
|
|
|
|
|
|
|
|
|
добыча» на $4,3/барр. (вследствие ухудшения рыночной конъюнктуры и негативного |
|
|
|
|
|
|
|
|
|
|
|
|
|
|
|
|
|
|
|
|
|
|
|
|
|
|
|
|
|
|
|
|
|
|
|
|
|
|
|
|
|
|
|
|
|
|
|
|
|
|
|
|
|
|
|
|
|
эффекта от «ножниц Кудрина») было частично нивелировано повышением |
|
|
|
|
|
|
|
|
|
|
|
|
|
|
|
|
|
|
|
|
|
|
|
|
|
|
|
|
|
|
|
|
|
|
|
|
|
|
|
|
|
|
|
|
|
|
|
|
|
|
|
|
|
|
|
|
|
маржинальности переработки из-за изменения нефтепродуктовых спредов, а также |
|
|
|
|
|
|
|
|
|
|
|
|
|
|
|
|
|
|
|
|
|
|
|
|
|
|
|
|
|
|
|
|
эффективным управлением операционными и административными затратами. Маржа по |
||||||||||||||||||||||||||
|
|
2018 |
|
|
|
31% |
|
127,7 |
|
26% |
|
|
|
17,6 |
|
|
|
23% |
|
|
10,0 |
|
34% |
|
|
26,7 |
|
|
|
23% |
|
|
3,8 |
|
|
-9% |
|
|
|
7,8 |
|
|
|
-11% |
|
||||||||||||
|
|
|
|
|
|
|
|
|
|
|
|
|
|
|
|
|
|
|
|
|
|
|
|
|
|
|
|
|
|
|
|
|
|
|
|
|
|
|
|
|
|
|
|
|
|
|
|
|
|
|
|
|
|
|
|
EBITDA сохранилась на уровне 13,6%. |
|
|
|
|
|
|
|
|
|
|
|
|
|
|
|
|
|
|
|
|
|
|
|
|
|
|
|
|
|
|
|
|
|
|
|
|
|
|
|
|
|
|
|
|
|
|
|
|
|
|
|
|
|
|
|
|
|
• Несмотря на снижение EBITDA, операционный ДП вырос на 18% кв-к-кв за счет |
|
|
|
|
|
|
|
|
|
|
|
|
|
|
|
|
|
|
|
|
|
|
|
|
|
|
|
|
|
|
|
|
|
|
|
|
|
|
|
|
|
|
|
|
|
|
|
|
|
|
|
|
|
|
|
|
|
уменьшения оборотного капитала, что на фоне стабильного CAPEX привело к росту FCF на |
|
|
|
|
|
|
|
|
|
|
|
|
|
|
|
|
|
|
|
|
|
|
|
|
|
|
|
|
|
|
|
|
|
|
|
|
|
|
|
|
|
|
|
|
|
|
|
|
|
|
|
|
|
|
|
|
|
31% кв-к-кв до $3,2 млрд (максимальный уровень с 3 кв. 2010 г.). |
|
|
|
|
|
|
|
|
|
|
|
|
|
|
|
|
|
|
|
|
|
|
|
|
|
|
|
|
|
|
|
||||||||||||||||||||||||||||
|
|
2017 |
|
|
|
26% |
|
101,7 |
|
29% |
|
|
|
14,2 |
|
|
|
30% |
|
|
7,2 |
|
131% |
|
21,6 |
|
|
|
36% |
|
|
4,2 |
|
|
19% |
|
|
|
8,7 |
|
|
|
24% |
|
|
• Положительное значение FCF позволило компании сократить чистый долг почти в 5 раз |
|||||||||||
|
|
|
|
|
|
|
|
|
|
|
|
|
|
|
|
|
|
|
|
|
|
|
|
|
|
|
|
|
|
|
|
|
|
|
|
|
|
|
|
|
|
|
|
|
|
|
|
|
|
|
|
|
|
|
|
||
|
|
|
|
|
|
|
|
|
|
|
|
|
|
|
|
|
|
|
|
|
|
|
|
|
|
|
|
|
|
|
|
|
|
|
|
|
|
|
|
|
|
|
|
|
|
|
|
|
|
|
|
|
|
|
|
кв-к-кв (и в 8 раз по сравнению с концом 2017 г.) до минимального исторического уровня - |
|
|
|
|
|
|
|
|
|
|
|
|
|
|
|
|
|
|
|
|
|
|
|
|
|
|
|
|
|
|
|
|
|
|
|
|
|
|
|
|
|
|
|
|
|
|
|
|
|
|
|
|
|
|
|
|
|
$0,6 млрд. на конец 2018 г. В результате, показатель чистый долг/EBITDA снизился до |
|
|
|
|
|
|
|
|
|
|
|
|
|
|
|
|
|
|
|
|
|
|
|
|
|
|
|
|
|
|
|
|
|
|
|
|
|
|
|
|
|
|
|
|
|
|
|
|
|
|
|
|
|
|
|
|
|
отметки 0,03х. |
|
|
|
|
|
|
|
|
|
|
|
|
|
|
|
|
|
|
|
|
|
|
|
|
|
|
|
|
|
|
|
|
|
|
|
|
|||||||||||||||||||||||
Газпром |
|
4 кв. 18 |
-9,3% |
10,3 |
-5% |
|
2,8 |
|
-26% |
|
1,2 |
|
-42% |
23,5 |
|
-24% |
3,7 |
|
21% |
|
|
9,2 |
|
22% |
|
|
• Валовая выручка компании в 4 кв. 2018 г. упала на 5% кв-к-кв (до $10,3 млрд): эффект от |
||||||||||||||||||||||||||||||
нефть |
|
|
|
|
|
|
|
|
|
|
|
|
|
|
|
|
|
|
|
|
|
|
|
|
|
|
|
|
|
|
|
|
|
|
|
|
|
|
|
|
|
|
|
|
|
|
|
|
|
|
|
|
|
|
|
снижения нефтяных котировок (-9,3% кв-к-кв) и экспортных цен на нефтепродукты |
|
|
|
|
|
|
|
|
|
|
|
|
|
|
|
|
|
|
|
|
|
|
|
|
|
|
|
|
|
|
|
|
|
|
|
|
|
|
|
|
|
|
|
|
|
|
|
|
|
|
|
|
|
|
|
|
|
(примерно на 14%) был частично нивелирован ростом объемов реализации сырья |
|
|
|
|
|
|
|
|
|
|
|
|
|
|
|
|
|
|
|
|
|
|
|
|
|
|
|
|
|
|
|
|
|
|
|
|
|
|
|
|
|
|
|
|
|
|
|
|
|
|
|
|
|
|
|
|
|
(+0,13 млн тонн кв-к-кв) и перераспределением направлений поставок по нафте и мазуту. |
|
|
|
3 кв. 18 |
2% |
|
10,9 |
5% |
|
3,8 |
|
9% |
|
2,0 |
|
29% |
|
30,8 |
|
4% |
|
3,1 |
|
-11% |
|
7,6 |
|
3% |
|
|
• Удельный показатель сократился на $7,3/барр. кв-к-кв (до $23,5/барр.) за счет снижения |
||||||||||||||||||||||||||||
|
|
|
|
|
|
|
|
|
|
|
|
|
|
|
очищенного среднеотраслевого дохода в сегменте «разведка и добыча» (-$4,3/барр. |
||||||||||||||||||||||||||||||||||||||||||
|
|
|
|
|
|
|
|
|
|
|
|
|
|
|
|
|
|
|
|
|
|
|
|
|
|
|
|
|
|
|
|
|
|
|
|
|
|
|
|
|
|
|
|
|
|
|
|
|
|
|
|
|
|
|
|
||
|
|
|
|
|
|
|
|
|
|
|
|
|
|
|
|
|
|
|
|
|
|
|
|
|
|
|
|
|
|
|
|
|
|
|
|
|
|
|
|
|
|
|
|
|
|
|
|
|
|
|
|
|
|
|
|
вследствие влияния «ножниц Кудрина») в совокупности с ростом затрат на приобретение |
|
|
|
|
|
|
|
|
|
|
|
|
|
|
|
|
|
|
|
|
|
|
|
|
|
|
|
|
|
|
|
|
|
|
|
|
|
|
|
|
|
|
|
|
|
|
|
|
|
|
|
|
|
|
|
|
|
УВ (+$2,6/барр.) и операционных издержек на добычу (+$0,6/барр.). |
|
|
|
|
|
|
|
|
|
|
|
|
|
|
|
|
|
|
|
|
|
|
|
|
|
|
|
|
|
|
|
|
|
|
|
|
|
|
|
|
|
|
|
|
|
|
|
|
|
|
|
|
|
|
|
|
|
• Снижение показателя EBITDA, несмотря на положительные изменения в оборотном |
|
|
|
2018 |
|
|
|
31% |
|
41,0 |
|
20% |
|
|
|
12,7 |
|
|
|
35% |
|
|
6,0 |
|
38% |
|
|
27,1 |
|
|
|
33% |
|
|
3,44 |
|
|
-11% |
|
|
7,7 |
|
|
|
-20% |
|
|
капитале (за счет дебиторской задолженности и запасов), привело к тому, что денежный |
|||||||||||
|
|
|
|
|
|
|
|
|
|
|
|
|
|
|
|
|
|
|
|
|
|
|
|
|
|
|
|
|
|
|
|
|
|
|
|
|
|
|
|
|
|
|
|
|
|
|
|
|
|
|
|
|
|
|
|
||
|
|
|
|
|
|
|
|
|
|
|
|
|
|
|
|
|
|
|
|
|
|
|
|
|
|
|
|
|
|
|
|
|
|
|
|
|
|
|
|
|
|
|
|
|
|
|
|
|
|
|
|
|
|
|
|
поток компании от операционной деятельности сократился на 21% кв-к-кв. |
|
|
|
|
|
|
|
|
|
|
|
|
|
|
|
|
|
|
|
|
|
|
|
|
|
|
|
|
|
|
|
|
|
|
|
|
|
|
|
|
|
|
|
|
|
|
|
|
|
|
|
|
|
|
|
|
|
• В результате, на фоне роста совокупных капитальных вложений по компании на 24% |
|
|
|
|
|
|
|
|
|
|
|
|
|
|
|
|
|
|
|
|
|
|
|
|
|
|
|
|
|
|
|
|
|
|
|
|
|
|
|
|
|
|
|
|
|
|
|
|
|
|
|
|
|
|
|
|
|
кв-к-кв (за счет добывающего и перерабатывающего сегментов), величина свободного |
|
|
|
2017 |
|
|
|
26% |
|
34,3 |
|
34% |
|
|
|
9,4 |
|
|
|
39% |
|
|
4,3 |
|
44% |
|
|
20,3 |
|
|
|
33% |
|
|
3,9 |
|
|
14% |
|
|
|
9,6 |
|
|
|
17% |
|
|
денежного потока сократилась более чем в три раза до $0,4 млрд. Чистый долг компании |
||||||||||
|
|
|
|
|
|
|
|
|
|
|
|
|
|
|
|
|
|
|
|
|
|
|
|
|
|
|
|
|
|
|
|
|
|
|
|
|
|
|
|
|
|
|
|
|
|
|
|
|
|
|
|
|
|
|
|
снизился до $7,6 млрд, соотношение чистый долг/EBITDA составил 0,8х1. |
|
|
|
|
|
|
|
|
|
|
|
|
|
|
|
|
|
|
|
|
|
|
|
|
|
|
|
|
|
|
|
|
|
|
|
|
|
|
|
|
|
|
|
|
|
|
|
|
|
|
|
|
|
|
|
|
|
|
|
1 Показатель чистый долг/EBITDA рассчитан как отношение чистого долга на конец анализируемого периода к суммарной величине EBITDA за четыре последних квартала.
14 Ежеквартальный обзор рынка нефти и газа России и Казахстана

vk.com/id446425943
Апрель 2019 г.
7.1.1 Нефтяные компании (продолжение)
|
|
|
|
|
|
|
|
|
|
|
|
|
|
|
|
|
|
|
|
|
|
|
|
|
|
|
|
|
|
|
|
|
|
|
|
Динамика ключевых финансовых показателей |
|
|
||||||||||||||||||||||
|
|
|
|
|
|
|
|
|
|
|
Абсолютные показатели (млрд долл. США) |
|
|
|
|
|
|
|
|
Удельные показатели (долл. США) |
|
|
|
|
|
|
|
Результаты отчетного периода (4 кв. 2018 г.) |
|
|||||||||||||||||||||||||||||||
|
|
|
|
|
|
|
|
|
|
|
|
|
|
|
|
|
|
|
|
|
|
|
|
|
|
|
||||||||||||||||||||||||||||||||||
|
|
|
|
|
|
|
|
|
|
|
|
|
|
|
|
|
|
|
|
|
|
|
|
|
|
|
|
|
|
|
|
|
|
|
|
|
|
|
|
|
|
|
|
|
|
|
|
|
|
|
|
|
|
|
|
|
|
|
|
|
|
Компания |
|
Период |
|
|
|
Изменение |
Uralsценыкв- |
кв-к |
Выручка |
|
кв-к-кв(для |
годового |
периодаг-к-г) |
|
|
EBITDA |
|
|
|
кв-к-кв(для |
годового |
периодаг-к-г) |
|
Чистая |
прибыль |
|
кв-к-кв(для |
годового |
периодаг-к-г) |
|
EBITDA/барр. |
|
|
|
кв-к-кв(для |
годового |
периодаг-к-г) |
|
б/OPEX.н.э. |
|
|
кв-к-кв(для |
годового |
периодаг-к-г) |
|
CAPEX |
разведка( и |
добыча)/барр. |
|
|
кв-к-кв(для |
годового |
периодаг-к-г) |
|
Комментарии к результатам отчетного периода |
|
|||
|
|
|
|
|
|
|
|
|
|
|
|
|
|
|
|
|
|
|
|
|
|
|
|
|
|
|
|
|
|
|
|
|
|
|
|
|
|
|
|
|
|
|
|
|
|
|
|
|
|
|
|
|
|
|
|
|
|
|
|
|
|
Сургут- |
|
4 кв. 18 |
-9,3% |
5,7 |
-14% |
1,3 |
|
-31% |
|
0,9 |
|
-43% |
11,4 |
|
-31% |
|
н.д. |
|
н.д. |
|
н.д. |
|
|
н.д. |
• Чистая выручка компании (без учета ЭП) в 4 кв. 2018 г. снизилась на 14% кв-к-кв |
||||||||||||||||||||||||||||||||||
|
нефтегаз1 |
|
|
|
|
|
|
|
|
|
|
|
|
|
|
|
|
|
|
|
|
|
|
|
|
|
|
|
|
|
|
|
|
|
|
|
|
|
|
|
|
|
|
|
|
|
|
|
|
|
|
|
|
|
|
|
|
|
(до $5,7 млрд), что полностью соответствует динамике экспортной цены Urals, очищенной |
|
|
|
|
|
|
|
|
|
|
|
|
|
|
|
|
|
|
|
|
|
|
|
|
|
|
|
|
|
|
|
|
|
|
|
|
|
|
|
|
|
|
|
|
|
|
|
|
|
|
|
|
|
|
|
|
|
|
|
|
от таможенных пошлин. |
|
|
|
|
|
|
|
|
|
|
|
|
|
|
|
|
|
|
|
|
|
|
|
|
|
|
|
|
|
|
|
|
|
|
|
|
|
|
|
|
|
|
|
|
|
|
|
|
|
|
|
|
|
|
|
|
|
|
|
|
• Удельный показатель операционной прибыли компании снизился на $5,1 до $11,4/барр. |
|
|
|
|
3 кв. 18 |
2% |
|
6,6 |
2% |
|
1,9 |
|
3% |
|
1,6 |
|
32% |
|
16,5 |
|
-1,4% |
|
н.д. |
|
н.д. |
|
н.д. |
|
|
н.д. |
на фоне сокращения очищенного среднеотраслевого дохода в добывающем сегмента на |
|||||||||||||||||||||||||||||||
|
|
|
|
|
|
|
|
|
|
|
|
|
|
|
|
|
|
|
|
|
|
|
|
|
|
|
|
|
|
|
|
|
|
|
|
|
|
|
|
|
|
|
|
|
|
|
|
|
|
|
|
|
|
|
|
|
|
|
$4,3/барр. |
|
|
|
|
|
|
|
|
|
|
|
|
|
|
|
|
|
|
|
|
|
|
|
|
|
|
|
|
|
|
|
|
|
|
|
|
|
|
|
|
|
|
|
|
|
|
|
|
|
|
|
|
|
|
|
|
|
|
|
|
• Положительное сальдо прочих доходов/расходов в размере $2,5 млрд (+36% к уровню |
|
|
|
|
|
|
|
|
|
|
|
|
|
|
|
|
|
|
|
|
|
|
|
|
|
|
|
|
|
|
|
|
|
|
|
|
|
|
|
|
|
|
|
|
|
|
|
|
|
|
|
|
|
|
|
|
|
|
|
|
конца 3 кв. 2018 г.) было обусловлено изменением курса национальной валюты (-6% на |
|
|
|
|
2018 |
|
|
|
31% |
|
24,3 |
|
24% |
|
|
|
6,3 |
|
|
|
57% |
|
|
5,1 |
|
2% |
|
|
14,0 |
|
|
|
56% |
|
|
н.д. |
|
|
н.д. |
|
|
н.д. |
|
|
|
н.д. |
|
|
дату переоценки финансовых вложений, номинированных в иностранной валюте). |
|||||||||||||
|
|
|
|
|
|
|
|
|
|
|
|
|
|
|
|
|
|
|
|
|
|
|
|
|
|
|
|
|
|
|
|
|
|
|
|
|
|
|
|
|
|
|
|
|
|
|
|
|
|
|
|
|
|
|
|
|
|
|
||
|
|
|
|
|
|
|
|
|
|
|
|
|
|
|
|
|
|
|
|
|
|
|
|
|
|
|
|
|
|
|
|
|
|
|
|
|
|
|
|
|
|
|
|
|
|
|
|
|
|
|
|
|
|
|
|
|
|
|
• Чистая прибыль компании сохранилась на уровне 3 кв. 2018 г. ($3,5 млрд) в связи с |
|
|
|
|
|
|
|
|
|
|
|
|
|
|
|
|
|
|
|
|
|
|
|
|
|
|
|
|
|
|
|
|
|
|
|
|
|
|
|
|
|
|
|
|
|
|
|
|
|
|
|
|
|
|
|
|
|
|
|
|
сокращением операционной прибыли (-31% кв-к-кв), несмотря на положительный эффект |
|
|
|
|
|
|
|
|
|
|
|
|
|
|
|
|
|
|
|
|
|
|
|
|
|
|
|
|
|
|
|
|
|
|
|
|
|
|
|
|
|
|
|
|
|
|
|
|
|
|
|
|
|
|
|
|
|
|
|
|
от курсовых разниц. С учетом корректировок на эффекты курсовых разниц падение чистой |
|
|
|
|
|
|
|
|
|
|
|
|
|
|
|
|
|
|
|
|
|
|
|
|
|
|
|
|
|
|
|
|
|
|
|
|
|
|
|
|
|
|
|
|
|
|
|
|
|
|
|
|
|
|
|
|
|
|
|
|
||
|
|
|
2017 |
|
|
|
26% |
|
19,6 |
|
32% |
|
|
|
4,0 |
|
|
|
13% |
|
|
5,0 |
|
-7% |
|
|
9,0 |
|
|
|
16% |
|
|
н.д. |
|
|
н.д. |
|
|
н.д. |
|
|
|
н.д. |
|
|
прибыли составило 43% кв-к-кв (до $0,9 млрд). |
|||||||||||||
|
|
|
|
|
|
|
|
|
|
|
|
|
|
|
|
|
|
|
|
|
|
|
|
|
|
|
|
|
|
|
|
|
|
|
|
|
|
|
|
|
|
|
|
|
|
|
|
|
|
|
|
|
|
|
|
|
|
|
||
|
|
|
|
|
|
|
|
|
|
|
|
|
|
|
|
|
|
|
|
|
|
|
|
|
|
|
|
|
|
|
|
|
|
|
|
|
|
|
|
|
|
|
|
|
|
|
|
|
|
|
|
|
|
|
|
|
|
|
• Объем денежных средств и ликвидных финансовых активов, увеличившийся на 3% кв-к-кв |
|
|
|
|
|
|
|
|
|
|
|
|
|
|
|
|
|
|
|
|
|
|
|
|
|
|
|
|
|
|
|
|
|
|
|
|
|
|
|
|
|
|
|
|
|
|
|
|
|
|
|
|
|
|
|
|
|
|
|
|
до $45,2 млрд на конец отчетного периода, вновь побил установленные ранее рекорды. |
|
|
Татнефть2 |
|
|
|
|
|
|
|
|
|
|
|
|
|
|
|
|
|
|
|
|
|
|
|
|
|
|
|
|
|
|
|
|
|
|
|
|
|||||||||||||||||||||||
|
|
4 кв. 18 |
-9,3% |
4,1 |
-5% |
|
0,9 |
|
-41% |
|
0,6 |
|
-46% |
15,4 |
|
-43% |
4,3 |
|
10% |
|
|
3,9 |
|
|
31% |
|
|
|
• В 4 кв. 2018 г. валовая выручка компании снизилась на 5% кв-к-кв (-$0,2 млрд кв-к-кв), |
|||||||||||||||||||||||||||||||
|
|
|
|
|
|
|
|
|
|
|
|
|
|
|
|
|
|
|
|
|
|
|
|
|
|
|
|
|
|
|
|
|
|
|
|
|
|
|
|
|
|
|
|
|
|
|
|
|
|
|
|
|
|
|
|
|
|
|
составив $4,1 млрд: падение котировок Urals (-9,3% кв-в-кв) и европейских цен на |
|
|
|
|
|
|
|
|
|
|
|
|
|
|
|
|
|
|
|
|
|
|
|
|
|
|
|
|
|
|
|
|
|
|
|
|
|
|
|
|
|
|
|
|
|
|
|
|
|
|
|
|
|
|
|
|
|
|
|
|
нефтепродукты, а также уменьшение объема реализации продуктов переработки (за счет |
|
|
|
|
|
|
|
|
|
|
|
|
|
|
|
|
|
|
|
|
|
|
|
|
|
|
|
|
|
|
|
|
|
|
|
|
|
|
|
|
|
|
|
|
|
|
|
|
|
|
|
|
|
|
|
|
|
|
|
|
экспортного направления) было частично нивелировано увеличением прочих доходов и |
|
|
|
|
|
|
|
|
|
|
|
|
|
|
|
|
|
|
|
|
|
|
|
|
|
|
|
|
|
|
|
|
|
|
|
|
|
|
|
|
|
|
|
|
|
|
|
|
|
|
|
|
|
|
|
|
|
|
|
|
выручки от нефтехимического бизнеса. |
|
|
|
|
|
|
|
|
|
|
|
|
|
|
|
|
|
|
|
|
|
|
|
|
|
|
|
|
|
|
|
|
|
|
|
|
|
|
|
|
|
|
|
|
|
|
|
|
|
|
|
|
|
|
|
|
|
|
|
|
• Показатель EBITDA компании в 4 кв. 2018 г. в расчете на баррель добычи уменьшился с |
|
|
|
|
3 кв. 18 |
2% |
|
4,3 |
3% |
|
1,4 |
|
8% |
|
1,1 |
|
3% |
|
26,9 |
|
3% |
|
3,9 |
|
-7% |
|
|
3,0 |
|
|
-15% |
|
|
$26,9 до $15,4. Опережающее снижение этой величины по сравнению с изменением |
||||||||||||||||||||||||||||
|
|
|
|
|
|
|
|
|
|
|
|
|
|
|
|
|
|
чистого дохода добывающего сегмента (-$4,3/барр. кв-к-кв по нашим оценкам) было |
||||||||||||||||||||||||||||||||||||||||||
|
|
|
|
|
|
|
|
|
|
|
|
|
|
|
|
|
|
|
|
|
|
|
|
|
|
|
|
|
|
|
|
|
|
|
|
|
|
|
|
|
|
|
|
|
|
|
|
|
|
|
|
|
|
|
|
|
|
|
||
|
|
|
|
|
|
|
|
|
|
|
|
|
|
|
|
|
|
|
|
|
|
|
|
|
|
|
|
|
|
|
|
|
|
|
|
|
|
|
|
|
|
|
|
|
|
|
|
|
|
|
|
|
|
|
|
|
|
|
вызвано ростом удельных издержек в операционных сегментах (+10% кв-к-кв в добыче и |
|
|
|
|
|
|
|
|
|
|
|
|
|
|
|
|
|
|
|
|
|
|
|
|
|
|
|
|
|
|
|
|
|
|
|
|
|
|
|
|
|
|
|
|
|
|
|
|
|
|
|
|
|
|
|
|
|
|
|
|
+20% кв-к-кв в переработке), SG&A расходов и затрат на приобретение, а также |
|
|
|
|
|
|
|
|
|
|
|
|
|
|
|
|
|
|
|
|
|
|
|
|
|
|
|
|
|
|
|
|
|
|
|
|
|
|
|
|
|
|
|
|
|
|
|
|
|
|
|
|
|
|
|
|
|
|
|
|
значительным увеличением чистого убытка от обесценения финансовых активов и |
|
|
|
|
|
|
|
|
|
|
|
|
|
|
|
|
|
|
|
|
|
|
|
|
|
|
|
|
|
|
|
|
|
|
|
|
|
|
|
|
|
|
|
|
|
|
|
|
|
|
|
|
|
|
|
|
|
|
|
|
основных средств (в 7 раз, на $0,2 млрд кв-к-кв) и появлением убытка от выбытия |
|
|
|
|
|
|
|
|
|
|
|
|
|
|
|
|
|
|
|
|
|
|
|
|
|
|
|
|
|
|
|
|
|
|
|
|
|
|
|
|
|
|
|
|
|
|
|
|
|
|
|
|
|
|
|
|
|
|
|
|
дочерних компаний и инвестиций в ассоциированные компании (в размере ~$30 млн). |
|
|
|
|
|
|
|
|
|
|
|
|
|
|
|
|
|
|
|
|
|
|
|
|
|
|
|
|
|
|
|
|
|
|
|
|
|
|
|
|
|
|
|
|
|
|
|
|
|
|
|
|
|
|
|
|
|
|
|
|
• Операционный денежный поток компании (без учета банковского сегмента) в 4 кв. 2018 г. |
|
|
|
|
2018 |
|
|
|
31% |
|
16,3 |
|
23% |
|
|
|
4,7 |
|
|
|
47% |
|
|
3,4 |
|
60% |
|
|
22,3 |
|
|
|
445 |
|
|
4,2 |
|
|
-6% |
|
|
|
3,4 |
|
|
|
|
15% |
|
|
|
|||||||||||
|
|
|
|
|
|
|
|
|
|
|
|
|
|
|
|
|
|
|
|
|
|
|
|
|
|
|
|
|
|
|
|
|
|
|
|
уменьшился на 8% или $0,1 млрд кв-к-кв (до $1,0 млрд): негативный эффект от снижения |
||||||||||||||||||||||||
|
|
|
|
|
|
|
|
|
|
|
|
|
|
|
|
|
|
|
|
|
|
|
|
|
|
|
|
|
|
|
|
|
|
|
|
|
|
|
|
|
|
|
|
|
|
|
|
|
|
|
|
|
|
|
|
|
|
|
||
|
|
|
|
|
|
|
|
|
|
|
|
|
|
|
|
|
|
|
|
|
|
|
|
|
|
|
|
|
|
|
|
|
|
|
|
|
|
|
|
|
|
|
|
|
|
|
|
|
|
|
|
|
|
|
|
|
|
|
EBITDA был частично нивелирован сокращением оборотного капитала. |
|
|
|
|
|
|
|
|
|
|
|
|
|
|
|
|
|
|
|
|
|
|
|
|
|
|
|
|
|
|
|
|
|
|
|
|
|
|
|
|
|
|
|
|
|
|
|
|
|
|
|
|
|
|
|
|
|
|
|
|
• В 4 кв. 2018 г. наблюдалось увеличение инвестиционной активности компании: |
|
|
|
|
|
|
|
|
|
|
|
|
|
|
|
|
|
|
|
|
|
|
|
|
|
|
|
|
|
|
|
|
|
|
|
|
|
|
|
|
|
|
|
|
|
|
|
|
|
|
|
|
|
|
|
|
|
|
|
|
капитальные вложения выросли на 30% кв-к-кв (+$0,1 млрд), достигнув $0,5 млрд. Около |
|
|
|
|
|
|
|
|
|
|
|
|
|
|
|
|
|
|
|
|
|
|
|
|
|
|
|
|
|
|
|
|
|
|
|
|
|
|
|
|
|
|
|
|
|
|
|
|
|
|
|
|
|
|
|
|
|
|
|
|
50% прироста инвестиций пришлось на сегмент «разведка и добыча»: +$0,06 млрд кв-к-кв. |
|
|
|
|
|
|
|
|
|
|
|
|
|
|
|
|
|
|
|
|
|
|
|
|
|
|
|
|
|
|
|
|
|
|
|
|
|
|
|
|
|
|
|
|
|
|
|
|
|
|
|
|
|
|
|
|
|
|
|
|
• В результате, по итогам 4 кв. 2018 г. свободный денежный поток компании (без учета |
|
|
|
|
|
|
|
|
|
|
|
|
|
|
|
|
|
|
|
|
|
|
|
|
|
|
|
|
|
|
|
|
|
|
||||||||||||||||||||||||||||
|
|
|
2017 |
|
|
|
26% |
|
13,2 |
|
32% |
|
|
|
3,2 |
|
|
|
26% |
|
|
2,1 |
|
30% |
|
|
15,5 |
|
|
|
26% |
|
|
4,4 |
|
|
15% |
|
|
|
3,0 |
|
|
|
|
-22% |
|
|
|
банковского сегмента) снизился на $0,2 млрд кв-к-кв (-27% кв-к-кв), составив $0,5 млрд |
||||||||||
|
|
|
|
|
|
|
|
|
|
|
|
|
|
|
|
|
|
|
|
|
|
|
|
|
|
|
|
|
|
|
|
|
|
|
|
|
|
|
|
|
|
|
|
|
|
|
|
|
|
|
|
|
|
|
|
|
|
|
($0,7 млрд кварталом ранее). |
|
|
|
|
|
|
|
|
|
|
|
|
|
|
|
|
|
|
|
|
|
|
|
|
|
|
|
|
|
|
|
|
|
|
|
|
|
|
|
|
|
|
|
|
|
|
|
|
|
|
|
|
|
|
|
|
|
|
|
|
• Чистая денежная позиция компании (с учетом банковских депозитов, отраженных в прочих |
|
|
|
|
|
|
|
|
|
|
|
|
|
|
|
|
|
|
|
|
|
|
|
|
|
|
|
|
|
|
|
|
|
|
|
|
|
|
|
|
|
|
|
|
|
|
|
|
|
|
|
|
|
|
|
|
|
|
|
|
краткосрочных финансовых активах) на конец 4 кв. 2018 г. составила $0,7 млрд против |
|
|
|
|
|
|
|
|
|
|
|
|
|
|
|
|
|
|
|
|
|
|
|
|
|
|
|
|
|
|
|
|
|
|
|
|
|
|
|
|
|
|
|
|
|
|
|
|
|
|
|
|
|
|
|
|
|
|
|
|
$1,5 млрд кварталом ранее: снижение в большей степени обусловлено выплатой |
|
|
|
|
|
|
|
|
|
|
|
|
|
|
|
|
|
|
|
|
|
|
|
|
|
|
|
|
|
|
|
|
|
|
|
|
|
|
|
|
|
|
|
|
|
|
|
|
|
|
|
|
|
|
|
|
|
|
|
|
дивидендов в размере $1,0 млрд. |
|
|
|
|
|
|
|
|
|
|
|
|
|
|
|
|
|
|
|
|
|
|
|
|
|
|
|
|
|
|
|
|
|
|
|
|
|
|
|
|
|
|
|
|
|
|
|
|
|
|
|
|
|
|
|
|
|
|
|
|
|
|
1EBITDA представлена операционной прибылью, чистая прибыль скорректирована на курсовые разницы
2Данные по EBITDA, EBITDA в расчете на баррель добычи указаны без учета операционных результатов банковской деятельности
15 Ежеквартальный обзор рынка нефти и газа России и Казахстана

vk.com/id446425943
Апрель 2019 г.
7.1.2 Газовые компании
|
|
|
|
|
|
|
|
|
|
|
|
Компания |
|
Период |
|
|
|
|
|
Газпром1,2 |
|
3 кв. 18 |
|
|
|
2 кв. 18 |
|
|
|
3 кв. 17 |
|
|
|
|
|
|
|
2017 |
|
|
|
|
|
|
|
|
|
|
|
2016 |
|
|
|
|
|
НОВАТЭК |
|
4 кв. 18 |
|
|
|
3 кв. 18 |
|
4 кв. 17
2018
2017
Абсолютные показатели (млрд долл. США)
Выручка |
г-к-г |
EBITDA |
г-к-г |
Чистая прибыль |
г-к-г |
29,5 |
21% |
10,1 |
68% |
5,9 |
74% |
29,7 |
22% |
9,3 |
54% |
4,2 |
>100% |
24,3 |
25% |
6,0 |
32% |
3,4 |
>100% |
112,1 |
23% |
24,9 |
30% |
11,7 |
-17% |
91,2 |
-8% |
19,2 |
-33% |
14,0 |
4% |
3,6 |
24% |
0,9 |
0% |
0,6 |
-18% |
3,3 |
51% |
1,1 |
41% |
0,7 |
10% |
2,9 |
28% |
0,9 |
10% |
0,8 |
-25% |
13,3 |
33% |
4,2 |
22% |
2,6 |
-3% |
10,0 |
25% |
3,4 |
17% |
2,7 |
-30% |
|
|
|
Динамика ключевых финансовых показателей |
||||
|
|
|
|
|
|
|
|
|
Удельные |
|
|
|
|
||
показатели |
|
|
|
Результаты отчетного периода (3-4 кв. 2018 г.) |
|||
(долл. США) |
|
|
|
|
|||
(CAPEXразведка |
добычаи)/б.н.э. |
|
г-к-г |
|
|
|
Комментарии к результатам отчетного периода |
|
|
|
|
|
|
|
|
3,0 |
|
71% |
|
|
|
• Консолидированная выручка Газпрома (в долларовом выражении) по итогам 3 кв. 2018 г. составила $29,5 млрд (+21% или |
|
|
|
|
|
|
|
|
+$5,2 млрд г-к-г). Более 50% прироста выручки было обеспечено увеличением поступлений от продаж газа (на $2,8 млрд г-к-г до |
|
|
|
|
|
|
|
$14 млрд) за счет наращивания объемов поставок (суммарно на 3,5 млрд куб. м, из которых 2,2 млрд куб. м пришлось на европейский |
|
|
|
|
|
|
|
рынок) и роста цен реализации в странах Европы и СНГ (на 29% и 9% г-к-г соответственно). Цена продажи газа на российском рынке в |
2,1 |
|
-20% |
|
|
|
долларовом выражении в сравнении г-к-г снизилась на 6%: положительный эффект от повышения регулируемых тарифов (на 3,4% с |
|
|
|
|
|
21 августа 2018 г.) был нивелирован девальвацией рубля. Выручка от прочих видов деятельности увеличилась на 18% или $2,4 млрд |
|||
|
|
|
|
|
|
|
|
|
|
|
|
|
|
|
г-к-г (до $15 млрд) за счет роста поступлений от продаж газового конденсата (+60% г-к-г) и продуктов нефтегазопереработки |
|
|
|
|
|
|
|
(+20% г-к-г). |
1,8 |
|
-55% |
|
|
|
• Операционные расходы в долларовом выражении увеличились на $1,0 млрд или 5% г-к-г (до $21,6 млрд), главным образом, за счет |
|
|
|
|
|
|
|
|
роста затрат на приобретение сырья (+22% г-к-г) и налоговых платежей (+15% г-к-г). |
•Опережающий рост выручки по сравнению с динамикой издержек способствовал увеличению EBITDA компании (в долларовом
выражении) до $10 млрд (+67% г-к-г или +$4,1 млрд).
|
2,9 |
|
-1% |
|
• Денежный поток от операционной деятельности по итогам 3 кв. 2018 г. вырос г-к-г более чем в 2,5 раза (до $7,3 млрд) – следствие |
|
|
|
|
|
|
|
|
|
|
|
значительного увеличения EBITDA. В результате, несмотря на 7%-ый рост г-к-г капитальных вложений в долларовом выражении (до |
|
|
|
|
|
$6,1 млрд – главным образом, за счет увеличения инвестиций в сегментах добычи и переработки), свободный денежный поток |
|
|
|
|
|
компании по итогам 3 кв. 2018 г. составил $1,2 млрд (-$2,9 млрд годом ранее). Величина накопленного FCF за 9 мес. 2018 г. |
|
|
|
|
|
|
|
2,9 |
|
-7% |
|
|
|
|
|
находилась на уровне $3,8 млрд (-$6,4 млрд годом ранее). |
||
|
|
|
|
|
•Чистый долг компании, скорректированный на величину кратко- и долгосрочных депозитов, на конец 3 кв. 2018 г. составил $33,6 млрд. Показатель чистый долг (скорректированный)/EBITDA – 0,9х.
3,4 |
>100% |
• По итогам 4 кв. 2018 г. валовая выручка компании достигла максимального значения за последнее десятилетие - $3,6 млрд (+24% г-к- |
|
|
г или +$0,7 млрд). Достижение рекордных показателей стало возможным благодаря увеличению поступлений от продаж природного |
|
|
газа (+$0,7 млрд г-к-г): за счет начала поставок СПГ на международные рынки (с декабря 2017 г.). Суммарная выручка от продажи |
|
|
жидких углеводородов снизилась на 3% г-к-г (-$0,06 млрд): вследствие уменьшения объемов реализации (в совокупности на 0,2 млн |
2,2 |
>100% |
тонн г-к-г). |
|
•Операционные издержки компании (с учетом прочих расходов) в долларовом выражении суммарно выросли на $0,7 млрд г-к-г, в основном, за счет почти 2-х кратного роста затрат на покупку природного газа и жидких углеводородов.
•В целом, по итогам 4 кв. 2018 г. значение EBITDA компании в сравнении г-к-г не изменилось, составив $0,95 млрд.
1,3 |
31% |
• Несмотря на стабильный уровень EBITDA, рост оборотного капитала (главным образом, за счет снижения кредиторской |
|
|
|
|
|
задолженности) в совокупности с сокращением величины полученных процентов и дивидендов от совместных предприятий привели к |
|
|
уменьшению денежного потока от операционной деятельности на $0,15 млрд г-к-г (-15% г-к-г) – до $0,8 млрд. |
• В 4 кв. 2018 г. наблюдалось 3-х кратное (в сравнении г-к-г) увеличение объема капитальных вложений – до $0,5 млрд
2,2 >100% (+$0,3 млрд г-к-г), что стало максимальным значением со второй половины 2013 г. Значительная часть инвестиций была направлена в
продолжающееся освоение Северо-Русского и Восточно-Тазовского месторождений, проект «Арктик СПГ 2» и строительство инфраструктуры для будущих СПГ проектов.
|
|
|
• В результате, по итогам 4 кв. 2018 г. FCF компании сократился до ~$0,3 млрд (-$0,5 млрд или -60% г-к-г) – минимальное значение со |
0,9 |
|
11% |
|
|
второй половины 2016 г. ($2,3 млрд суммарно за 2018 г., в 2017 г. – $2,7 млрд). |
||
|
|
|
•Чистый долг на конец 2018 г. находился на уровне $1,5 млрд (против $1,6 млрд годом ранее). Соотношение чистый долг/EBITDA
сохранилось на уровне 2017 г. – 0,4х.
1для пересчета 1 тыс. куб. м в баррели нефтяного эквивалента используется коэффициент 5,9; для пересчета газового конденсата в баррели нефтяного эквивалента используется коэффициент 8,1
2Публикация финансовой отчетности Группы Газпром по МСФО за 2018 год запланирована на конец апреля
16 Ежеквартальный обзор рынка нефти и газа России и Казахстана

vk.com/id446425943
Апрель 2019 г.
7.2Казахстан
|
|
|
|
|
|
|
|
|
|
|
|
|
|
|
|
|
|
|
|
|
|
|
|
|
|
|
|
|
|
|
|
|
|
|
|
Динамика ключевых финансовых показателей |
|
|
|||||||||||||||||
|
|
|
|
|
|
|
|
|
|
|
|
Абсолютные показатели (млрд долл. США) |
|
|
|
|
|
Удельные показатели (долл. США/барр.) |
|
|
|
|
Результаты отчетного периода (4 кв. 2018 г.) |
|
|||||||||||||||||||||||||||||||
|
|
|
|
|
|
|
|
|
|
|
|
|
|
|
|
|
|
|
|
|
|
||||||||||||||||||||||||||||||||||
|
|
|
|
|
|
|
|
|
|
|
|
|
|
|
|
|
|
|
|
|
|
|
|
|
|
|
|
|
|
|
|
|
|
|
|
|
|
|
|
|
|
|
|
|
|
|
|
|
|
|
|
|
|
|
|
|
Компания |
|
|
Период |
|
|
|
изменение |
Brentценыкв- |
или(кв-к г-к-г) |
Выручка |
|
кв-к-кв(для |
годового |
периодаг-к-г) |
|
|
EBITDA |
|
|
|
кв-к-кв(для |
годового |
периодаг-к-г) |
|
Чистая |
прибыль |
|
кв-к-кв(для |
годового |
периодаг-к-г) |
|
EBITDA/барр. |
|
|
|
кв-к-кв(для |
годового |
периодаг-к-г) |
|
баррOPEX/. |
|
|
кв-к-кв(для |
годового |
периодаг-к-г) |
|
CAPEX/барр. |
|
кв-к-кв(для |
годового |
периодаг-к-г) |
|
Комментарии к результатам отчетного периода |
|
|
|
|
|
|
|
|
|
|
|
|
|
|
|
|
|
|
|
|
|
|
|
|
|
|
|
|
|
|
|
|
|
|
|
|
|
|
|
|
|
|
|
|
|
|
|
|
|
|
|
|
|
|
|||
|
|
|
|
|
|
|
|
|
|
|
|
|
|
|
|
|
|
|
|
|
|
|
|
|
|
|
|
|
|
|
|
|
|
|
|
|
|
|
|
|
|
|
|
|
|
|
|
|
|
|
|
|
|
|
|
|
Nostrum1 |
|
|
4 кв. 18 |
-10% |
0,08 |
-35% |
|
0,05 |
|
-39% |
|
-0,13 |
|
- |
|
17,6 |
-38% |
|
4,1 |
|
-15% |
|
12,8 |
|
-12% |
|
|
• В 4 кв. 2018 г. валовая выручка компании снизилась на 35% кв-к-кв (~$41 млн кв-к-кв), |
||||||||||||||||||||||||||
|
|
|
|
|
|
|
|
|
|
|
|
|
|
|
|
|
|
|
|
|
|
|
|
|
|
|
|
|
|
|
|
|
|
|
|
|
|
|
|
|
|
|
|
|
|
|
|
|
|
|
|
|
|
составив $79 млн (минимальное значение со 2 кв. 2016 г.). Падение выручки в основном |
|
|
|
|
|
|
|
|
|
|
|
|
|
|
|
|
|
|
|
|
|
|
|
|
|
|
|
|
|
|
|
|
|
|
|
|
|
|
|
|
|
|
|
|
|
|
|
|
|
|
|
|
|
|
|
было вызвано примерно двукратным сокращением поступлений от реализации нефти и |
|
|
|
|
|
|
|
|
|
|
|
|
|
|
|
|
|
|
|
|
|
|
|
|
|
|
|
|
|
|
|
|
|
|
|
|
|
|
|
|
|
|
|
|
|
|
|
|
|
|
|
|
|
|
|
газового конденсата (-$40 млн кв-к-кв – до $47 млн) в связи с уменьшением средних цен |
|
|
|
|
|
|
|
|
|
|
|
|
|
|
|
|
|
|
|
|
|
|
|
|
|
|
|
|
|
|
|
|
|
|
|
|
|
|
|
|
|
|
|
|
|
|
|
|
|
|
|
|
|
|
|
поставок (-20% кв-к-кв) и объемов продаж (-26% кв-к-кв). Поступления от реализации |
|
|
|
|
|
|
|
|
|
|
|
|
|
|
|
|
|
|
|
|
|
|
|
|
|
|
|
|
|
|
|
|
|
|
|
|
|
|
|
|
|
|
|
|
|
|
|
|
|
|
|
|
|
|
|
природного газа и СУГ снизились на 4% кв-к-кв (до $32 млн): вследствие 6%-ного |
|
|
|
|
|
|
|
|
|
|
|
|
|
|
|
|
|
|
|
|
|
|
|
|
|
|
|
|
|
|
|
|
|
|
|
|
|
|
|
|
|
|
|
|
|
|
|
|
|
|
|
|
|
|
|
сокращения объема продаж. |
|
|
|
|
|
3 кв. 18 |
1% |
|
0,12 |
24% |
|
0,08 |
|
40% |
|
0,01 |
|
- |
|
28,3 |
48% |
|
4,8 |
|
-8% |
|
14,5 |
|
-3% |
|
|
• EBITDA компании в 4 кв. 2018 г. снизилась до минимума последних 2-х лет - $48 млн |
|||||||||||||||||||||||||
|
|
|
|
|
|
|
|
|
|
|
|
|
|
|
|
|
|
|
|
|
|
|
|
|
|
|
|
|
|
|
|
|
|
|
|
|
|
|
|
|
|
|
|
|
|
|
|
|
|
|
|
|
|
||
|
|
|
|
|
|
|
|
|
|
|
|
|
|
|
|
|
|
|
|
|
|
|
|
|
|
|
|
|
|
|
|
|
|
|
|
|
|
|
|
|
|
|
|
|
|
|
|
|
|
|
|
|
|
(-$31 млн кв-к-кв). Падение выручки было частично компенсировано сокращением |
|
|
|
|
|
|
|
|
|
|
|
|
|
|
|
|
|
|
|
|
|
|
|
|
|
|
|
|
|
|
|
|
|
|
|
|
|
|
|
|
|
|
|
|
|
|
|
|
|
|
|
|
|
|
|
издержек: производственных затрат - на 9% кв-к-кв, общих и административных расходов – |
|
|
|
|
|
|
|
|
|
|
|
|
|
|
|
|
|
|
|
|
|
|
|
|
|
|
|
|
|
|
|
|
|
|
|
|
|
|
|
|
|
|
|
|
|
|
|
|
|
|
|
|
|
|
|
на 33% кв-к-кв, затрат на реализацию и транспортировку – на 20% кв-к-кв, налоговых выплат |
|
|
|
|
|
|
|
|
|
|
|
|
|
|
|
|
|
|
|
|
|
|
|
|
|
|
|
|
|
|
|
|
|
|
|
|
|
|
|
|
|
|
|
|
|
|
|
|
|
|
|
|
|
|
|
– на 25% кв-к-кв. Рентабельность по EBITDA в 4 кв. 2018 г. находилась на уровне 61% (66% в |
|
|
|
|
|
|
|
|
|
|
|
|
|
|
|
|
|
|
|
|
|
|
|
|
|
|
|
|
|
|
|
|
|
|
|
|
|
|
|
|
|
|
|
|
|
|
|
|
|
|
|
|
|
|
|
3 кв. 2018 г.). |
|
|
|
|
|
|
|
|
|
|
|
|
|
|
|
|
|
|
|
|
|
|
|
|
|
|
|
|
|
|
|
|
|
|
|
|
|
|
|
|
|
|
|
|
|
|
|
|
|
|
|
|
|
|
|
• По итогам 4 кв. 2018 г. компания зафиксировала убыток в размере $133 млн (прибыль в |
|
|
|
|
|
2018 |
|
|
|
31% |
|
0,39 |
|
-4% |
|
|
|
0,24 |
|
|
|
4% |
|
|
-0,12 |
|
- |
|
|
21,0 |
|
|
|
30% |
|
|
4,6 |
|
|
13% |
|
|
15,0 |
|
12% |
|
|
||||||||||
|
|
|
|
|
|
|
|
|
|
|
|
|
|
|
|
|
|
|
|
|
|
|
|
|
|
|
|
|
|
|
|
размере $14 млн кварталом ранее) – на фоне снижения показателя EBITDA и признания |
|||||||||||||||||||||||
|
|
|
|
|
|
|
|
|
|
|
|
|
|
|
|
|
|
|
|
|
|
|
|
|
|
|
|
|
|
|
|
|
|
|
|
|
|
|
|
|
|
|
|
|
|
|
|
|
|
|
|
|
|
||
|
|
|
|
|
|
|
|
|
|
|
|
|
|
|
|
|
|
|
|
|
|
|
|
|
|
|
|
|
|
|
|
|
|
|
|
|
|
|
|
|
|
|
|
|
|
|
|
|
|
|
|
|
|
обесценения активов на сумму $150 млн (сокращение объема запасов категории 2P в связи |
|
|
|
|
|
|
|
|
|
|
|
|
|
|
|
|
|
|
|
|
|
|
|
|
|
|
|
|
|
|
|
|
|
|
|
|
|
|
|
|
|
|
|
|
|
|
|
|
|
|
|
|
|
|
|
с трудностями бурения в западной части Чинаревского месторождения). |
|
|
|
|
|
|
|
|
|
|
|
|
|
|
|
|
|
|
|
|
|
|
|
|
|
|
|
|
|
|
|
|
|
|
|
|
|
|
|
|
|
|
|
|
|
|
|
|
|
|
|
|
|
|
|
• Несмотря на негативную динамику EBITDA, эффективная работа компании с оборотным |
|
|
|
|
|
|
|
|
|
|
|
|
|
|
|
|
|
|
|
|
|
|
|
|
|
|
|
|
|
|
|
|
|
|
|
|
|
|
|
|
|
|
|
|
|
|
|
|
|
|
|
|
|
|
|
капиталом (в первую очередь, в части дебиторской задолженности) способствовала росту |
|
|
|
|
|
|
|
|
|
|
|
|
|
|
|
|
|
|
|
|
|
|
|
|
|
|
|
|
|
|
|
|
|
|
|
|
|
|
|
|
|
|
|
|
|
|
|
|
|
|
|
|
|
|
|
денежного потока от операционной деятельности на $11 млн (+22% кв-к-кв) – до $63 млн. |
|
|
|
|
|
|
|
|
|
|
|
|
|
|
|
|
|
|
|
|
|
|
|
|
|
|
|
|
|
|
|||||||||||||||||||||||||||
|
|
|
|
2017 |
|
|
|
24% |
|
0,41 |
|
17% |
|
|
|
0,23 |
|
|
|
39% |
|
|
-0,02 |
|
- |
|
|
16,2 |
|
|
|
43% |
|
|
4,1 |
|
|
11% |
|
|
13,4 |
|
-1% |
|
|
• Рост операционного денежного потока в совокупности со снижением инвестиционной |
|||||||||
|
|
|
|
|
|
|
|
|
|
|
|
|
|
|
|
|
|
|
|
|
|
|
|
|
|
|
|
|
|
|
|
|
|
|
|
|
|
|
|
|
|
|
|
|
|
|
|
|
|
|
|
|
|
активности (капитальные вложения уменьшились на $5 млн кв-к-кв) положительно |
|
|
|
|
|
|
|
|
|
|
|
|
|
|
|
|
|
|
|
|
|
|
|
|
|
|
|
|
|
|
|
|
|
|
|
|
|
|
|
|
|
|
|
|
|
|
|
|
|
|
|
|
|
|
|
сказались на величине свободного денежного потока: FCF компании по итогам 4 кв. 2018 г. |
|
|
|
|
|
|
|
|
|
|
|
|
|
|
|
|
|
|
|
|
|
|
|
|
|
|
|
|
|
|
|
|
|
|
|
|
|
|
|
|
|
|
|
|
|
|
|
|
|
|
|
|
|
|
|
составил $28 млн ($11 млн кварталом ранее) – максимальное значение за год. |
|
|
|
|
|
|
|
|
|
|
|
|
|
|
|
|
|
|
|
|
|
|
|
|
|
|
|
|
|
|
|
|
|
|
|
|
|
|
|
|
|
|
|
|
|
|
|
|
|
|
|
|
|
|
|
• Чистый долг на конец 2018 г. находился на уровне $1 млрд. Показатель чистый |
|
|
|
|
|
|
|
|
|
|
|
|
|
|
|
|
|
|
|
|
|
|
|
|
|
|
|
|
|
|
|
|
|
|
|
|
|
|
|
|
|
|
|
|
|
|
|
|
|
|
|
|
|
|
|
долг/EBITDA составил 4,2х (4,0х в 3 кв. 2018 г.). |
|
|
|
|
|
|
|
|
|
|
|
|
|
|
|
|
|
|
|
|
|
|
|
|
|
|
|
|
|
|
|
|
|
|
|
|
|
|
|
|
|
|
|
|
|
|
|
|
|
|
|
|
|
|
|
|
|
1 Удельные OPEX (для компании в расчете на б.н.э.) рассчитаны как себестоимость реализованной продукции за вычетом расходов по износу, истощению и амортизации, роялти и доли государства в прибыли, разделенная на общий объем продаж
17 Ежеквартальный обзор рынка нефти и газа России и Казахстана

vk.com/id446425943
Апрель 2019 г.
7.3Сравнение ключевых показателей анализируемых компаний СНГ и мира
Динамика добычи нефти и конденсата (% г-к-г)
30%
20%
10%
0%
-10%
-20%
Роснефть |
ЛУКОЙЛ |
Газпром нефть |
Сургутнефтегаз |
Татнефть |
Мейджор 1 |
Мейджор 2 |
Мейджор 3 |
Мейджор 4 |
Мейджор 5 |
Рентабельность по EBITDA
35%
30%
25%
20%
15%
10%
5%
|
Роснефть |
ЛУКОЙЛ |
Газпром нефть |
|
Сургутнефтегаз ¹ |
|
Татнефть |
|
Мейджор 1 |
Мейджор 2 |
Мейджор 3 |
Мейджор 4 |
|
Мейджор 5 |
||||
|
1 кв. 2017 |
|
|
|
2 кв. 2017 |
|
3 кв. 2017 |
|
4 кв. 2017 |
|
1 кв. 2018 |
|
2 кв. 2018 |
|
3 кв. 2018 |
|
4 кв. 2018 |
|
|
|
|
|
|
|
|
|
|
|
|||||||||
|
|
|
|
|
|
|
|
|
|
|||||||||
1 EBITDA представлена операционной прибылью
Источники: Bloomberg, данные компаний, Энергетический Центр EY (Центральная, Восточная, Юго-Восточная Европа и Центральная Азия)
ExxonMobil
•Операционный денежный поток (4 кв. 2018 г.): +16% г-к-г до $8,6 млрд
•Бассейн Permian (4 кв. 2018 г.): рост добычи на 93% г-к-г
•Шельф Гайаны: увеличение оцененных ресурсов на 5 млрд б.н.э.
•Нефтепереработка: запуск установки гидрокрекинга на НПЗ в Роттердаме
•Нефтехимия:
•Запланирован ввод 13 новых объектов к 2025 г. (7 из 13 уже запущены)
•Ожидается увеличение прибыли по сегменту в 2 раза к 2025 г.
•Соглашения о сотрудничестве с Китаем в отношении строительства комплекса по производству полиэтилена и полипропилена мощностью 1,2 млн тонн в год
BP
•Операционный денежный поток (4 кв. 2018 г.): +15% г-к-г до $7,1 млрд (искл. удержания по аварии в Мексиканском заливе)
•ROACE: рост с 5,8% в 2017 г. до 11,2% в 2018 г.
•ТРИЗ: завершение сделки по приобретению активов BHP на формациях Permian, Eagle Ford и Haynesville ($10,5 млрд)
•Нефтехимия: соглашение с SOCAR об изучении возможности создания СП по строительству и эксплуатации комплекса в Турции
•«Точка безубыточности»: планы по снижению с $50/барр. в 2018 г. до $35-40/барр. в 2021 г.
18 Ежеквартальный обзор рынка нефти и газа России и Казахстана

vk.com/id446425943
Апрель 2019 г.
7.3Сравнение ключевых показателей анализируемых компаний СНГ и мира (продолжение)
Динамика капвложений в долл. США сегменте разведка и добыча (% г-к-г)
160%
120%
80%
40%
0%
-40%
-80%
Роснефть |
ЛУКОЙЛ (РФ) |
Газпром нефть |
Татнефть |
Мейджор 1 |
Мейджор 2 |
Мейджор 3 |
Мейджор 4 |
Мейджор 5 |
Динамика капвложений в долл. США в сегменте переработка (% г-к-г)
240%
160%
80%
0%
-80%
|
Роснефть |
|
ЛУКОЙЛ (РФ) |
Газпром нефть |
Татнефть |
Мейджор 1 |
|
Мейджор 2 |
|
Мейджор 3 |
|
Мейджор 4 |
|
Мейджор 5 |
||
|
1 кв. 2017 |
|
2 кв. 2017 |
|
3 кв. 2017 |
|
|
4 кв. 2017 |
|
1 кв. 2018 |
|
2 кв. 2018 |
|
3 кв. 2018 |
|
4 кв. 2018 |
|
|
|
|
|
|
|
|
|
||||||||
|
|
|
|
|
|
|
|
|
||||||||
Источники: Bloomberg, данные компаний, Энергетический Центр EY (Центральная, Восточная, Юго-Восточная Европа и Центральная Азия)
Shell
•Операционный денежный поток (4 кв. 2018 г.): +42% г-к-г до $12,9 млрд (максимум со 2 кв. 2008 г.)
•СПГ: начало добычи газа в бассейне Browse в рамках проекта
Prelude FLNG (Австралия)
•Нефтехимия: запуск установки производства альфа-олефинов на проекте Geismar
•ВИЭ: покупка 310 тыс. акров на шельфе США для строительства ветряной электростанции
•Завершение программы по реализации непрофильных и неэффективных активов (получено более $30 млрд).
•Программа по выкупу акций до 2020 гг.: $25 млрд
•ROACE: планируемый рост с ~7,6% в 4 кв. 2018 г. до ~10% в
2019-21 гг.
Chevron
•Операционный денежный поток (4 кв. 2018 г.): +48% г-к-г до $9,2 млрд
•Бассейн Permian: рост добычи на 84% г-к-г (до 377 тыс. б.н.э в сутки в 4 кв. 2018 г.)
•Расширение портфеля: приобретение Anadarko за $33 млрд (объявлено в апреле 2019 г.)
•Нефтехимия: запуск первого этапа USGC Petrochemicals (мощностью 1,5 млн тонн этилена и 1 млн тонн полиэтилена)
Total S.A.
•Операционный денежный поток (4 кв. 2018 г.): + 24% г-к-г до $10,6 млрд
•СПГ: запуск проекта Ichthys LNG и третьей производственной очереди проекта Ямал СПГ
•ТРИЗ: соглашение с ADNOC о начале разведочных работ на нетрадиционные запасы в Абу-Даби
•Бразилия: выход на рынок продаж топлива
•Программа по выкупу акций: $5 млрд с 2018-2020 гг.
19 Ежеквартальный обзор рынка нефти и газа России и Казахстана

vk.com/id446425943
Апрель 2019 г.
7.4Международные «мейджоры»
Компания1
Мейджор
1
Мейджор
2
Мейджор
3
Мейджор
4
Мейджор
5
Период
4 кв. 18
3 кв. 18
2018
2017
4 кв. 18
3 кв. 18
2018
2017
4 кв. 18
3 кв. 18
2018
2017
4 кв. 18
3 кв. 18
2018
2017
4 кв. 18
3 кв. 18
2018
2017
|
|
|
|
|
Динамика ключевых финансовых показателей |
|
|
|
|
|
||
|
|
Абсолютные показатели (млрд долл. США) |
|
|
|
Удельные показатели (долл. США/барр.) |
|
|||||
изменение цены Brent кв- к-кв (или г-к-г) |
Выручка |
кв-к-кв (для годового периода г-к-г) |
EBITDA |
кв-к-кв (для годового периода г-к-г) |
Чистая прибыль |
кв-к-кв (для годового периода г-к-г) |
EBITDA/б.н.э. |
кв-к-кв (для годового периода г-к-г) |
OPEX/барр.2 |
кв-к-кв (для годового периода г-к-г) |
CAPEX (разведка и добыча)/б.н.э. |
кв-к-кв (для годового периода г-к-г) |
-10% |
71,9 |
-6% |
9,7 |
-16% |
6,0 |
-4% |
26,4 |
-20% |
37,7 |
4% |
16,9 |
11% |
1% |
76,6 |
4% |
11,5 |
25% |
6,2 |
58% |
33,1 |
19% |
36,1 |
-4% |
15,3 |
5% |
31% |
290,2 |
19% |
39,6 |
24% |
20,8 |
6% |
28,3 |
29% |
36,4 |
13% |
14,4 |
26% |
24% |
244,4 |
17% |
32,0 |
38% |
19,7 |
>100% |
22,0 |
40% |
32,2 |
8% |
11,5 |
17% |
-10% |
76,9 |
-5% |
6,3 |
-32% |
0,8 |
-77% |
25,9 |
-37% |
42,3 |
8% |
14,3 |
11% |
1% |
80,8 |
5% |
9,2 |
11% |
3,3 |
20% |
40,8 |
10% |
39,2 |
7% |
12,9 |
5% |
31% |
303,7 |
24% |
31,4 |
28% |
9,4 |
>100% |
33,9 |
24% |
38,8 |
2% |
13,0 |
-15% |
24% |
244,6 |
31% |
24,6 |
59% |
3,4 |
>100% |
27,3 |
43% |
37,9 |
-12% |
15,3 |
-14% |
-10% |
104,6 |
3% |
12,7 |
-12% |
5,6 |
-4% |
36,5 |
-16% |
31,1 |
7% |
13,8 |
15% |
1% |
101,5 |
2% |
14,4 |
8% |
5,8 |
-3% |
43,7 |
2% |
29,1 |
-11% |
12,0 |
10% |
31% |
396,6 |
27% |
53,3 |
28% |
23,4 |
80% |
39,9 |
28% |
30,4 |
2% |
11,7 |
5% |
24% |
311,9 |
30% |
41,7 |
52% |
13,0 |
>100% |
31,2 |
53% |
29,9 |
-8% |
11,1 |
-10% |
-10% |
53,6 |
-5% |
5,5 |
-36% |
1,1 |
-71% |
20,6 |
-38% |
26,9 |
-2% |
13,7 |
27% |
1% |
56,2 |
4% |
8,6 |
5% |
4,0 |
6% |
33,3 |
1% |
27,5 |
-2% |
10,8 |
-10% |
31% |
214,4 |
21% |
28,7 |
26% |
11,4 |
33% |
28,4 |
16% |
27,9 |
1% |
15,1 |
10% |
24% |
177,3 |
16% |
22,8 |
27% |
8,6 |
39% |
24,4 |
22% |
27,6 |
-3% |
13,7 |
-24% |
-10% |
42,4 |
-4% |
8,3 |
-11% |
3,7 |
-8% |
29,4 |
-15% |
25,4 |
2% |
17,5 |
5% |
1% |
44,0 |
4% |
9,4 |
19% |
4,0 |
19% |
34,5 |
13% |
25,0 |
-1% |
16,7 |
1% |
31% |
166,3 |
17% |
33,3 |
53% |
14,8 |
61% |
31,1 |
42% |
24,5 |
-2% |
16,5 |
0% |
24% |
141,7 |
24% |
21,8 |
65% |
9,2 |
- |
21,9 |
57% |
24,9 |
-9% |
16,5 |
-22% |
1Анализ включает следующие компании: Exxon Mobil, BP, Shell, Total, Chevron
2OPEX – затраты по всем бизнес сегментам
20 Ежеквартальный обзор рынка нефти и газа России и Казахстана

vk.com/id446425943
Апрель 2019 г.
8.Темы выпуска
8.1Динамика спредов по UST: ждать ли нового кризиса на рынках?1
Появившиеся в середине марта комментарии членов FOMC (Комитет по открытым рынкам ФРС США) стали неожиданными для подавляющего большинства участников рынка – по сравнению с декабрьским заседанием риторика резко изменилась, и по сути речь идет о принципиальном отказе от дальнейшего ужесточения монетарной политики и повышения ставок. Казалось бы, для нефтяного рынка разворот курса ФРС может принести лишь благо (правило «слабый доллар – сильная нефть» на длинных временных отрезках сохраняет свое действие), однако существует целый ряд нюансов, которые могут в значительной мере ограничить положительный эффект от принятых решений.
Так, корректировка монетарного курса произошла без видимых причин. Да, некоторые индикаторы указывают на постепенное охлаждение европейской и китайской экономики, при этом риск затягивания «торговых войн» пока полностью не исчез. Однако, видимого ухудшения ситуации по сравнению с декабрем не произошло, более того на целом ряде развивающихся рынков ситуация заметно улучшилась (например, нормализация показателя current account в Турции, снижение CDS по EM и т.п.).
При этом смена парадигмы членов FOMC привела к неравномерному снижению доходностей по UST, в результате чего пятница ознаменовалась достаточно интересным событием: спред между 10-и летними и 3 месячными обязательствами США стал отрицательным (впервые с августа 2007 г.). И этот факт дал повод целому ряду аналитиков написать о неизбежном
наступлении кризиса на рынках, т.к. инверсия доходностей «длинных» и «коротких» бумаг является одним из опережающих индикаторов грядущих экономических проблем. Справедливости ради отметим, что спрэд между десятилетними и двухлетними UST пока не стал отрицательным, однако вплотную подошел к нулевым отметкам.
Влияние динамики доходностей по UST на нефтяные цены может происходить по двум направлениям. Первое – это за счет изменения перетока капиталов между рынками – корреляция между динамикой спреда по UST- 10/UST-2 и сырьевым индексом BCOM составляет 0,8 (а между UST-3M/UST-10 и BCOM – 0,7). Второе – получение негативного эффекта от возможного замедления мировой экономики и ослабления мирового спроса на нефть. В общем, продолжаем внимательно следить за ситуацией на долговом рынке США, и в сложившихся условиях решение о пролонгации или прекращении действия соглашения «ОПЕК плюс» (истекает в середине текущего года) будет иметь важнейшее значение для поведения нефтяных котировок во второй половине
2019 г.
|
Динамика индекса BCOM и спредов по |
|
|
|
||||||||||||||||||||||||
|
UST, п.п. |
|
|
|
|
|
|
|
|
|
|
|
|
|
|
|
|
|
|
|
|
|
|
|
||||
|
4.5 |
|
|
|
|
|
|
|
|
|
|
|
|
|
|
|
|
|
|
|
|
|
|
|
|
|
|
250 |
|
4.0 |
|
|
|
|
|
|
|
|
|
|
|
|
|
|
|
|
|
|
|
|
|
|
|
|
|
|
|
|
3.5 |
|
|
|
|
|
|
|
|
|
|
|
|
|
|
|
|
|
|
|
|
|
|
|
|
|
|
200 |
|
3.0 |
|
|
|
|
|
|
|
|
|
|
|
|
|
|
|
|
|
|
|
|
|
|
|
|
|
|
|
|
2.5 |
|
|
|
|
|
|
|
|
|
|
|
|
|
|
|
|
|
|
|
|
|
|
|
|
|
|
150 |
|
2.0 |
|
|
|
|
|
|
|
|
|
|
|
|
|
|
|
|
|
|
|
|
|
|
|
|
|
|
|
п. |
|
|
|
|
|
|
|
|
|
|
|
|
|
|
|
|
|
|
|
|
|
|
|
|
|
|
|
|
п. |
1.5 |
|
|
|
|
|
|
|
|
|
|
|
|
|
|
|
|
|
|
|
|
|
|
|
|
|
|
|
|
|
|
|
|
|
|
|
|
|
|
|
|
|
|
|
|
|
|
|
|
|
|
|
|
|
|
100 |
|
|
1.0 |
|
|
|
|
|
|
|
|
|
|
|
|
|
|
|
|
|
|
|
|
|
|
|
|
|
|
|
|
|
|
|
|
|
|
|
|
|
|
|
|
|
|
|
|
|
|
|
|
|
|
|
|
|
|
|
|
|
0.5 |
|
|
|
|
|
|
|
|
|
|
|
|
|
|
|
|
|
|
|
|
|
|
|
|
|
|
|
|
0.0 |
|
|
|
|
|
|
|
|
|
|
|
|
|
|
|
|
|
|
|
|
|
|
|
|
|
|
50 |
|
|
|
|
|
|
|
|
|
|
|
|
|
|
|
|
|
|
|
|
|
|
|
|
|
|
|
|
|
|
-0.5 |
|
|
|
|
|
|
|
|
|
|
|
|
|
|
|
|
|
|
|
|
|
|
|
|
|
|
|
|
-1.0 |
|
|
|
|
|
|
|
|
|
|
|
|
|
|
|
|
|
|
|
|
|
|
|
|
|
|
0 |
|
1/2/2003 |
8/2/2003 |
3/2/2004 |
10/2/2004 |
5/2/2005 |
12/2/2005 |
7/2/2006 |
2/2/2007 |
9/2/2007 |
4/2/2008 |
11/2/2008 |
6/2/2009 |
1/2/2010 |
8/2/2010 |
3/2/2011 |
10/2/2011 |
5/2/2012 |
12/2/2012 |
7/2/2013 |
2/2/2014 |
9/2/2014 |
4/2/2015 |
11/2/2015 |
6/2/2016 |
1/2/2017 |
8/2/2017 |
3/2/2018 |
10/2/2018 |
|
|
|
BCOM (правая ось) |
|
|
|
2Y-10Y |
|
|
12M-2Y |
|
|
3M-10Y |
|
|
3Y-5Y |
||||||||||||
Источники: Bloomberg, Энергетический Центр EY (Центральная, Восточная, Юго-Восточная Европа и Центральная Азия)
8.2 Рынок СПГ Японии: конкуренция с атомной генерацией растет2
Большинство аналитических материалов, посвященных анализу азиатского рынка газа, как правило, содержат многостраничные размышления на тему ожидаемой динамики спроса со стороны КНР. При этом трем странам (Япония, Южная Корея и Тайвань), на долю которых в настоящее время приходится около половины потребления мирового СПГ, уделяется гораздо меньше внимания. С одной стороны, это оправдано для ситуации, когда мы говорим об оценке потенциальной «ниши» на региональных рынках (именно ситуация в Китае будет вносить основную лепту в динамику потребления СПГ в мире).
1,2 Комментарии Энергетического Центра EY (Центральная, Восточная, Юго-Восточная Европа и Центральная Азия) из мобильного приложения EY Oil &
Gas
21 Ежеквартальный обзор рынка нефти и газа России и Казахстана

vk.com/id446425943
Апрель 2019 г.
Однако, помимо емкости рынка существует не менее важное обстоятельство, которое будет влиять на экономику поставок СПГ, – это уровень цен. И в таком контексте ключевая роль по всей видимости все-таки будет сохраняться за Японией и маркером JCC («японский нефтяной коктейль») – ключевым элементом ценообразования на рынке СПГ региона.
Очевидно, что цены на СПГ контракты, базирующие на JCC, имеют существенную зависимость от котировок нефтяного рынка. При этом, если посмотреть на график ниже, то можно заметить связь между изменением импорта газа в Японию и чувствительностью цен на СПГ к нефтяным ценам. В условиях продолжающегося ренессанса атомной энергетики в Японии (несмотря на трагедию с Фукусимой за последние 3 года в стране было введено в строй 9 блоков АЭС и еще 6 получили необходимые разрешения на
строительство) можно ожидать снижения японского импорта СПГ примерно на 10 млн тонн в 2019-2020 гг. Такая динамика на фоне прогнозируемого ввода мощностей по сжижению (~80 млн тонн в ближайшие 3-5 лет) способна вызвать локальный
профицит мощностей и привести к «отвязке» цен СПГ для отдельных поставок от нефтяных котировок. А значит, поставщикам СПГ (особенно тем, кто не планирует заключать долгосрочных контактов) нужно иметь «запасной» вариант для оценки ожидаемой выручки и, как следствие, уровня маржинальности новых проектов.
Влияние импорта СПГ в Японию на |
|
|
|||||||||
региональный рынок, млн тонн в год |
|
||||||||||
12 |
|
|
|
|
|
|
|
|
|
|
1,4 |
9 |
|
|
|
|
|
|
|
|
|
|
1,2 |
|
|
|
|
|
|
|
|
|
|
|
|
6 |
|
|
|
|
|
|
|
|
|
|
1,0 |
|
|
|
|
|
|
|
|
|
|
|
|
|
|
|
|
|
|
|
|
|
|
|
0,8 |
3 |
|
|
|
|
|
|
|
|
|
|
|
|
|
|
|
|
|
|
|
|
|
|
0,6 |
0 |
|
|
|
|
|
|
|
|
|
|
0,4 |
|
|
|
|
|
|
|
|
|
|
|
|
-3 |
|
|
|
|
|
|
|
|
|
|
0,2 |
|
|
|
|
|
|
|
|
|
|
|
|
-6 |
|
|
|
|
|
|
|
|
|
|
0,0 |
2009 |
2010 |
2011 |
2012 |
2013 |
2014 |
2015 |
2016 |
2017 |
2018 |
2019 |
2020 |
|
Чувствительность цены на СПГ к цене на нефть (правая ось) |
||||||||||
|
Изменение импорта в Японию, г-к-г |
|
|
|
|
||||||
Источник: Bloomberg, GlobalData, оценка |
|
|
|
||||||||
Энергетического центра EY (Центральная, Восточная, |
|||||||||||
Юго-Восточная Европа и Центральная Азия) |
|
|
|||||||||
8.3 Нефтяные «мейджоры»: взгляд за пределы 2020 г.1
Мы уже неоднократно отмечали, что одной из отличительных черт эпохи «новой нормальности» нефтяного рынка является существенный рост неопределенности на фоне стремительно меняющегося мира и увеличения численности «черных лебедей». В таких условиях определение стратегических целей для ведущих нефтегазовых корпораций является достаточно сложной задачей. Однако существует целый ряд схожих элементов в планах развития «мейджоров», которые укрупненно можно представить, как:
•Продажа активов
•Участие в «сланцевых» проектах
•Разработка глубоководных запасов
•Развитие СПГ
•Инвестиции в нефтехимические мощности
•Альтернативная энергетика
О привлекательности нефтехимии мы говорили в одном из наших недавних комментариев, при этом, несложно заметить, что инвестиции в ТРИЗы и глубоководный шельф представляют не меньший (если не больший) интерес для «мейджоров». Так, например, компания ExxonMobil нацелена на 40%-ный рост добычи «нетрадиционной» нефти в США к 2025 г., Chevron планирует увеличить доли бассейна Permian в общем портфеле производственных активов в сегменте до 20% (около 650 тыс. б.н.э в сутки), а британская BP завершила в конце прошлого года сделку по приобретению «сланцевых» активов BHP в США (участки в 3-х сланцевых бассейнах с совокупной добычей около 190 тыс. б.н.э. в сутки). И, конечно, особо следует отметить возврат в список привлекательных проектов глубоководного шельфа, что, вероятно, обусловлено развитием технологий и переводом таких активов в категорию “cash engine”.
Ответ на вопрос, окажутся ли выбранные направления успешными сможет показать лишь время, однако пока инвестиционное сообщество оценивает выбранный путь дифференцированно, и ряду компаний предстоит доказать, что изменение их капитализации в диапазоне «хуже рынка» является временным явлением.
1 Комментарий Энергетического Центра EY (Центральная, Восточная, Юго-Восточная Европа и Центральная Азия) из мобильного приложения EY Oil & Gas
22 Ежеквартальный обзор рынка нефти и газа России и Казахстана
vk.com/id446425943
Апрель 2019 г.
Стратегии крупнейших нефтяных компаний
|
Продажа |
Разработка |
Разработка |
Реализация |
Новые |
Развитие |
|
сланцевых |
глубоководных |
новых СПГ |
мощности в |
альтернативной |
|
|
активов |
|||||
|
формаций |
запасов |
проектов |
нефтехимии |
энергетики |
|
ExxonMobil |
V |
V |
V |
V |
V |
|
|
|
|
|
|
|
|
BP |
V |
V |
V |
V |
|
V |
|
|
|
|
|
|
|
Shell |
V |
V |
V |
|
V |
V |
|
|
|
|
|
|
|
Total |
|
|
V |
V |
V |
V |
|
|
|
||||
Chevron |
|
|
|
|
|
|
V |
V |
V |
|
V |
|
|
Equinor |
|
|
|
|
|
|
|
V |
V |
|
|
V |
|
ENI |
|
|
|
|
|
|
|
|
V |
V |
|
V |
|
Sinopec |
|
|
|
|
|
|
|
V |
|
|
V |
V |
|
Repsol |
|
|
|
|
|
|
V |
|
V |
|
V |
|
|
|
|
|
|
|
|
|
Источники: материалы компаний, оценка Энергетического Центра EY (Центральная, Восточная, Юго-Восточная Европа и Центральная Азия)
Изменение капитализации мировых нефтегазовых компаний
2017 – настоящее время
35% |
|
|
|
|
|
|
|
|
|
|
|
|
|
|
|
|
|
|
|
|
|
|
|
|
|
|
|
|
|
|
|
|
|
|
|
|
|
|
|
|
|
|
|
|
|
|
|
|
|
|
|
|
|
|
|
|
|
|
|
||
30% |
|
|
|
|
|
|
|
|
|
|
|
|
|
|
|
|
|
|
|
|
|
|
|
|
|
|
|
|
|
|
|
|
|
|
|
|
|
|
|
|
|
|
|
|
|
|
|
|
|
|
|
|
|
|
|
|
|
|
|
|
|
|
|
|
|
|
|
|
|
|
|
|
|
|
|
|
|
|
|
|
|
|
|
|
|
|
|
|
|
|||
25% |
|
|
|
|
|
|
|
|
|
|
|
|
|
|
|
|
|
|
|
|
|
|
|
|
|
|
|
|
|
|
|
|
|
|
|
|
|
|
|
|
|
|
|
|
|
|
|
|
|
|
|
|
|
|
|
|
|
|
|
|
|
20% |
|
|
|
|
|
|
|
|
|
|
|
|
|
|
|
|
|
|
|
|
|
|
|
|
|
|
|
|
|
|
|
|
|
|
|
|
|
|
|
|
|
|
|
|
|
|
|
|
|
|
|
|
|
|
|
|
|
|
|
|
|
|
|
|
|
|
|
|
|
|
|
|
|
|
|
|
|
|
|
|
|
|
|
|
|
|
|
|
|
|
|
|
15% |
|
|
|
|
|
|
|
|
|
|
|
|
|
|
|
|
|
|
|
|
|
|
|
|
|
|
|
|
|
|
10% |
|
|
|
|
|
|
|
|
|
|
|
|
|
|
|
|
|
|
|
|
|
|
|
|
|
|
|
|
|
|
|
|
|
|
|
|
|
|
|
|
|
|
|
|
|
|
|
|
|
|
|
|
|
|
|
|
|
|
|
|
|
5% |
|
|
|
|
|
|
|
|
|
|
|
|
|
|
|
|
|
|
|
|
|
|
|
|
|
|
|
|
|
|
0% |
|
|
|
|
|
|
|
|
|
|
|
|
|
|
|
|
|
|
|
|
|
|
|
|
|
|
|
|
|
|
-5% |
|
|
|
|
|
|
|
|
|
|
|
|
|
|
|
|
|
|
|
|
|
|
|
|
|
|
|
|
|
|
-10% |
|
|
|
|
|
|
|
|
|
|
|
|
|
|
|
|
|
|
|
|
|
|
|
|
|
|
|
|
|
|
|
|
|
|
|
|
|
|
|
|
|
|
|
|
|
|
|
|
|
|
|
|
|
|
|
|
|
|
|
|
|
1 |
|
2 |
3 |
4 |
|
|
|
5 |
6 |
7 |
|
8 |
9 |
|
||||||||||||||||
|
|
|
Компания |
|
Компания |
|
|
Компания |
|
Компания |
Компания |
|
Компания |
|
|
|
Компания |
Компания |
|
Компания |
|
|||||||||
|
|
|
|
|
|
|
|
|
Среднее значение |
|
|
|
Brent |
|
|
Dow Jones |
|
|
|
|
|
|||||||||
|
|
|
|
|
|
|
|
|
|
|
|
|
|
|
|
|
|
|
||||||||||||
2018 – настоящее время |
|
|
|
|
|
|
|
|
|
|
|
|
|
|
|
|||||||||||||||
15% |
|
|
|
|
|
|
|
|
|
|
|
|
|
|
|
|
|
|
|
|
|
|
|
|
|
|
|
|
|
|
|
|
|
|
|
|
|
|
|
|
|
|
|
|
|
|
|
|
|
|
|
|
|
|
|
|
|
|
|
|
|
10% |
|
|
|
|
|
|
|
|
|
|
|
|
|
|
|
|
|
|
|
|
|
|
|
|
|
|
|
|
|
|
|
|
|
|
|
|
|
|
|
|
|
|
|
|
|
|
|
|
|
|
|
|
|
|
|
|
|
|
|
|
|
5% |
|
|
|
|
|
|
|
|
|
|
|
|
|
|
|
|
|
|
|
|
|
|
|
|
|
|
|
|
|
|
|
|
|
|
|
|
|
|
|
|
|
|
|
|
|
|
|
|
|
|
|
|
|
|
|
|
|
|
|
|
|
0% |
|
|
|
|
|
|
|
|
|
|
|
|
|
|
|
|
|
|
|
|
|
|
|
|
|
|
|
|
|
|
|
|
|
|
|
|
|
|
|
|
|
|
|
|
|
|
|
|
|
|
|
|
|
|
|
|
|
|
|
|
|
|
|
|
|
|
|
|
|
|
|
|
|
|
|
|
|
|
|
|
|
|
|
|
|
|
|
|
|
|
|
|
-5% |
|
|
|
|
|
|
|
|
|
|
|
|
|
|
|
|
|
|
|
|
|
|
|
|
|
|
|
|
|
|
|
|
|
|
|
|
|
|
|
|
|
|
|
|
|
|
|
|
|
|
|
|
|
|
|
|
|
|
|
|
|
|
|
|
|
|
|
|
|
|
|
|
|
|
|
|
|
|
|
|
|
|
|
|
|
|
|
|
|
|
|
|
-10% |
|
|
|
|
|
|
|
|
|
|
|
|
|
|
|
|
|
|
|
|
|
|
|
|
|
|
|
|
|
|
|
|
|
|
|
|
|
|
|
|
|
|
|
|
|
|
|
|
|
|
|
|
|
|
|
|
|
|
|
|
|
|
|
|
|
|
|
|
|
|
|
|
|
|
|
|
|
|
|
|
|
|
|
|
|
|
|
|
|
|
|
|
2 |
|
4 |
7 |
3 |
|
|
|
1 |
8 |
5 |
|
9 |
6 |
|
||||||||||||||||
|
|
|
Компания |
|
Компания |
|
|
Компания |
|
Компания |
Компания |
|
Компания |
|
|
|
Компания |
Компания |
|
Компания |
|
|||||||||
|
|
|
|
|
|
|
|
Среднее значение |
|
|
|
Brent |
|
|
Dow Jones |
|
|
|
|
|
||||||||||
|
|
|
|
|
|
|
|
|
|
|
|
|
|
|
|
|
|
|||||||||||||
Источники: Bloomberg, оценка Энергетического Центра EY (Центральная, Восточная, Юго-Восточная Европа и Центральная Азия)
8.4 Мировой спрос на нефтепродукты: единой динамики не ожидается1
Структура мирового спроса на первичную энергию за последние 10 лет претерпела определенную трансформацию. Так, наблюдается снижение доли ископаемого топлива в структуре мирового энергопотребления (с 87% до 84%), которое происходит не только за счет угля, но и за счет нефтяного сырья, доля которого сократилась с 35% до 33% в 2017 г. При этом динамика потребления нефтепродуктов (с доминирующей ролью моторных топлив, около 60%) остается ключевым триггером изменения добычи жидких углеводородов.
Изменение баланса потребления первичной энергии
6% |
6% |
6% |
6% |
6% |
6% |
6% |
|
7% |
|
|
7% |
|
|
7% |
|
7% |
|
7% |
|
7% |
|
|||||||
6% |
6% |
5% |
5% |
5% |
5% |
5% |
4% |
|
||||||||||||||||||||
|
|
4% |
|
|||||||||||||||||||||||||
|
|
|
|
4% |
||||||||||||||||||||||||
|
|
|
|
|
|
4% |
|
|
4% |
|
|
4% |
|
|||||||||||||||
29% |
29% |
30% |
30% |
30% |
30% |
30% |
30% |
|
|
|
|
|
|
|
|
|
||||||||||||
30% |
30% |
29% |
28% |
28% |
||||||||||||||||||||||||
22% |
22% |
22% |
22% |
22% |
23% |
22% |
23% |
23% |
23% |
23% |
23% |
23% |
||||||||||||||||
|
||||||||||||||||||||||||||||
36% |
35% |
35% |
34% |
34% |
34% |
33% |
33% |
33% |
33% |
33% |
33% |
33% |
||||||||||||||||
|
|
|
|
|
|
|
|
|
|
|
|
|
|
|
|
|
|
|
|
|
|
|
|
|
|
|
|
|
2005 |
2006 |
|
2007 |
2008 |
2009 |
|
2010 |
2011 |
2012 |
|
2013 |
|
2014 |
2015 |
|
2016 |
|
2017 |
|
|||||||||
|
|
|
|
Прочее |
|
|
|
|
Солнечная энергия |
|
Атомная энергетика |
|
|
Газ |
|
|
|
|||||||||||
|
|
|
|
|
|
|
|
|
|
|
|
|
|
|||||||||||||||
|
|
|
|
Ветровая энергия |
|
|
|
Гидроэнергетика |
|
|
|
|
Уголь |
|
|
|
|
|
|
Нефть |
|
|
|
|||||
|
|
|
|
|
|
|
|
|
|
|
|
|
|
|
|
|
|
|
|
|||||||||
Источники: BP, оценка Энергетического центра EY по региону Центральная, Восточная, Юго-Восточная Европа и Центральная Азия
Однако, когда речь заходит о прогнозах дальнейшего изменения спроса на нефтепродукты, то зачастую можно встретить лишь описание самых общих цифр без детализации по отдельным видам выпускаемой продукции и регионам потребления. А такая разбивка является крайне важной: достаточно сказать, что за период 2005-2017 гг. при общем увеличении спроса на нефтепродукты примерно на 0,33 млн баррелей в сутки потребление мазута уменьшилось примерно на 0,25 млн баррелей в сутки. При этом прирост потребности со стороны развивающихся стран (прежде всего, за счет Китая, Индии и
Ближнего Востока) составил порядка 500 тыс. баррелей в сутки, в то время как в Европе (без учета показателей Турции) потребность в нефтепродуктах снизилась примерно на 50 тыс. баррелей в сутки.
1 Комментарий Энергетического Центра EY (Центральная, Восточная, Юго-Восточная Европа и Центральная Азия) из мобильного приложения EY Oil & Gas
23 Ежеквартальный обзор рынка нефти и газа России и Казахстана

vk.com/id446425943
Апрель 2019 г.
В условиях, когда рост ВВП, изменение парка автомобилей, подход к топливной эффективности, экологии и т.п. может кардинально отличаться от региона к региону, общая благоприятная картина («спрос на нефтепродукты в мире будет расти») может не работать в отношении отдельно взятой географии. В частности, мы ожидаем, что в Европе при сохранении общего уровня потребления нефтепродуктов спрос на моторные топлива продолжит стагнировать (в т.ч. за счет «эффекта насыщения» в условиях высокого уровня автомобилизации). А значит, европейские НПЗ должны быть готовы к изменению сложившихся спредов и необходимости адаптировать корзину
выпускаемых нефтепродуктов под ожидаемые потребности рынка.
Автомобилизация в европейских странах, штук на 1000 чел.
800 |
|
707 |
|
|
|
|
|
|
|
|
|
|
|
|
|
|
|
700 |
|
|
|
|
|
|
|
|
|
|
|
|
|
|
|
||
|
|
|
665 |
|
|
|
|
|
|
|
|
|
|
|
|
|
|
|
|
|
|
|
611 |
593 |
587 |
580 |
|
|
|
|
|
|
|
|
|
600 |
|
|
|
|
|
559 |
|
|
|
|
|
|
|
|
|||
|
|
|
|
|
|
|
|
|
|
|
|
|
|
|
|||
|
|
|
|
|
|
|
|
|
|
|
|
|
|
|
|
|
|
|
|
|
|
|
|
|
|
|
|
516 |
501 |
|
|
|
|
|
|
500 |
|
|
|
|
|
|
|
|
|
|
|
|
|
|
|
|
|
|
|
|
|
|
|
|
|
|
|
|
|
|
|
|
|
|
|
|
|
|
|
|
|
|
|
|
|
|
|
416 |
394 |
|
|
|
|
400 |
|
|
|
|
|
|
|
|
|
|
|
|
|
|
|
|
|
|
|
|
|
|
|
|
|
|
|
|
|
|
|
|
|
|
|
|
|
|
|
|
|
|
|
|
|
|
|
|
|
329 |
|
|
|
300 |
|
|
|
|
|
|
|
|
|
|
|
|
|
|
285 |
|
|
|
|
|
|
|
|
|
|
|
|
|
|
|
|
|
|
|
|
200 |
|
|
|
|
|
|
|
|
|
|
|
|
|
|
|
|
|
100 |
|
|
|
|
|
|
|
|
|
|
|
|
|
|
|
|
Китай (148) |
|
|
|
|
|
|
|
|
|
|
|
|
|
|
|
|
||
|
|
|
|
|
|
|
|
|
|
|
|
|
|
|
|
|
|
0 |
|
|
|
|
|
|
|
|
|
|
|
|
|
|
|
|
|
|
Италия |
Австрия |
Испания |
Германия |
Великобритания |
Франция |
Чехия |
Болгария |
Литва |
Хорватия |
Венгрия |
Румыния |
Турция |
||||
|
|
||||||||||||||||
Источники: ACEA, OICA, оценка Энергетического центра EY по региону Центральная, Восточная, Юго-Восточная Европа и Центральная Азия
24 Ежеквартальный обзор рынка нефти и газа России и Казахстана
vk.com/id446425943
Апрель 2019 г.
9.Ключевые темы нефтегазового рынка России
9.1Налогообложение в нефтегазовой отрасли
•Реализация «Дорожной карты» по оценке сложившейся дифференциации налоговых условий и мер дальнейшего стимулирования добычи нефти
•Совершенствование налоговой политики государства для повышения эффективности работы рынка моторных топлив (донастройка «демпфера»)
•Практическая имплементация налога на дополнительный доход (НДД) в России
•Заключение соглашений о модернизации НПЗ как одна из возможностей по получению «обратного акциза» на нефтяное сырье
•Разработка налоговых стимулов для работы в Арктике
•Проработка налоговых механизмов для создания условий развития этановой нефтехимии
•Анализ действующей формулы НДПИ на природный газ и конденсат в условиях изменившейся конъюнктуры
9.2Разведка и добыча
•Инновационное развитие и цифровизация отрасли («умное» месторождение, рост КИН и т.п.)
•«Инвентаризация» запасов нефти для месторождений с запасами более 5 млн тонн
•Технологические и финансовые вызовы в свете санкций, импортозамещение
•Развитие «полигонов» для ТРИЗ
•Реализация программ по оптимизации издержек и бизнес-процессов
•Сотрудничество с азиатскими компаниями
9.3Нефтепереработка и сбыт
•Динамика маржи переработки в условиях дальнейшей «донастройки» налоговой системы и введения «завершения налогового маневра» (ЗНМ)
•Оценка влияния новых налоговых условий (включая «демпфер») на динамику нефтепродуктовых цен и маржу АЗС
•Анализ влияния условий IMO 2020 на динамику спроса на отдельные виды топлив
•Модернизация и технологические вопросы в свете импортозамещения
•Рассмотрение возможностей по корректировке «четырехсторонних соглашений» в условиях изменившейся макросреды и введения ЗНМ
9.4Нефтесервисные услуги
•Вопросы взаимодействия с заказчиками
•Технологические вызовы
•Стратегии развития
•Замещение иностранных подрядчиков: новые возможности
•Обновление основных средств
•Анализ мирового опыта по стимулированию сегмента OFS
9.5Газовая отрасль
•Реализация проектов по сооружению новых экспортных газопроводов
•Новые СПГ проекты в России
•Ценообразование на внутреннем рынке и таможенно-тарифная политика государства
•Развитие газовой отрасли на Востоке
•Взаимоотношения со странами ЕС
•Развитие биржевой торговли
9.6Транспортировка
•Вопросы качества нефти, поставляемой в систему ПАО «Транснефть»
•Обсуждение принципов тарифообразования в средне- и долгосрочной перспективах
•Строительство нефтепродуктопроводов
25 Ежеквартальный обзор рынка нефти и газа России и Казахстана

vk.com/id446425943
Апрель 2019 г.
Контактная информация
Алексей Лоза
Партнер, руководитель направления
по оказанию услуг компаниям ТЭК, Центральная, Восточная, ЮгоВосточная Европа и Центральная Азия
Тел.: +7 (495) 641 2945
Alexey.Loza@ru.ey.com
Петр Медведев
Партнер, руководитель международной группы по оказанию услуг ключевым компаниям
нефтегазовой отрасли
Тел.: +7 (495) 755 9877 Petr.V.Medvedev@ru.ey.com
Дмитрий Лобачев
Партнер, руководитель
международной группы по оказанию услуг ключевым компаниям нефтегазовой отрасли
Тел.: +7 (495) 228 3677
Dmitry.Lobachev@ru.ey.com
Алексей Рябов
Партнер, руководитель направления
по оказанию налоговых услуг
компаниям ТЭК, Центральная,
Восточная, Юго-Восточная Европа и
Центральная Азия
Тел.: +7 (495) 641 2913
Alexei.Ryabov@ru.ey.com
Артем Козловский
Партнер, руководитель направления
по оказанию консультационных
услуг компаниям нефтегазового сектора, Центральная, Восточная,
Юго-Восточная Европа и
Центральная Азия
Тел.: +7 (495) 705 9731
Artiom.Kozlovski@ru.ey.com
Григорий Арутюнян
Партнер, руководитель направления по оказанию консультационных услуг по сделкам компаниям ТЭК, Центральная, Восточная, Юго-
Восточная Европа и Центральная
Азия Тел.: +7 (495) 641 2941
Grigory.S.Arutunyan@ru.ey.com
Денис Борисов
Руководитель Энергетического
Центра, Центральная, Восточная,
Юго-Восточная Европа и Центральная Азия
Тел.: +7 (495) 664-7848 Denis.Borisov@ru.ey.com
Полина Немировченко
Директор по развитию бизнеса по оказанию услуг компаниям нефтегазового сектора,
Центральная, Восточная, Юго-
Восточная Европа и Центральная
Азия
Тел.: +7 (495) 641 2919
Polina.Nemirovchenko@ru.ey.com
Дмитрий Дзюба
Старший менеджер,
Энергетический Центр,
Центральная, Восточная, Юго-
Восточная Европа и Центральная
Азия
Тел.: + 7 (495) 287-6514
Dmitry.Dzyuba@ru.ey.com
Ольга Белоглазова
Менеджер,
Энергетический Центр,
Центральная, Восточная, Юго-
Восточная Европа и Центральная
Азия Тел.: +7 (495) 755 9700
Olga.Beloglazova@ru.ey.com
Наталья Изотова
Главный аналитик,
Энергетический Центр,
Центральная, Восточная, Юго-
Восточная Европа и Центральная Азия
Тел.: +7 (495) 755-9700
Natalia.Izotova@ru.ey.com
26 Ежеквартальный обзор рынка нефти и газа России и Казахстана

vk.com/id446425943
EY | Assurance | Tax | Transactions | Advisory
Краткая информация о компании EY
EY является международным лидером в области аудита, налогообложения, сопровождения сделок и консультирования. Наши знания и качество услуг помогают укреплять доверие общественности к рынкам капитала и экономике в разных странах мира. Мы формируем выдающихся лидеров, под руководством которых наш коллектив всегда выполняет взятые на себя обязательства. Тем самым мы вносим значимый вклад в улучшение деловой среды на благо наших сотрудников, клиентов и общества в целом.
Мы взаимодействуем c компаниями из стран СНГ, помогая им в достижении бизнесцелей. В 20 офисах нашей фирмы (в Москве, Санкт-Петербурге, Новосибирске, Екатеринбурге, Казани, Краснодаре, Ростове-на-Дону, Владивостоке, ЮжноСахалинске, Тольятти, Алматы, Астане, Атырау, Бишкеке, Баку, Киеве, Ташкенте, Тбилиси, Ереване и Минске) работают 4500 специалистов.
Название EY относится к глобальной организации и может относиться к одной или нескольким компаниям, входящим в состав Ernst & Young Global Limited, каждая из которых является отдельным юридическим лицом. Ernst & Young Global Limited − юридическое лицо, созданное в соответствии с законодательством Великобритании, − является компанией, ограниченной гарантиями ее участников, и не оказывает услуг клиентам. Более подробная информация представлена на нашем сайте: ey.com.
Как международный центр компании EY по оказанию услуг компаниям нефтегазовой отрасли может помочь вашему бизнесу
В нефтегазовой отрасли происходят постоянные изменения. Растущая неопределенность энергетической политики, нестабильная геополитическая обстановка, необходимость эффективного управления затратами, изменение климата − все эти факторы создают дополнительные трудности для нефтегазовых компаний.
Международный центр компании EY по оказанию услуг компаниям нефтегазовой отрасли сформировал глобальную сеть из 10000 специалистов с большим опытом работы в области аудита, налогообложения, сопровождения сделок и консультирования предприятий, осуществляющих деятельность в сегментах разведки и добычи нефти и газа, переработки, транспортировки и сбыта нефтегазовой продукции, а также предоставления нефтесервисных услуг. Функции центра включают определение рыночных тенденций, обеспечение мобильности глобальных ресурсов и выработку мнений экспертов по важным вопросам отрасли. Опираясь на глубокое знание отраслевой специфики, мы можем помочь вашей компании раскрыть свой потенциал путем снижения затрат и повышения конкурентоспособности бизнес
© 2019 «Эрнст энд Янг (СНГ) Б.В.» Все права защищены.
Настоящий отчет подготовлен исключительно в информационных целях на основе, насколько нам известно,
правомерно опубликованных данных. Мнения, оценки и прогнозы, представленные в данном отчете, отражают
текущую точку зрения авторов на дату составления этого отчета. Они не обязательно отражают мнение EY.
Содержащиеся в настоящем отчете информация и выводы были получены и основаны на публичных и/или общедоступных источниках, которые мы, в целом, считаем надежными. Однако, несмотря на всю тщательность,
с которой готовился настоящий отчет, не существует никаких гарантий и не предоставляется никаких заверений,
что содержащаяся в отчете информация является полной и достоверной, и, соответственно, она не должна
рассматриваться как полная и достоверная. Мы в прямой форме снимаем с себя ответственность и обязательства в связи с любой информацией, содержащейся в настоящем обзоре. EY не принимает на себя обязательств по обновлению, изменению, дополнению настоящего отчета или уведомлению читателей в какой-либо форме в том случае, если какой-либо из упомянутых в отчете фактов, мнений, расчетов, прогнозов или оценок изменится или
иным образом утратит актуальность. Прогнозы, содержащиеся в отчете, могут быть неточными, так как они
являются лишь оценкой аналитиков. Информация, содержащаяся в настоящей публикации, представлена в сокращенной форме, в связи с чем она не может ни рассматриваться в качестве полноценной замены подробного отчета о проведенном исследовании и других упомянутых в отчете материалов, ни служить основанием для вынесения профессионального суждения. Материалы, предоставленные в настоящем отчете, носят
информационный характер и не являются рекламой каких-либо товаров, работ или услуг, консультацией,
рекомендацией, предложением к совершению каких-либо действий либо публичной офертой. EY не несет ответственности за любые убытки, понесенные какими-либо лицами в результате действия либо отказа от действия на основании сведений, содержащихся в данной публикации. Настоящий отчет предназначен только для лиц, являющихся допустимыми получателями данного отчета в той юрисдикции, в которой находится или к
которой принадлежит получатель отчета, и которые могут получать данный отчет без того, чтобы
распространение данного отчета таким лицам нарушало или не соответствовало законодательным и регуляторным требованиям указанной юрисдикции. Соответственно, каждый получатель данного отчета вправе использовать данный отчет только в случае, если он является таким допустимым получателем. Если в тексте отчета прямо не указано иное, наименования брендов и сокращения, используемые в рамках настоящего отчета, не являются указанием или ссылкой на какие-либо конкретные товарные знаки или юридические лица. Данный
отчет не может быть воспроизведен или копирован полностью или в какой-либо части без письменного согласия
EY.
ey.com
EY Oil & Gas (EY Нефть и газ) —
мобильное приложение
для руководителей
нефтегазовой отрасли.
Почему оно может быть полезно для вас?
Вам предоставляются:
—ключевые новости отрасли, отобранные аналитиками Московского нефтегазового центра компании EY;
—глобальные и локальные публикации и отраслевая аналитика EY по разделам с возможностью загрузки и отправки материалов на почту;
—возможность участвовать в аналитических отраслевых опросах и первыми получать результаты исследований;
—возможность всегда иметь в своем календаре
информацию об отраслевых деловых мероприятиях
и тематических семинарах;
—возможность напрямую связаться с нами.
Приложение можно скачать в App Store или Google Play.
Подробности - на сайте: www.eyapp.ru

vk.com/id446425943
Searching for new drivers
Global Asset Allocation Strategy April 2019
Investments │ Wealth Management

vk.com/id446425943 |
April 2019 |
Searching for new drivers
KEEP EQUITIES NEUTRAL
•The equity rally has tapered off in March, but global equities have already delivered more than a yearly return YTD.
•At the same time downside risks for global growth has increased, and it is too early to call a stabilization in the deterioration in the earnings outlook.
•We still believe we will not see a recession this year, and that decent growth together with relative valuation support equities. On the other hand, trade war risks, a weak industrial cycle and Brexit clearly creates a cloudy outlook. We keep our neutral allocation while markets are searching for new drivers.
EQUITY STRATEGY: Lift Europe
•We recommend to lift Europe to an overweight position. We think investors are too pessimistic as we expect fundamentals to stabilize, and the region is fairly priced.
•Japan is uninspiring on all counts, especially earnings, and we lower Japan to underweight.
•Within equity sectors we move Industrials to underweight on the back of weakness in the cycle, and lift Consumer Staples to neutral. Hence we are moving to a more defensive stance.
FIXED INCOME STRATEGY: Keep neutral
•Government yields decreased considerably in March. We recommend neutral allocation between the fixed income segments.
•Overall, we still expect modest returns from bonds in 2019, as spread and yield levels are low in a historic context.
This material was prepared by Investments |

vk.com/id446425943
Market performance & recommendations
Equity markets the big performer YTD, but taking a bit more cautious turn in March
Source: Thomson Reuters / Nordea
ASSET ALLOCATION |
|
- |
|
N |
+ |
|
|
Comments |
||||
|
|
|
|
|
|
|
|
|
|
|
||
Equities |
|
|
|
|
|
|
|
|
|
|
||
Fixed Income |
|
|
|
|
|
|
|
|
|
|
||
|
|
|
|
|
|
|
|
|
|
|
|
|
EQUITY REGIONS |
|
- |
|
N |
+ |
|
|
|
||||
|
|
|
|
|
|
|
|
|
|
|
||
North America |
|
|
|
|
|
|
|
|
|
|
||
Europe |
|
|
|
|
|
|
|
|
|
|
||
Japan |
|
|
|
|
|
|
|
|
|
|
||
Emerging Markets |
|
|
|
|
|
|
|
|
|
|
||
Denmark |
|
|
|
|
|
|
|
|
|
|
||
Finland |
|
|
|
|
|
|
|
|
|
|
||
Norway |
|
|
|
|
|
|
|
|
|
|
||
Sweden |
|
|
|
|
|
|
|
|
|
|
||
|
|
|
|
|
|
|
|
|
|
|
|
|
EQUITY SECTORS |
|
- |
|
N |
+ |
|
|
|
||||
|
|
|
|
|
|
|
|
|
|
|
||
Industrials |
|
|
|
|
|
|
|
|
|
|
||
Cons Discretionary |
|
|
|
|
|
|
|
|
|
|
||
Cons Staples |
|
|
|
|
|
|
|
|
|
|
||
Health Care |
|
|
|
|
|
|
|
|
|
|
||
Financials |
|
|
|
|
|
|
|
|
|
|
||
IT |
|
|
|
|
|
|
|
|
|
|
||
Comm. Services |
|
|
|
|
|
|
|
|
|
|
||
Utilities |
|
|
|
|
|
|
|
|
|
|
||
Energy |
|
|
|
|
|
|
|
|
|
|
||
Materials |
|
|
|
|
|
|
|
|
|
|
||
Real Estate |
|
|
|
|
|
|
|
|
|
|
||
|
|
|
|
|
|
|
|
|
|
|
|
|
BOND SEGMENTS |
|
- |
|
N |
+ |
|
|
|
||||
Government |
|
|
|
|
|
|
|
|
|
|
||
|
|
|
|
|
|
|
|
|
|
|||
Investment Grade |
|
|
|
|
|
|
|
|
|
|
||
High Yield |
|
|
|
|
|
|
|
|
|
|
||
Emerging Markets |
|
|
|
|
|
|
|
|
|
|
||
|
|
|
|
|
|
|
|
|
|
|
|
|
|
|
Current allocation |
|
|
|
Previous allocation |
|
|||||
|
|
|
|
|
|
|||||||
|
|
|
|
|
|
|
|
|
|
|
|
|
This material was prepared by Investments |

vk.com/id446425943
Risks to the growth outlook are increasing
Trade and manufacturing sending troubling signals |
|
But the broad outlook remains reasonably solid |
|
|
|
Source: Thomson Reuters / Nordea |
Source: Thomson Reuters / Nordea |
•The risks to the global economic outlook have increased. Although signs of stabilisation have emerged, the macro backdrop remains a key risk.
•Europe should sooner or later turn around by virtue of the current low activity in the manufacturing sector and an expected turnaround in autos.
•Troublingly, however, global trade volumes have declined as uncertainty over both the US-China situation and Brexit has lingered.
This material was prepared by Investments |

vk.com/id446425943
Too early to call a stabilisation in earnings
On the face of it, it looks like the estimates for 2019 has levelled off |
|
And the revisions seems to recover as well |
|
|
|
Source: Thomson Reuters / Nordea |
Source: Thomson Reuters / Nordea |
•While the bad start for earnings seems to have stabilized, we remain healthy sceptics. Down revisions of this size don’t happen without a reason.
•Q1 is already discounted to be a bad quarter, no news there, but the big question is Q2/Q3 given the string of less than good economic data YTD.
•This years gain will need support from the earnings side to be sustainable, and at the moment, we’re still waiting for that support.
vk.com/id446425943
Fed’s dovish pivot: The end (market) or a pause (economists)?
Recently, markets have guided Fed’s expected rate path lower |
|
The end of Q/T might imply shrinking excess reserves |
|
|
|
Source: Thomson Reuters / Nordea |
Source: Thomson Reuters / Nordea |
|
|
|
|
•The Fed catches up with markets and does not expect further rate hikes in 2019. Fixed income markets go further though, pricing in a full cut for 2020.
•Balance sheet contraction (Q/T) will end in Sept. as expected, but the balance sheet will be held constant afterwards, implying falling excess reserves.
•Markets’ assessment is thus hardly “goldilocks”: an end of the Fed hiking cycle is rarely positive for risk assets – shrinking excess reserves neither.

vk.com/id446425943
Brexit: no, no and no, but no hard Brexit please
Brexit or not? Here is where the reaction will most probably come |
|
Brexit has so far not affected UK equities more than European ones |
|
|
|
Source: Thomson Reuters / Nordea |
Source: Thomson Reuters / Nordea |
•The indecision of the UK establishment is monumental. Theresa May’s deal has twice been voted down and presently, it looks dead in the water.
•At the same time, parliament has wrested control from the government to break the gridlock but so far hasn’t been able to reach any conclusion.
•The only consensus seems that no one wants a hard Brexit. However, it doesn’t help much when no other option seems to prevail. Wait and see applies.

vk.com/id446425943
Re-rating continues, and yields keep falling
Higher, but not high, valuation in the wake of the rally |
|
Higher “valuation” also in the bond space; yields have cratered |
|
|
|
Source: Thomson Reuters / Nordea |
Source: Thomson Reuters / Nordea |
•After the massive de-rating in 2018, valuation has bounced back on the rally and falling earnings estimates. In absolute terms, valuation has worsened.
•While not high, equity valuation is hardly attractive with the earnings uncertainty. How much re-rating can markets withstand given the earnings outlook?
•On the bond side, lower yields also means less absolute value. In relative terms however, there has been less of a change between equities and bonds.
This material was prepared by Investments |

vk.com/id446425943
Relapse in sentiment during the month, back at stretched levels
The lows in volatility get higher, more to come? |
|
Being bullish is in vouge again |
|
|
|
Source: Thomson Reuters / Nordea |
Source: Thomson Reuters / Nordea |
•Markets took a step back in the middle of the month, as did sentiment. However, the relapse was short and we’re back at early-March levels.
•We still think the optimism is partly misplaced; real money is not yet buying into rally and the bond market is clearly signaling anything but bullishness.
•Our base case still applies: during the rally all news (also bad) has been good news; should this change, sentiment is a risk at current levels.
This material was prepared by Investments |

vk.com/id446425943
A tale of two markets: Something has to give
Falling rates decoupled from rising equities |
|
Rate cuts and yield curve inversion reflect rising recession risks |
|
|
|
Source: Thomson Reuters / Nordea |
Source: Thomson Reuters / Nordea |
|
•Equities are on track for the strongest 1st quarter start since 1998, closing in on last year’s all-time highs in various indices.
•But the end of the Fed cycle is currently priced and the 3M-10Y US yield curve inverted for the first time since 2007, implying end-cycle recession risks.
•Who’s right – equities (late cycle) or bonds (end-cycle)? If history is any guide, equity investors should watch out. Medium term, it pays to be prudent.

vk.com/id446425943
Global yields: End-cycle fears causes race to the bottom
Core bonds: Hunt for capital preservation instead of hunt for yield
|
0.9 |
|
|
|
|
|
|
|
|
|
|
|
|
|
|
11000000 |
|
|
0.8 |
|
|
|
|
|
|
|
|
|
|
|
|
|
|
10000000 |
|
|
0.7 |
|
|
|
|
|
|
|
|
|
|
|
|
|
|
|
|
|
|
|
|
|
|
|
|
|
|
|
|
|
|
|
|
|
|
|
0.6 |
|
|
|
|
|
|
|
|
|
|
|
|
|
|
9000000 |
million |
% |
0.4 |
|
|
|
|
|
|
|
|
|
|
|
|
|
|
||
|
|
|
|
|
|
|
|
|
|
|
|
|
|
8000000 |
|||
|
0.5 |
|
|
|
|
|
|
|
|
|
|
|
|
|
|
|
|
|
0.3 |
|
|
|
|
|
|
|
|
|
|
|
|
|
|
7000000 |
USD, |
|
|
|
|
|
|
|
|
|
|
|
|
|
|
|
|
||
|
0.2 |
|
|
|
|
|
|
|
|
|
|
|
|
|
|
|
|
|
|
|
|
|
|
|
|
|
|
|
|
|
|
|
|
|
|
|
0.1 |
|
|
|
|
|
|
|
|
|
|
|
|
|
|
6000000 |
|
|
0 |
|
|
|
|
|
|
|
|
|
|
|
|
|
|
|
|
|
26/12/2016 |
26/02/2017 |
26/04/2017 |
26/06/2017 |
26/08/2017 |
26/10/2017 |
26/12/2017 |
26/02/2018 |
26/04/2018 |
26/06/2018 |
26/08/2018 |
26/10/2018 |
26/12/2018 |
26/02/2019 |
|
|
|
|
-0.1 |
5000000 |
|
||||||||||||||
|
|
|
|
|
|
|
|
|
|
|
|
|
|
|
|
 Amount of negative yielding bonds, globally
10Y German government bond yield
Source: Bloomberg/ Macrobond / Nordea
Signs of caution: Lower rated bonds lagging behind the recent rally
Source: Thomson Reuters / Nordea
•As expected, the end of Fed Q/T has not really been an issue for duration: amount of negative-yielding bonds reached highest level since 2017 in March.
•Driver: Dovish central banks caused by rising end-cycle fears. Case in point, credit spreads were roughly sideways in March, reflecting cautious investors.
•Squaring richness in government bonds with elevated macro risks leads us to stay neutral government bonds, with a continued bias towards US duration.

vk.com/id446425943
Lift Europe to overweight and downgrade Japan to underweight
Good returns from all regions this year |
|
Earnings showing signs of stabilisation |
|
|
|
Source: Thomson Reuters / Nordea |
Source: Thomson Reuters / Nordea |
•We recommend upgrading Europe to an overweight as investors have given up on the region while we expect fundamentals to start bottoming out.
•Japan, for its part, is uninspiring on all counts aside from valuation which is more attractive in Europe. Notably, recent money flows do not reflect this.
•The biggest risk to this view is protracted weakness in European manufacturing while the trade war and Brexit could impact both regions to some extent.
This material was prepared by Investments |

vk.com/id446425943
Go slightly defensive in the sector strategy
The industrial cycle under pressure |
|
Raise Consumer Staples and lower Industrials |
||
|
|
|
|
|
|
|
Sector |
Recommendation |
Relative weight |
|
|
|
|
|
|
|
Industrials |
Underweight |
-2% |
|
|
|
|
|
|
|
Consumer Discretionary |
Neutral |
- |
|
|
|
|
|
|
|
Consumer Staples |
Neutral |
- |
|
|
|
|
|
|
|
Health Care |
Overweight |
+2% |
|
|
|
|
|
|
|
Financials |
Neutral |
- |
|
|
|
|
|
|
|
IT |
Neutral |
- |
|
|
|
|
|
|
|
Communication Services |
Neutral |
- |
|
|
|
|
|
|
|
Utilities |
Neutral |
- |
|
|
|
|
|
|
|
Energy |
Neutral |
- |
|
|
|
|
|
|
|
Materials |
Neutral |
- |
|
|
|
|
|
|
|
Real Estate |
Neutral |
- |
|
|
|
|
|
•We take a slightly more defensive stance in the sector strategy by lowering industrials to underweight and raising Consumer Staples to neutral weight.
•Despite the fact that yields have come down, there is still a case for Consumer Staples as the fundamentals looks better relative to other sectors.
•Industrials are lowered as a play on a further short term risk of weakness in the industrial cycle with also investment activity stagnating lately.
This material was prepared by Investments |

vk.com/id446425943 |
April 2019 |
OVERWEIGHT EUROPE, UNDERWEIGHT JAPAN
• We recommend upgrading Europe to an overweight as investors have given up on the region while we expect fundamentals to start picking up.
• Japan, for its part, is uninspiring on all counts aside from valuation which is more attractive in Europe. Notably, recent money flows do not reflect this.
• The biggest risk to this view is protracted weakness in European manufacturing while the trade war and Brexit will impact both regions to an extent.
The long rally has been particularly strong in North America
EQUITIES
NEUTRAL
Source: Thomson Reuters / Nordea
This material was prepared by Investments |

vk.com/id446425943
Equity regions │ Returns (in SEK)
TAA |
|
SAA |
EXCESS |
Total return |
115% |
97,8% |
17,2% |
Ann. Return |
8,0% |
7,1% |
0,9% |
This material was prepared by Investments |
vk.com/id446425943
Equity regions │ April 2019
USA Neutral
Recommended weight |
40% |
Neutral weight |
40% |
-Earnings outlook is deteriorating rapidly
-Valuation is the least attractive among equity regions
-Extended dollar positioning is the key near-term risk
Europe Overweight
Recommended weight |
30% |
Neutral weight |
25% |
-Too much political noise and economic weakness already priced in, and valuation is the most attractive among regions
-Monetary conditions remain supportive
-Economic and earnings outlook likely to start picking up soon
Sweden Neutral
Recommended weight |
15% |
Neutral weight |
15% |
-Industrial sector facing some headwinds from the slump outside the US
-Earnings still healthy, no signs (yet) of trade-related issues
-Economy on a slowing path but level still decent. Higher rates would be a negative
Emerging Markets Neutral
Recommended weight |
15% |
Neutral weight |
15% |
-Earnings outlook is weakening together with the rest of the world
-Slower economic and trade growth are concerning, but supporting policies from China will help
-Valuation no longer a clear support
Asia excl. Japan
Recommended weight |
10% |
Eastern Europe |
|
Recommended weight |
2% |
Latin America |
|
Recommended weight |
3% |
Japan Underweight
Recommended weight |
0% |
Neutral weight |
5% |
-Earnings outlook worse than elsewhere, and support from the economy is elusive
-Valuation is attractive and monetary policy supportive
-The link between yen and equity markets means more muted return prospects
This material was prepared by Investments |

vk.com/id446425943
USA │ Clouds gathering around the outlook
US earnings outlook deteriorating rapidly… |
|
…and valuation is extended in comparison |
|
|
|
Source: Thomson Reuters / Nordea |
Source: Thomson Reuters / Nordea |
•Last year’s support from strong earnings and economic growth is fading rapidly. A particular concern is the deterioration in the heavyweight sector, IT.
•Valuation remains stretched compared to peers, putting added pressure on the US in a wobbly market.
•Trade war will weigh on all equity regions, but the US is likely to lose the least if things deteriorate. Put together, we prefer a neutral weight.
This material was prepared by Investments |
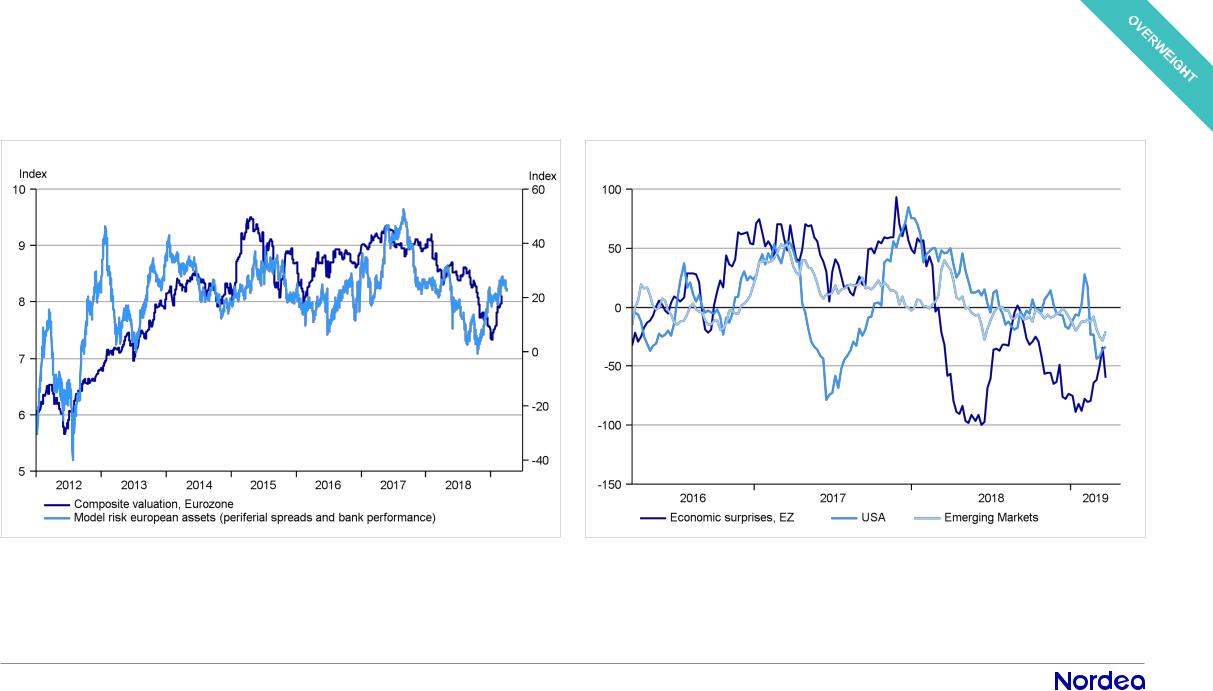
vk.com/id446425943
Europe │ Raise to overweight – a contrarian buy on over-pessimism
Positioning still seems stretched but less that earlier |
|
Surprises are looking less negative compared to other regions |
|
|
|
Source: Thomson Reuters / Nordea |
Source: Thomson Reuters / Nordea |
•We recommend raising Europe to overweight based on over-pessimistic analysts and increasing risk-appetite (less political risk) in our models.
•Drivers: Prospects of a stabilization in leading indicators (even some seems to undershoot), stable earnings estimates will tempt investors.
•It goes without saying that we do not expect a “no-deal” Brexit which would meaningfully affect investors sentiment towards European assets.
This material was prepared by Investments |

vk.com/id446425943
Emerging Markets │ Weaker Chinese cycle will weigh on EM earnings
Chinese slowdown add pressure on already weakening EM exports |
|
Brazilian equities are pricing in too much economic improvement |
|
|
|
Source: Thomson Reuters / Nordea |
Source: Thomson Reuters / Nordea |
•EM earnings are highly correlated with EM exports. Both should come under increased pressure with the weakening Chinese import cycle.
•US-China trade deal remains an upside risk, but any sentiment boost should be short-lived. The global trade slowdown is not caused by the trade conflict.
•Driven by Bolsonaro optimism, Brazilian equities have made a classic overshoot relative to economic fundamentals. Don’t overstay your welcome.
This material was prepared by Investments |

vk.com/id446425943
Finland │ Good value and earnings mean great prospects
Finnish earnings set to outpace peers… |
|
…and the usual valuation premium is gone |
|
|
|
Source: Thomson Reuters / Nordea |
Source: Thomson Reuters / Nordea |
•We keep the overweight in Finnish equities on the back of a good earnings outlook, great dividends and attractive relative valuations.
•Finnish stocks got more than their share in the Q4 sell-off, priming them for a rebound. However, some of this has already taken place.
•Although there is a risk that analysts have not fully appreciated the impact of the global slowdown, this risk is no more pronounced than in Europe.
This material was prepared by Investments |

vk.com/id446425943
Denmark│ Tactical outlook balanced, but more positive given the sector composition
A stronger dollar tends to support Danish companies earnings |
|
Despite fluctuations the relationship holds up well |
|
||
|
|
|
Source: Thomson Reuters / Nordea |
Source: Thomson Reuters / Nordea |
•Danish stocks have continued to catch up during March with defensives now again leading and earnings revisions favor DK stocks.
•Latest earnings season prospects seems marginally better than global earnings picture for DK stocks, but the overweight in industrials is a headwind.
•Valuation remains a headwind but given shifts in FX and the heavy weight of health care in the index is positive. We remain neutral with a positive tilt.
This material was prepared by Investments |
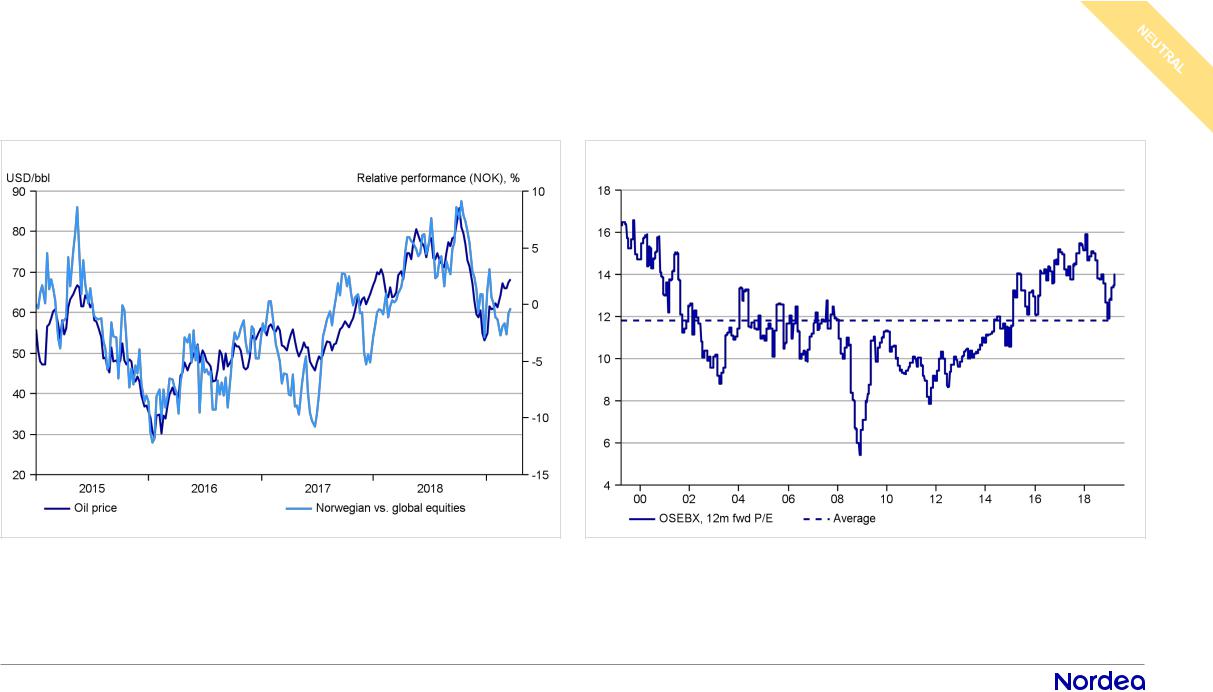
vk.com/id446425943
Norway │ Solid growth, but mixed outlook for oil
Violent turn in oil prices, outlook is mixed |
|
Norwegian equites are getting more expensive |
|
|
|
Source: Thomson Reuters / Nordea |
Source: Thomson Reuters / Nordea |
•Oil prices has been a tailwind so far this year, but the structural outlook is mixed, which means the support could easily turn again.
•The outlook for the Norwegian economy is solid and will support strong expected earnings growth, however a lot is already priced.
•We don’t expect support from weaker NOK, also due to the more hawkish central bank. In sum, a balanced outlook for Oslo Børs, we remain neutral.
This material was prepared by Investments |

vk.com/id446425943
Sweden │Industrial cycle still warrants some caution
Industrials-heavy Sweden is dependent on the global momentum |
|
Swedish equities lagging behind global |
|
|
|
Source: Thomson Reuters / Nordea |
Source: Thomson Reuters / Nordea |
•As previously flagged for, the EZ manufacturing slump and weaker Chinese data has weighed on the industrial cycle.
•The recent bounce in Swedish industrials appears premature given the worsening Chinese industrial cycle, stay neutral.
•The Swedish economy is doing well, but the housing sector remains a risk, and could continue to weigh on the large banking sector.

vk.com/id446425943
Japan │ Better value is to be had elsewhere, lower to underweight
Clear underperformance in Japan, which we believe will continue |
|
Earnings are lagging the rest of the world |
|
|
|
Source: Thomson Reuters / Nordea |
Source: Thomson Reuters / Nordea |
•We lower Japan to underweight on weaker relative potential. Simply put, Japan continues to be an uninspiring story from an investment perspective.
•The earnings outlook is dismal and estimates points towards negative earnings growth this year. Margins are also well below the other regions.
•Valuation is low but not a positive given the earnings picture, and foreign investors are leaving Japan. We think the money is better deployed elsewhere.

vk.com/id446425943
Sectors│ Returns (in SEK)
EXCESS
vk.com/id446425943
Industrials│ Industrial cycle remains under pressure
Trade hopes and risk-on sentiment buoy industrials… |
|
…but global manufacturing woes are not over |
|
|
|
Source: Thomson Reuters / Nordea |
Source: Thomson Reuters / Nordea |
•The risk-on sentiment, spurred by a dovish Fed and hopes of a trade deal have, has triggered a comeback for industrials.
•Our view is that the trade conflict has played a very limited role in the global slowdown, which is why we choose to fade the partly trade driven rally.
•As evident from recent Eurozone PMIs, global manufacturing woes are not over. Signs of acceleration in China also remain limited. UW industrials.

vk.com/id446425943
Consumer Discretionary │ Idiosyncratic factors distorts the tactical call
Consumer Discretionary has done ok in 2018 |
|
US consumer might experience some downside |
|
|
|
Source: Thomson Reuters / Nordea |
Source: Thomson Reuters / Nordea |
•Consumer Discretionary is torn between the waning brick-and-mortar business and the booming online retail business, making the outlook hard to assess.
•The sector usually performs well in an early-cycle environment which was distorted by the US tax-reform in 2018 – but effects are waning.
•As the cycle matures the labour-intensive part of the sector will struggle while online retailers (e.g. Amazon) might perform.

vk.com/id446425943
Consumer Staples │ Short term upside from rates
Lower rates favors Consumer Staples |
|
Earnings growth for 2019 are close to the 2018 figures |
|
|
|
Source: Thomson Reuters / Nordea |
Source: Thomson Reuters / Nordea |
•The pressure from rates on bond proxies has eased, and the lower rates favors Consumer Staples, and fundamentals look more attractive.
•Structural long term challenges remain in the sector, where especially E-commerce is changing the landscape.
•Earnings have held up well compared the rest of the sectors. Margin pressure from freights costs have abated, although labor cost pressure persist.

vk.com/id446425943
Healthcare │ A good late cycle play
Healthcare typically performs well in late cycles |
|
High drug prices has lead to pollical pressure |
|
|
|
Source: Thomson Reuters / Nordea |
Source: Thomson Reuters / Nordea |
•Major M&A activity in the sector as a series of deals involving big pharma acquiring cheap biotech companies sparked off lately over the Christmas.
•Renewed focus from Trump on curbing prices, but so far the pressure is on the middlemen instead of big pharma.
•Fundamentals are still strong and Healthcare is typically a good late cycle sector.

vk.com/id446425943
Financials │ Cheap, but growth limits the upside
Flat US curve compress interest rate margins |
|
Weak ec. momentum and loan growth weights on European financials |
|
|
|
Source: Thomson Reuters / Nordea |
Source: Thomson Reuters / Nordea |
•Financials has underperformed the market YTD but are still very cheap versus history. The banking sector is split between US and EU banks.
•European banks struggle with several things, among this weaker macro momentum and political uncertainty.
•European risks and regulation are a headwind, while US deregulation provides a tailwind. Put together, we recommend neutral.

vk.com/id446425943
IT │ Earnings outlook is weak
Companies expect strong growth in investments |
|
Extremely strong earnings growth |
|
|
|
Source: Thomson Reuters / Nordea |
Source: Thomson Reuters / Nordea |
•IT has reclaimed lost ground in the recent rally, despite semi-cycle weakness and previous China cycle warnings from behemoths Apple and Samsung.
•The cyclical outlook has deteriorated, though both consumption, capex and the structural outlook (digitalization) supports the sector.
•Protectionism and trade war are obvious risks, and the risk/reward is no longer there for an overweight. We stick to a neutral weight.

vk.com/id446425943
Communications Services│ Estimated earnings are holding up
Stocks moved from IT & Consumer Discretionary into Telecom |
|
Biggest names in the new sector |
|
|
|
Source: Thomson Reuters / Nordea |
Source: Thomson Reuters / Nordea |
|
•Earnings estimates has fared much better for the communication sector than for the rest of the cyclicals, and that is a support.
•The new sector includes companies that facilitate “communication & offer related” content and information through media.
•Housing a majority of the FAANGs and their Chinese counterparts, the concentration of higher valued names poses a risk in a shakier environment.

vk.com/id446425943
Utilities │Stable earnings outlook
Less pressure from higher yields |
|
Better earnings outlook for Utilities |
|
|
|
Source: Thomson Reuters / Nordea |
Source: Thomson Reuters / Nordea |
•There is signs of overcapacity in the USA, which is not good for pricing power in the sector. We are also running at low levels of capacity utilization.
•Earnings revisions have turned positive, and the growth outlook for next year is improving.
•Utilities is highly levered and pay high dividends. If rates go higher it could hurt Utilities through higher costs, but this pressure has recently dropped.

vk.com/id446425943
Energy │ Risks are high
The falling oil price is taking its toll on earnings |
|
Booming US shale production |
|
|
|
Source: Thomson Reuters / Nordea |
Source: Thomson Reuters / Nordea |
•Positive output surprise, US waivers for Iranian oil importers and technical headwind led to a bear market in oil, but has rebounded 30% since the bottom.
•Structurally, the outlook is mixed due to the battle between the rise in shale production vs. underinvestment in traditional oil (depletion of traditional wells).
•Earnings estimates has been slashed, despite the recent uptick in oil prices, the risk is high and we stick to a neutral weight on the sector.

vk.com/id446425943
Materials │ Chinese cycle risk still weighs
The recent jump in industrial metals has lent support |
|
Earnings tend to outperform towards the end of the cycle |
|
|
|
Source: Thomson Reuters / Nordea |
Source: Thomson Reuters / Nordea |
•Materials tend to perform well towards the end of the cycle, but as the dominant player within most metals markets, China is a risk for the outlook.
•Despite recent rebound, China-worries continues to haunt the sector. Going forward, Chinese easing could provide a boost, but we wait for the evidence.
•Valuation is relatively attractive, but estimated earnings are being slashed, so we do not think valuation will be in the driver’s seat for now.
vk.com/id446425943
Real Estate │Strong fundamentals but limited upside from yield
Tight relationship with rates |
|
Tight labour markets supports earnings in the sector |
|
|
|
Source: Thomson Reuters / Nordea |
Source: Thomson Reuters / Nordea |
•The real estate sector has experienced strong performance since end of 2018 in the backdrop of the correction, risk off moves and importantly lower rates.
•Where as strong economic momentum in the US and tight labour makets support the sector the strong relationship with rates are expected to hold.
•Since we don’t see significant evidence for significant lower rates from here then the combination of strong fundamentals warrants a neutral position.

vk.com/id446425943 |
April 2019 |
Fed shelves rate hikes for 2019
• Government yields decreased considerably in March. We recommend neutral allocation between the fixed income segments.
• Moderating global growth has made central banks to turn towards more cautious monetary policy, which has pushed yields lower.
German 10-year yield touches negative again
FIXED INCOME
NEUTRAL
Source: Thomson Reuters / Nordea
This material was prepared by Investments |

vk.com/id446425943
Fixed income markets │ April 2019
Corporate bonds Neutral
-Decent economic growth and solid balance sheets still support corporate bonds and issuer credit metrics.
-Government yields have decreased and central banks have shifted towards easier, which means less headwind for corporate bonds. We favour US bonds over European ones.
-Returns from corporate bonds will remain low, but they offer stability to the portfolio.
High-yield bonds Neutral
-High-yield bonds credit metrics are still supported by good level of corporate earnings and low financing costs. Default rates are expected to higher later this year, but the level is still low.
-Moderating growth and tighter financial conditions could cause challenges for high-yield a bit longer term. Currently, however, moderate central banks provide support also for high-yield bonds.
Cash Neutral
-Negative euribor rates mean that return is still basically zero for cash
-Cash provides liquidity to the overall portfolio and it also has an opportunistic role if attractive investment opportunities open up in the markets
Emerging market bonds Neutral
-A dovish turn from the Fed and better FX performance has been supportive for EM bonds this year.
-However, with deteriorating global growth momentum, it is challenging for EM bonds to outperform.
-We estimate risks regarding EM bonds as balanced, and we keep a neutral weight.
Government bonds Neutral
-Government bonds have shown good returns this year, as more dovish central banks have made the environment more duration friendly.
-However, return prospect going forward is modest due to already very low yield.
-Government bonds provide diversification and stability to the overall portfolio
This material was prepared by Investments |

vk.com/id446425943
EUR IG │ Continued low yields
Lower yields as government yields dive |
|
Lower yields has helped performance greatly in 2019 |
|
|
|
Source: Thomson Reuters / Nordea |
Source: Thomson Reuters / Nordea |
•Slowing economic growth leaves limited upside pressure in government yields. Combined with healthy corporate balance sheets this limits investment risk.
•After widening considerably last year, corporate bond credit spreads have recovered this year due to a more dovish central banks.
•Return prospect from investment grade credits will remain low, as spreads are tight in a historic context. Corporate bonds offer stability for the portfolio.
This material was prepared by Investments |

vk.com/id446425943
US IG │Environment is more duration friendly
Fed turning more dovish has increased appetite for duration |
|
Currency-hedge eats most of the yield in US IG |
|
|
|
Source: Thomson Reuters / Nordea |
Source: Thomson Reuters / Nordea |
•Corporate credit fundamentals are still decent in the US. Economic growth is decelerating, but still relatively strong.
•Major central banks indicating a pause in monetary tightening supports IG performance prospects in general, although we expect returns to be low.
•We favour US investment grade credits over Eurozone, as the longer US duration appears attractive compared to European.
This material was prepared by Investments |

vk.com/id446425943
High-Yield │ Credit fundamentals still adequate
Yield and spread have declined with a help of central banks |
|
Forecasts point towards higher, but still modest default rates |
|
|
|
Source: Thomson Reuters / Nordea |
Source: Thomson Reuters / Nordea |
•High-yield credit spreads have tightened rapidly this year, after experiencing a spike in credit spreads in December due to tightening of financial conditions.
•Moderating global growth and tighter financial conditions weigh on high-yield outlook in the longer time horizon.
•High-yield issuer credit metrics are still adequate. Default estimates rose in February, but still point towards below historic ratios.
This material was prepared by Investments |

vk.com/id446425943
EM bonds │Positive momentum, but challenging environment
Valuation not as compelling anymore |
|
Growth environment is challenging for EM bonds |
|
|
|
Source: Thomson Reuters / Nordea |
Source: Thomson Reuters / Nordea |
•A dovish turn from the Fed and better FX performance has supported EM bonds further this year, after showing resilience through end of last year.
•But, global growth indicators are decelerating, positioning is getting more stretched, and valuation is not as compelling anymore.
•Easier financial conditions are supportive, but the growth environment is challenging for EM bonds to outperform. Keep neutral weight.
This material was prepared by Investments |

vk.com/id446425943
Nordea Global Asset Allocation Strategy Contributors
Global Investment Strategy |
Strategists |
|
Committee (GISC) |
Andreas Østerheden |
|
|
||
|
Senior Strategist |
|
|
Andreas.osterheden@nordea.com |
|
Michael Livijn |
Denmark |
|
Chief Investment Strategist |
|
|
michael.livijn@nordea.com |
Sebastian Källman |
|
Sweden |
Strategist |
|
|
||
Antti Saari |
sebastian.kallman@nordea.com |
|
Sweden |
||
Chief Investment Strategist |
||
|
||
antti.saari@nordea.com |
Ville Korhonen |
|
Finland |
||
Fixed Income Strategist |
||
|
||
Witold Bahrke |
ville.p.korhonen@nordea.com |
|
Finland |
||
Chief Investment Strategist |
||
|
||
witold.bahrke@nordea.com |
Espen R. Werenskjold |
|
Denmark |
Senior Strategist |
|
|
espen.werenskjold@nordea.com |
|
Sigrid Wilter Slørstad |
Norway |
|
Chief Investment Strategist (acting) |
|
|
sigrid.wilter.slorstad@nordea.com |
|
|
Norway |
|
Assistants
Victor Karlshoj Julegaard
Assistant/Student
Victor.julegaard@nordea.com
Denmark
Mick Biehl
Assistant/Student
Mick.Biehl@nordea.com
Denmark
Amelia Marie Asp
Assistant/Student
Amelia.Marie.Asp@nordea.com
Denmark
Frederik Saul
Assistant/Student
Frederik.Saul@nordea.com
Denmark
This material was prepared by Investments |

vk.com/id446425943
DISCLAIMER
Nordea Investment Center gives advice to private customers and small and medium-sized companies in Nordea regarding investment strategy and concrete generic investment proposals. The advice includes allocation of the customers’ assets as well as concrete investments in national, Nordic and international equities and bonds and in similar securities. To provide the best possible advice we have gathered all our competences within analysis and strategy in one unit - Nordea Investment Center (hereafter “IC”).
This publication or report originates from: Nordea Bank Abp, Nordea Bank Abp, filial i Sverige, Nordea Bank Abp, filial i Norge and Nordea Danmark, Filial af Nordea Bank Abp, Finland (together the “Group Companies”), acting through their unit Nordea IC. Nordea units are supervised by the Finnish Financial Supervisory Authority (Finanssivalvonta) and each Nordea unit’s national financial supervisory authority.
The publication or report is intended only to provide general and preliminary information to investors and shall not be construed as the sole basis for an investment decision. This publication or report has been prepared by IC as general information for private use of investors to whom the publication or report has been distributed, but it is not intended as a personal recommendation of particular financial instruments or strategies and thus it does not provide individually tailored investment advice, and does not take into account your particular financial situation, existing holdings or liabilities, investment knowledge and experience, investment objective and horizon or risk profile and preferences. The investor must particularly ensure the suitability of his/her investment as regards his/her financial and fiscal situation and investment objectives. The investor bears all the risks of losses in connection with an investment.
Before acting on any information in this publication or report, it is recommendable to consult one’s financial advisor. The information contained in this report does not constitute advice on the tax consequences of making any particular investment decision. Each investor shall make his/her own appraisal of the tax and other financial advantages and disadvantages of his/her investment.
This material was prepared by Investments |

vk.com/id446425943
Ansvarsreservation
This material was prepared by Investments |