


vk.com/id446425943
INTERNATIONAL ENERGY AGENCY - OIL MARKET REPORT SUPPLY
SUPPLY
Summary
A second month of OPEC and non-OPEC (OPEC+) supply cuts, further losses in Venezuela and Canada and a seasonal drop in biofuels knocked 340 kb/d off global oil production in February. OPEC led the decline, with crude oil output dropping 240 kb/d month-on-month (m-o-m) to 30.68 mb/d, down 1.1 mb/d on a
year ago. However, total liquids supply of 99.7 mb/d was |
|
|
|
|
still up 1.5 mb/d on a year ago thanks to a strong |
mb/d |
OPEC and Non-OPEC Oil Supply |
||
performance by non-OPEC countries, led by the US. |
||||
4.0 |
|
Year-on-Year Change |
||
|
|
|
||
In 2018, the US contributed 79% of the 2.8 mb/d of non-OPEC growth. The relentless pace continues into 2019, when US supply is expected to expand by 1.5 mb/d and account for 83% of non-OPEC growth of 1.8 mb/d. Record production in the latter part of last year in the US, Saudi Arabia, Russia and Iraq contributed to a substantial build in inventories. This led OPEC, Russia and nine other non-OPEC countries to agree to cut production by 1.2 mb/d from January to June.
OPEC / Non-OPEC Output1
|
OPEC Crude |
|
|
Non-OPEC |
|
|
|||
|
|
|||
|
OPEC NGLs |
|
|
Total Supply |
|
|
|
(million barrels per day)
|
|
|
Supply |
|
|
February |
Sustainable |
Spare |
|
Jan 2019 |
Feb 2019 |
Agreed Cut |
New Target |
Production |
Capacity vs |
||
|
Baseline2 |
Compliance |
||||||
|
|
|
5 |
6 |
||||
|
Supply |
Supply |
|
|
|
|
Capacity |
Feb Supply |
|
|
|
|
|
|
|
|
|
Algeria |
1.03 |
1.03 |
1.06 |
0.032 |
1.03 |
84% |
1.05 |
0.02 |
Angola |
1.46 |
1.47 |
1.53 |
0.047 |
1.48 |
123% |
1.50 |
0.03 |
Congo |
0.33 |
0.34 |
0.33 |
0.010 |
0.32 |
-150% |
0.35 |
0.01 |
Ecuador |
0.52 |
0.52 |
0.52 |
0.016 |
0.51 |
25% |
0.54 |
0.02 |
Equatorial Guinea |
0.11 |
0.12 |
0.13 |
0.004 |
0.12 |
175% |
0.12 |
0.00 |
Gabon |
0.20 |
0.21 |
0.19 |
0.006 |
0.18 |
-383% |
0.20 |
-0.01 |
Iraq |
4.75 |
4.68 |
4.65 |
0.141 |
4.51 |
-19% |
4.90 |
0.22 |
Kuw ait |
2.72 |
2.70 |
2.81 |
0.085 |
2.72 |
128% |
2.93 |
0.23 |
Nigeria3 |
1.64 |
1.64 |
1.65 |
0.053 |
1.60 |
19% |
1.72 |
0.08 |
Saudi Arabia |
10.24 |
10.14 |
10.63 |
0.322 |
10.31 |
153% |
12.02 |
1.88 |
UAE |
3.07 |
3.05 |
3.17 |
0.096 |
3.07 |
123% |
3.39 |
0.34 |
Total OPEC 11 |
26.07 |
25.90 |
26.66 |
0.812 |
25.85 |
94% |
|
|
Iran4 |
2.72 |
2.74 |
|
|
|
|
3.85 |
- |
Libya4 |
0.89 |
0.90 |
|
|
|
|
0.90 |
0.00 |
Venezuela4 |
1.24 |
1.14 |
|
|
|
|
1.14 |
0.00 |
Total OPEC |
30.92 |
30.68 |
|
|
|
|
34.61 |
2.83 |
Azerbaijan |
0.79 |
0.81 |
0.80 |
0.020 |
0.78 |
-49% |
|
|
Bahrain |
0.21 |
0.21 |
0.22 |
0.005 |
0.21 |
108% |
|
|
Brunei |
0.12 |
0.12 |
0.11 |
0.003 |
0.11 |
-117% |
|
|
Kazakhstan |
2.01 |
1.99 |
2.03 |
0.040 |
1.99 |
100% |
|
|
Malaysia |
0.72 |
0.71 |
0.70 |
0.015 |
0.68 |
-71% |
|
|
Mexico |
1.86 |
1.93 |
1.99 |
0.040 |
1.95 |
148% |
|
|
Oman |
0.98 |
0.97 |
1.00 |
0.025 |
0.98 |
137% |
|
|
Russia |
11.71 |
11.67 |
11.75 |
0.230 |
11.52 |
36% |
|
|
Sudan |
0.07 |
0.07 |
0.07 |
0.002 |
0.07 |
89% |
|
|
South Sudan |
0.13 |
0.13 |
0.12 |
0.003 |
0.12 |
-78% |
|
|
Total Non-OPEC |
18.60 |
18.60 |
18.80 |
0.383 |
18.41 |
51% |
|
|
1 |
OPEC figures are crude oil only, Non-OPEC figures are total oil supply (including NGLs). |
4 |
Iran, Libya, Venezuela exempt from cuts |
2 |
Based on Oct-2018 production, except for Azerbaijan and Kuwait based on Sept-2018 |
5 |
Capacity levels can be reached within 90 days and sustained for an extended period |
|
and Kazakhstan Nov-2018. Non-OPEC supply baseline based on IEA estimates |
6 |
Spare capacity excludes Iranian crude supply that is offline due to sanctions. |
3 |
Nigeria supply baseline based on IEA estimates, which exclude Akpo and Agbami condensates. |
|
|
15 MARCH 2019 |
15 |
vk.com/id446425943
SUPPLY INTERNATIONAL ENERGY AGENCY - OIL MARKET REPORT
Thanks to outperformance by Saudi Arabia and its Gulf allies, those cuts are starting to work. In February, OPEC+ production was 240 kb/d above the target of 44.3 mb/d, which delivered a compliance rate of 80%. OPEC’s compliance was a robust 94%, compared to 51% from non-OPEC. Russia continues to adjust
mb/d Med-Heavy Crude Drop (Feb vs Nov) |
|
|
its production gradually. If the producers deliver on their |
|||||||||||||||||||||||
|
|
promises, the market could return to balance in the |
||||||||||||||||||||||||
|
|
|
|
|
|
|
|
|
|
|
|
|
|
|
|
|
|
|
|
|
|
|
|
|||
0.2 |
|
|
|
|
|
|
|
|
|
|
|
|
|
|
|
|
|
|
|
|
|
|
|
second quarter. The call on |
OPEC |
crude rises to |
|
|
|
|
|
|
|
|
|
|
|
|
|
|
|
|
|
|
|
|
|
||||||
-0.2 |
|
|
|
|
|
|
|
|
|
|
|
|
|
|
|
|
|
|
|
|
|
|
|
30.9 mb/d in 2Q19, 200 kb/d |
more |
than the group |
|
|
|
|
|
|
|
|
|
|
|
|
|
|
|
|
|
|
|
|
|
||||||
|
|
|
|
|
|
|
|
|
|
|
|
|
|
|
|
|
|
|
|
|
||||||
-0.6 |
|
|
|
|
|
|
|
|
|
|
|
|
|
|
|
|
|
|
|
|
|
|
|
produced in February. OPEC and its allies are scheduled |
||
|
|
|
|
|
|
|
|
|
|
|
|
|
|
|
|
|
|
|
|
|
|
|
to meet on 17-18 April to review the pact, although |
|||
-1.0 |
|
|
|
|
|
|
|
|
|
|
|
|
|
|
|
|
|
|
|
|
|
|
|
|||
|
|
|
|
|
|
|
|
|
|
|
|
|
|
|
|
|
|
|
|
|
|
|||||
|
|
|
|
|
|
|
|
|
|
|
|
|
|
|
|
|
|
|
|
|
|
|
Saudi Energy Minister Khalid al-Falih has said it would be |
|||
-1.4 |
|
|
|
|
|
|
|
|
|
|
|
|
|
|
|
|
|
|
|
|
|
|
|
|||
-1.8 |
|
|
|
|
|
|
|
|
|
|
|
|
|
|
|
|
|
|
|
|
|
|
|
too early to change policy then. |
|
|
|
|
|
|
|
|
|
|
|
|
|
|
|
|
|
|
|
|
|
|
|
|
|
|
|||
|
|
|
|
|
|
|
|
|
|
|
|
|
|
|
|
|
|
|
|
|
|
|
The OPEC+ deal, US sanctions against Iran and Venezuela |
|||
|
|
|
|
|
|
|
|
|
|
|
|
|
|
|
|
|
|
|
|
|
|
|||||
|
|
|
|
|
|
|
|
|
|
|
|
|
|
|
|
|
|
|
|
|
|
|
|
|||
|
|
|
|
|
|
|
|
|
|
|
|
|
|
|
|
|
|
|
|
|
|
|
|
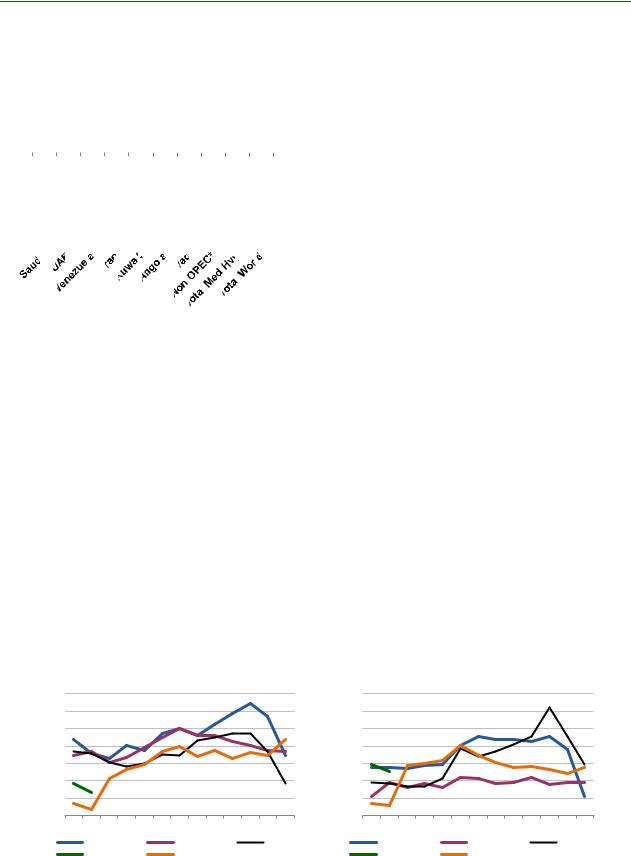
and Alberta’s production cuts have had a major impact |
||
*Canada, Russia, Oman, Mexico, Brazil |
|
|
on the supply of medium-heavy oil. Compared to |
|||||||||||||||||||||||
|
|
|
|
|
|
|
|
|
|
|
|
|
|
|
|
|
|
|
|
|
|
|
|
November, when Saudi Arabia, Russia and Iraq were |
||
pumping at or near record rates, supply of these grades has fallen by nearly 1.5 mb/d (see Prices and Refining sections). That is 90% of the overall reduction in global crude supply since November. In March, medium-heavy output is likely to fall further with Venezuela’s oil sector hit hard by power outages on top of US sanctions and if Saudi Arabia delivers on planned reductions.
OPEC crude oil supply
Losses in Venezuela and lower output from Saudi Arabia and Iraq cut OPEC crude production in February by 240 kb/d m-o-m to 30.68 mb/d, its lowest in four years. March output could be lower still with Venezuela’s oil sector crippled by a massive power outage and if Saudi Arabia follows through on announced supply cuts. During February, lower crude output raised OPEC’s effective spare capacity to 2.83 mb/d.
Demonstrating its resolve to remove excess oil from the market, Saudi Arabia pumped 170 kb/d below its OPEC+ supply target in February. Overall compliance from the OPEC members taking part was a robust 94%, with Kuwait and the UAE joining Saudi Arabia in cutting back by more than required. Iraq made little effort to reduce production. The three countries exempt from cuts – Venezuela, Libya and Iran – have racked up losses of 600 kb/d since November.
mb/d |
OPEC Crude Supply |
|
mb/d |
Saudi Arabia Crude Supply |
|||
33.5 |
|
|
|
11.25 |
|
|
|
33.0 |
|
|
|
11.00 |
|
|
|
32.5 |
|
|
|
10.75 |
|
|
|
32.0 |
|
|
|
10.50 |
|
|
|
31.5 |
|
|
|
10.25 |
|
|
|
31.0 |
|
|
|
10.00 |
|
|
|
30.5 |
|
|
|
9.75 |
|
|
|
30.0 |
|
|
|
9.50 |
|
|
|
Jan |
Mar May |
Jul Sep |
Nov Jan |
Jan |
Mar May |
Jul Sep |
Nov Jan |
|
2016 |
2017 |
2018 |
2016 |
2017 |
2018 |
|
|
2019 |
2015 |
|
2019 |
2015 |
|
|
Saudi Arabia has throttled back 920 kb/d from its record high November production. In February, output was down for the third successive month, this time by 100 kb/d m-o-m to 10.14 mb/d. Energy Minister Khalid al-Falih has said crude output in March will drop to 9.8 mb/d, 510 kb/d below the Kingdom’s supply target, and could remain at around that level in April.
16 |
15 MARCH 2019 |

vk.com/id446425943
INTERNATIONAL ENERGY AGENCY - OIL MARKET REPORT SUPPLY
In February, exports of crude oil fell by 210 kb/d to 7.15 mb/d, according to Kpler data. In March, Saudi Aramco plans to export less than 7 mb/d, down from roughly 7.7 mb/d in 4Q18. Minister al-Falih was quoted as saying that Saudi Arabia “could have pushed barrels onto the international market but the Kingdom is driven by the bigger objective - and that bigger objective is to bring inventories down”.
Elsewhere in the Gulf, the UAE and Kuwait trimmed supply. Output in the UAE edged down 20 kb/d m-o-m to 3.05 mb/d, yet was up 250 kb/d on a year ago. Kuwaiti production inched down to 2.7 mb/d.
Production in Iraq, including the Kurdistan Regional Government (KRG), fell by 70 kb/d in February to 4.68 mb/d - well above its OPEC+ supply target. During the last round of cuts, Baghdad cut production by less than 50% of its commitment.
mb/d Iraq Production and Exports
5.0
4.0
3.0
2.0
Iraq has clearly stated its capacity building aims. By the tail end of last year, it was producing at 4.77 mb/d, its highest ever level, as oil fields in the south ramped up. Oil output from the Halfaya field is due to rise by about 50 kb/d and hit its target level of 400 kb/d in March.
1.0
0.0Jun-17 Oct-17 Feb-18 Jun-18 Oct-18 Feb-19
|
|
Basra Exports |
|
Northern Exports |
|
|
|||
|
|
|||
|
|
Production |
|
|
|
|
|
|
On the export front, overall shipments to world markets were down around 110 kb/d to 3.96 mb/d. The lion’s share of Iraq's crude is shipped via its southern ports. As for the north, exports in February slowed after flows via the KRG-controlled pipeline system to Ceyhan were cut by maintenance along the Iraq-Turkey pipeline.
Output from Iran edged up to 2.74 mb/d in February, but was down 1.1 mb/d compared to when US sanctions were announced in May. Production so far this year is running at the lowest level since late 2013, during the previous round of sanctions. As for exports, total shipments of crude and condensates rose 90 kb/d m-o-m to 1.4 mb/d in February. Exports of crude oil edged up to nearly 1.1 mb/d, according to tanker tracking data, with condensates making up the remainder.
mb/d |
Iranian Crude Production |
4.0 |
|
|
|
|
|
3.6 |
|
|
|
|
|
3.2 |
|
|
|
|
|
2.8 |
|
|
|
|
|
2.4 |
|
Sanctions (2012-15) |
|
|
|
|
|
|
|
||
2.0 |
|
|
|
|
|
2009 |
2011 |
2013 |
2015 |
2017 |
2019 |
|
mb/d |
|
|
|
|
|
|
Iranian Oil Exports |
|
|
|
|
|
|
|
||||||||||||||||||||||||||||||||||
3.0 |
|
|
|
|
|
|
|
|
|
|
|
|
|
|
|
|
|
|
|
|
|
|
|
|
|
|
|
|
|
|
|
|
|
|
|
|
|
|
|
|
|
|
|
|
|
|
|
|
|
|
|
|
|
|
|
|
|
|
|
|
|
|
|
|
|
|
|
|
|
|
|
|
|
|
|
|
|
|
|
|
|
|
|
|
|
|
|
|
|
|
|
|
|
|
|
|
|||
2.5 |
|
|
|
|
|
|
|
|
|
|
|
|
|
|
|
|
|
|
|
|
|
|
|
|
|
|
|
|
|
|
|
|
|
|
|
|
|
|
|
|
|
|
|
|
|
|
|
|
|
|
|
|
|
|
|
|
|
|
|
|
|
|
|
|
|
|
|
|
|
|
|
|
|
|
|
|
|
|
|
|
|
|
|
|
Source: Kpler |
||||||||||||||
2.0 |
|
|
|
|
|
|
|
|
|
|
|
|
|
|
|
|
|
|
|
|
|
|
|
|
|
|
|
|
|
|
|
|
|
|
|
|
|
||||||||||||
|
|
|
|
|
|
|
|
|
|
|
|
|
|
|
|
|
|
|
|
|
|
|
|
|
|
|
|
|
|
|
|
|
|
|
|
|
|
|
|
|
|
|
|
|
|
|
|
||
|
|
|
|
|
|
|
|
|
|
|
|
|
|
|
|
|
|
|
|
|
|
|
|
|
|
|
|
|
|
|
|
|
|
|
|
|
|
|
|
|
|
|
|
|
|
||||
1.5 |
|
|
|
|
|
|
|
|
|
|
|
|
|
|
|
|
|
|
|
|
|
|
|
|
|
|
|
|
|
|
|
|
|
|
|
|
|
|
|
|
|
|
|
|
|
|
|
|
|
|
|
|
|
|
|
|
|
|
|
|
|
|
|
|
|
|
|
|
|
|
|
|
|
|
|
|
|
|
|
|
|
|
|
|
|
|
|
|
|
|
|
|
|
|
|
||||
1.0 |
|
|
|
|
|
|
|
|
|
|
|
|
|
|
|
|
|
|
|
|
|
|
|
|
|
|
|
|
|
|
|
|
|
|
|
|
|
|
|
|
|
|
|
|
|
|
|
|
|
|
|
|
|
|
|
|
|
|
|
|
|
|
|
|
|
|
|
|
|
|
|
|
|
|
|
|
|
|
|
|
|
|
|
|
|
|
|
|
|
|
|
|
|
|
|
||||
0.5 |
|
|
|
|
|
|
|
|
|
|
|
|
|
|
|
|
|
|
|
|
|
|
|
|
|
|
|
|
|
|
|
|
|
|
|
|
|
|
|
|
|
|
|
|
|
|
|
|
|
|
|
|
|
|
|
|
|
|
|
|
|
|
|
|
|
|
|
|
|
|
|
|
|
|
|
|
|
|
|
|
|
|
|
|
|
|
|
|
|
|
|
|
|
|
|
||||
0.0 |
|
|
|
|
|
|
|
|
|
|
|
|
|
|
|
|
|
|
|
|
|
|
|
|
|
|
|
|
|
|
|
|
|
|
|
|
|
|
|
|
|
|
|
|
|
|
|
|
|
|
|
|
|
|
|
|
|
|
|
|
|
|
|
|
|
|
|
|
|
|
|
|
|
|
|
|
|
|
|
|
|
|
|
|
|
|
|
|
|
|
|
|
|
|
|
|
|
||
|
Jun-17 |
|
|
|
|
Nov-17 |
|
|
|
Apr-18 |
Sep-18 |
|
Feb-19 |
||||||||||||||||||||||||||||||||||||
|
China |
|
|
India |
|
Japan |
|
Europe |
|
|
Korea |
|
|
|
Other |
||||||||||||||||||||||||||||||||||
|
|
|
|
|
|
|
|
|
|
||||||||||||||||||||||||||||||||||||||||
|
|
|
|
|
|
|
|
|
|
||||||||||||||||||||||||||||||||||||||||
Of the eight countries given waivers by the US to buy Iranian oil, China, India, Japan, Korea and Turkey are, on average, lifting at or slightly above their allowed volumes. Italy and Greece have lifted nothing since November, while Taiwan has not loaded any Iranian barrels since September, Kpler data show.
Libyan crude supply crept up to 900 kb/d in February and looks set to recover in March. The National Oil Corp lifted force majeure at El Sharara in early March after the removal of an armed group that had taken over the oil field in early December. The country’s largest field is currently pumping roughly 180 kb/d, which suggests that overall production could soon push back above 1 mb/d for the first time
15 MARCH 2019 |
17 |

vk.com/id446425943
SUPPLY INTERNATIONAL ENERGY AGENCY - OIL MARKET REPORT
since early December. Crude output recovered in 2018 to a five-year high of 1.15 mb/d, although the oil sector remains vulnerable to security and political challenges.
In Nigeria, output was stable at 1.64 mb/d in February, supported by the early 2019 start of the offshore Egina field. However, a brief disruption in flows through a major pipeline underscores the ongoing risk that militant attacks pose to oil operations. Crude output sank to a three-decade low in 2016, a year after President Muhammadu Buhari came to power. Having won a second term in February, Buhari will have another chance to reform the energy industry. Output from other African producers was broadly steady m-o-m. Supply held at 1.03 mb/d in Algeria and inched up in Angola, Congo, Gabon and
Equatorial Guinea.
Struggling after the imposition of US sanctions in January, Venezuela’s production fell 100 kb/d in February to 1.14 mb/d, down 410 kb/d on a year ago. Deeper declines are likely in March after power
blackouts throughout the country took a further toll on |
mb/d |
Venezuelan Spiral |
|
production and exports. The power outage is an additional |
|||
3.5 |
|
||
challenge for Venezuela, where oil sector operations have |
|
Hugo Chavez Elected |
|
already been set back by chronic under-investment, lack of |
3.0 |
||
|
|||
maintenance and US sanctions. |
2.5 |
|
|
|
|
||
The measures, banning US refiners from buying Venezuelan |
2.0 |
|
|
crude, also disrupted flows of diluent that are needed to |
1.5 |
PDVSA Strike |
|
blend with extra heavy oil from the Orinoco Belt. The US had |
|||
|
|||
been delivering more than 100 kb/d of diluent, but some |
1.0 |
|
|
supplies from Russia reportedly are on the way. Meanwhile, |
1998 |
2001 2005 2008 2012 2015 2019 |
Washington is considering additional measures that could hit
trade of nearly all crude and products. It is also mulling secondary sanctions aimed at crude and product flows between Petroleos de Venezuela (PDVSA) and non-US entities.
Output slumped dramatically in 2018, falling 570 kb/d. However, the deteriorating political situation and further economic and infrastructure damage caused by the power cuts make it difficult to forecast the scale of further declines. Output from Ecuador was unchanged from January at 520 kb/d.
Non-OPEC overview
Following a steep drop of more than 0.5 mb/d in January, non-OPEC oil supply eased by another 100 kb/d last month. Since November’s high, output has fallen by 800 kb/d, with Canada, the United States and global biofuels accounting for most of the decline. Lower output from countries participating in output cuts also contributed. At 63.5 mb/d, output was nevertheless 2.6 mb/d higher than a year ago.
mb/d |
Non-OPEC Total Oil Supply |
mb/d |
Total Non-OPEC Supply, y-o-y Change |
|||||
66 |
|
|
3.5 |
|
|
|
|
|
64 |
|
|
2.5 |
|
|
|
|
|
62 |
|
|
1.5 |
|
|
|
|
|
|
|
|
|
|
|
|
|
|
60 |
|
|
0.5 |
|
|
|
|
|
|
|
|
|
|
|
|
|
|
58 |
|
|
-0.5 |
|
|
|
|
|
56 |
|
|
|
|
|
|
|
|
|
|
|
|
|
|
|
|
|
Jan |
Mar May Jul |
Sep Nov Jan |
-1.5 |
|
|
|
|
|
|
2016 |
2017 |
1Q15 |
1Q16 |
1Q17 |
1Q18 |
1Q19 |
|
|
2018 |
2019 |
|
|
Other |
North America |
Total |
|
|
2019 forecast |
|
|
|
||||
|
|
|
|
|
|
|
|
|
18 |
15 MARCH 2019 |

vk.com/id446425943
INTERNATIONAL ENERGY AGENCY - OIL MARKET REPORT SUPPLY
For the year as a whole, non-OPEC oil supply growth is expected to slow from a record 2.8 mb/d in 2018 to 1.8 mb/d. The US continues to account for the bulk of the expansion, adding 1.5 mb/d, or 83% of the total. Other increases will come from Brazil, where a number of new production units are currently ramping up. Despite renewed output cuts, gains will also come from Russia, with production at the start of 2019 410 kb/d higher than a year ago. In contrast, further declines are expected from Mexico, Norway and China.
Non-OPEC Supply
(million barrels per day)
|
2017 |
1Q18 |
2Q18 |
3Q18 |
4Q18 |
2018 |
1Q19 |
2Q19 |
3Q19 |
4Q19 |
2019 |
|
|
|
|
|
|
|
|
|
|
|
|
Americas |
20.3 |
21.7 |
22.2 |
23.3 |
23.9 |
22.8 |
23.5 |
23.8 |
24.3 |
24.5 |
24.0 |
Europe |
3.5 |
3.6 |
3.4 |
3.3 |
3.5 |
3.5 |
3.5 |
3.4 |
3.4 |
3.5 |
3.5 |
Asia Oceania |
0.4 |
0.4 |
0.4 |
0.4 |
0.4 |
0.4 |
0.5 |
0.5 |
0.5 |
0.5 |
0.5 |
Total OECD |
24.2 |
25.7 |
26.0 |
27.0 |
27.8 |
26.6 |
27.5 |
27.6 |
28.3 |
28.6 |
28.0 |
Former USSR |
14.3 |
14.4 |
14.4 |
14.6 |
14.8 |
14.6 |
14.8 |
14.5 |
14.6 |
14.8 |
14.7 |
Europe |
0.1 |
0.1 |
0.1 |
0.1 |
0.1 |
0.1 |
0.1 |
0.1 |
0.1 |
0.1 |
0.1 |
China |
3.9 |
3.8 |
3.9 |
3.8 |
3.9 |
3.8 |
3.9 |
3.8 |
3.8 |
3.7 |
3.8 |
Other Asia |
3.5 |
3.4 |
3.3 |
3.3 |
3.3 |
3.3 |
3.3 |
3.2 |
3.2 |
3.2 |
3.2 |
Latin America |
4.5 |
4.5 |
4.5 |
4.4 |
4.6 |
4.5 |
4.6 |
4.8 |
5.0 |
5.1 |
4.9 |
Middle East |
3.2 |
3.2 |
3.3 |
3.3 |
3.3 |
3.3 |
3.3 |
3.3 |
3.3 |
3.3 |
3.3 |
Africa |
1.4 |
1.4 |
1.5 |
1.5 |
1.4 |
1.4 |
1.5 |
1.5 |
1.5 |
1.5 |
1.5 |
Total Non-OECD |
30.9 |
30.9 |
31.0 |
31.0 |
31.4 |
31.1 |
31.4 |
31.2 |
31.4 |
31.6 |
31.4 |
Processing Gains |
2.3 |
2.3 |
2.3 |
2.3 |
2.3 |
2.3 |
2.3 |
2.3 |
2.3 |
2.3 |
2.3 |
Global Biofuels |
2.5 |
2.1 |
2.8 |
3.1 |
2.5 |
2.6 |
2.3 |
2.8 |
3.0 |
2.7 |
2.7 |
Total Non-OPEC |
59.9 |
61.1 |
62.1 |
63.4 |
64.1 |
62.7 |
63.6 |
63.9 |
65.0 |
65.2 |
64.4 |
Annual Chg (mb/d) |
0.8 |
1.7 |
2.7 |
3.4 |
3.4 |
2.8 |
2.5 |
1.9 |
1.6 |
1.1 |
1.8 |
Total US oil supply dropped by 140 kb/d in December, to 16.5 mb/d, with both crude oil and NGL production falling. Crude oil output eased by 55 kb/d, to 11.85 kb/d, its first decline in eight months and in stark comparison to November’s 345 kb/d surge. Lower Gulf of Mexico output accounted for most of the drop, sliding 125 kb/d m-o-m. Onshore production growth slowed to 70 kb/d from average monthly growth of almost 170 kb/d during the previous six months. Gains came from Texas (+35 kb/d), North Dakota (+18 kb/d) and New Mexico (+13 kb/d). Following the sharp decline in prices towards the end of last year, US producers have scaled back activity. According to Baker Hughes, the number of active oil rigs has dropped by 51 since the start of the year, so that 834 were operating in early March. December output was nevertheless 1.8 mb/d higher than a year earlier. Crude production is expected to rise by 1.1 mb/d on average this year, compared with gains of 1.6 mb/d in 2018. Total oil output growth slows from 2.2 mb/d to 1.5 mb/d.
mb/d |
United States Total Oil Supply |
Baker Hughes US Oil Rig Count |
||||
18 |
||||||
|
|
900 |
|
|
||
17 |
|
|
850 |
|
|
|
16 |
|
|
|
|
||
|
|
800 |
|
|
||
15 |
|
|
|
|
||
|
|
750 |
|
|
||
14 |
|
|
|
|
||
|
|
700 |
|
|
||
13 |
|
|
|
|
||
|
|
650 |
|
|
||
12 |
|
|
|
|
||
|
|
600 |
|
|
||
11 |
|
|
|
|
||
Jan Mar May Jul |
Sep Nov Jan |
550 |
|
|
||
|
2016 |
2017 |
500 |
|
|
|
|
2018 forecast |
2018 |
|
|
||
|
Jan 17 |
Jan 18 |
Jan 19 |
|||
|
2019 forecast |
|
||||
|
|
|
|
|
||
15 MARCH 2019 |
19 |

vk.com/id446425943
SUPPLY INTERNATIONAL ENERGY AGENCY - OIL MARKET REPORT
Canadian oil output dropped by 235 kb/d in January, as Alberta’s producers complied with mandatory curtailments. Albertan crude and oil sands production fell by 270 kb/d m-o-m, to 3.4 mb/d, with a 295 kb/d drop in raw bitumen partly offset by slightly higher synthetic crude oil output. Offshore output inched up to 250 kb/d, an increase of nearly 70 kb/d from November’s low when several platforms were shut due to bad weather. The White Rose field remained shut due to a spill in November.
mb/d Alberta Crude and Oilsands Supply |
|
kb/d Canadian Crude Oil Exports by Rail |
|||||||||||||||||||||||||||||||||||||||||||||||||||||||||||||||||||||||||
4.0 |
|
|
|
|
|
|
|
|
|
|
|
|
|
|
|
|
|
|
|
|
|
|
|
|
|
|
|
|
|
|
|
|
|
|
|
|
|
|
|
|
|
|
|
|
|
|
|
|
|
400 |
|
|
|
|
|
|
|
|
|
|
|
|
|
|
|
|
|
|
|
|
|
|
|
|
|
|
|
|
|
|
|
|
|
|
|
|
|
|
|
|
|
|
|
|
|
|
|
|
|
|
|
|
|
|
|
|
|
|
|
|
|
|
|
|
|
|
|
|
|
|
|
|
|
|
|
|
|
|
|
|
|
|
|
|
|
|
|
|
|
|
|
|
|
|
|
|
|||||
3.5 |
|
|
|
|
|
|
|
|
|
|
|
|
|
|
|
|
|
|
|
|
|
|
|
|
|
|
|
|
|
|
|
|
|
|
|
|
|
|
|
|
|
|
|
|
|
|
|
|
|
|
|
|
|
|
|
|
|
|
|
|
|
|
|
|
|
|
|
|
|
|
|
|
|
||
|
|
|
|
|
|
|
|
|
|
|
|
|
|
|
|
|
|
|
|
|
|
|
|
|
|
|
|
|
|
|
|
|
|
|
|
|
|
|
|
|
|
|
|
|
|
|
|
|
350 |
|
|
|
|
|
|
|
|
|
|
|
|
|
|
|
|
|
|
|
|
|
|
|
|
||
|
|
|
|
|
|
|
|
|
|
|
|
|
|
|
|
|
|
|
|
|
|
|
|
|
|
|
|
|
|
|
|
|
|
|
|
|
|
|
|
|
|
|
|
|
|
|
|
|
|
|
|
|
|
|
|
|
|
|
|
|
|
|
|
|
|
|
|
|
|
|
|||||
3.0 |
|
|
|
|
|
|
|
|
|
|
|
|
|
|
|
|
|
|
|
|
|
|
|
|
|
|
|
|
|
|
|
|
|
|
|
|
|
|
|
|
|
|
|
|
|
|
|
|
|
|
|
|
|
|
|
|
|
|
|
|
|
|
|
|
|
|
|
|
|
|
|
|
|
||
|
|
|
|
|
|
|
|
|
|
|
|
|
|
|
|
|
|
|
|
|
|
|
|
|
|
|
|
|
|
|
|
|
|
|
|
|
|
|
|
|
|
|
|
|
|
|
|
|
300 |
|
|
|
|
|
|
|
|
|
|
|
|
|
|
|
|
|
|
|
|
|
|
|
|
||
2.5 |
|
|
|
|
|
|
|
|
|
|
|
|
|
|
|
|
|
|
|
|
|
|
|
|
|
|
|
|
|
|
|
|
|
|
|
|
|
|
|
|
|
|
|
|
|
|
|
|
|
|
|
|
|
|
|
|
|
|
|
|
|
|
|
|
|
|
|
|
|
|
|
|
|
||
|
|
|
|
|
|
|
|
|
|
|
|
|
|
|
|
|
|
|
|
|
|
|
|
|
|
|
|
|
|
|
|
|
|
|
|
|
|
|
|
|
|
|
|
|
|
|
|
|
250 |
|
|
|
|
|
|
|
|
|
|
|
|
|
|
|
|
|
|
|
|
|
|
|
|
||
2.0 |
|
|
|
|
|
|
|
|
|
|
|
|
|
|
|
|
|
|
|
|
|
|
|
|
|
|
|
|
|
|
|
|
|
|
|
|
|
|
|
|
|
|
|
|
|
|
|
|
|
|
|
|
|
|
|
|
|
|
|
|
|
|
|
|
|
|
|
|
|
|
|
|
|
||
|
|
|
|
|
|
|
|
|
|
|
|
|
|
|
|
|
|
|
|
|
|
|
|
|
|
|
|
|
|
|
|
|
|
|
|
|
|
|
|
|
|
|
|
|
|
|
|
|
200 |
|
|
|
|
|
|
|
|
|
|
|
|
|
|
|
|
|
|
|
|
|
|
|
|
||
1.5 |
|
|
|
|
|
|
|
|
|
|
|
|
|
|
|
|
|
|
|
|
|
|
|
|
|
|
|
|
|
|
|
|
|
|
|
|
|
|
|
|
|
|
|
|
|
|
|
|
|
|
|
|
|
|
|
|
|
|
|
|
|
|
|
|
|
|
|
|
|
|
|
|
|
||
|
|
|
|
|
|
|
|
|
|
|
|
|
|
|
|
|
|
|
|
|
|
|
|
|
|
|
|
|
|
|
|
|
|
|
|
|
|
|
|
|
|
|
|
|
|
|
|
|
|
|
|
|
|
|
|
|
|
|
|
|
|
|
|
|
|
|
|
|
|
|
|
||||
|
|
|
|
|
|
|
|
|
|
|
|
|
|
|
|
|
|
|
|
|
|
|
|
|
|
|
|
|
|
|
|
|
|
|
|
|
|
|
|
|
|
|
|
|
|
|
|
|
150 |
|
|
|
|
|
|
|
|
|
|
|
|
|
|
|
|
|
|
|
|
|
|
|
|
||
1.0 |
|
|
|
|
|
|
|
|
|
|
|
|
|
|
|
|
|
|
|
|
|
|
|
|
|
|
|
|
|
|
|
|
|
|
|
|
|
|
|
|
|
|
|
|
|
|
|
|
|
|
|
|
|
|
|
|
|
|
|
|
|
|
|
|
|
|
|
|
|
|
|
|
|
||
|
|
|
|
|
|
|
|
|
|
|
|
|
|
|
|
|
|
|
|
|
|
|
|
|
|
|
|
|
|
|
|
|
|
|
|
|
|
|
|
|
|
|
|
|
|
|
|
|
|
|
|
|
|
|
|
|
|
|
|
|
|
|
|
|
|
|
|
|
|
|
|
||||
|
|
|
|
|
|
|
|
|
|
|
|
|
|
|
|
|
|
|
|
|
|
|
|
|
|
|
|
|
|
|
|
|
|
|
|
|
|
|
|
|
|
|
|
|
|
|
|
|
|
|
|
|
|
|
|
|
|
|
|
|
|
|
|
|
|
|
|
||||||||
0.5 |
|
|
|
|
|
|
|
|
|
|
|
|
|
|
|
|
|
|
|
|
|
|
|
|
|
|
|
|
|
|
|
|
|
|
|
|
|
|
|
|
|
|
|
|
|
|
|
|
|
100 |
|
|
|
|
|
|
|
|
|
|
|
|
|
|
|
|
|
|
|
|
|
|
|
|
|
|
|
|
|
|
|
|
|
|
|
|
|
|
|
|
|
|
|
|
|
|
|
|
|
|
|
|
|
|
|
|
|
|
|
|
|
|
|
|
|
|
|
|
|
|
|
|
|
|
|
|
|
|
|
|
|
|
|
|
|
|
|
|
|
|
|
|
|
|
|
|
|||||
|
|
|
|
|
|
|
|
|
|
|
|
|
|
|
|
|
|
|
|
|
|
|
|
|
|
|
|
|
|
|
|
|
|
|
|
|
|
|
|
|
|
|
|
|
|
|
|
|
|
|
|
|
|
|
|
|
|
|
|
|
|
|
|
|
|
|
|
||||||||
0.0 |
|
|
|
|
|
|
|
|
|
|
|
|
|
|
|
|
|
|
|
|
|
|
|
|
|
|
|
|
|
|
|
|
|
|
|
|
|
|
|
|
|
|
|
|
|
|
|
|
|
|
50 |
|
|
|
|
|
|
|
|
|
|
|
|
|
|
|
|
|
|
|
|
|
|
|
|
|
|
|
|
|
|
|
|
|
|
|
|
|
|
|
|
|
|
|
|
|
Jan 19 |
|
|
|
|
|
Jul 19 |
|
|
|
|
|
|
|
|
|
|
|
|
|
|
|
|
|
|
|
|
|
|
||||||||||||||||||||||||||
Jan 18 |
|
|
|
|
Jul 18 |
|
|
|
|
|
|
|
0 |
|
|
|
|
|
|
|
|
|
|
|
|
|
|
|
|
|
|
|
|
|
|
|
|
||||||||||||||||||||||||||||||||||||||
|
|
|
|
|
|
|
|
|
|
|
|
|
|
|
|
|
|
|
|
|
|
|
|
|
|
|
|
|
|
|
|
|
|
|
|||||||||||||||||||||||||||||||||||||||||
|
|
|
Conventional |
|
|
|
|
|
|
|
|
|
|
Bitumen |
|
Jan-12 |
Jan-14 |
|
|
|
|
Jan-16 |
|
|
|
Jan-18 |
|||||||||||||||||||||||||||||||||||||||||||||||||
|
|
|
|
|
|
|
|
|
|
|
|
|
|
||||||||||||||||||||||||||||||||||||||||||||||||||||||||||||||
|
|
|
|
|
|
|
|
|
|
|
|
|
|
||||||||||||||||||||||||||||||||||||||||||||||||||||||||||||||
|
|
|
Synthetic Crude |
|
|
|
|
|
|
|
|
|
|
Forecast |
|
Source: bational Energy Board, /anada |
|
|
|
|
|
|
|
|
|
||||||||||||||||||||||||||||||||||||||||||||||||||
|
|
|
|
|
|
|
|
|
|
|
|
|
|
|
|
|
|
|
|
|
|
|
|||||||||||||||||||||||||||||||||||||||||||||||||||||
|
|
|
|
|
|
|
|
|
|
|
|
|
|
|
|
|
|
|
|
|
|
|
|||||||||||||||||||||||||||||||||||||||||||||||||||||
In early March, Enbridge announced a delay in its Line 3 replacement project by as much as a year due to permitting issues in Minnesota. The project will boost export capacity by 370 kb/d and is now likely to start during the second half of 2020, meaning that companies will have to continue to rely on rail to move much of their production. Rail shipments of Canadian crude rose to 350 kb/d in December, an increase of 200 kb/d compared with a year earlier and a record high.
Mexican oil supply plunged another 70 kb/d in January, mainly on lower production from the Ku-Maloob-Zaap (KMZ) fields. Output from KMZ fell by 65 kb/d m-o-m to 800 kb/d. At 1.86 mb/d, total Mexican oil output was 330 kb/d below a year earlier and at its lowest in nearly 40 years. Crude and condensate supply, at 1.64 mb/d, stood 290 kb/d lower than a year ago, led by super light and light crude, which dropped by roughly 100 kb/d and 120 kb/d, respectively. Heavy crude production fell by 30 kb/d to below 1 mb/d. Natural gas liquids production increased 20 kb/d m-o-m but was 40 kb/d lower than a year ago. Total oil output is expected to fall by 170 kb/d on average this year, compared with a decline of 155 kb/d last year.
mb/d |
Mexican Crude Output by Type |
|
|
kb/d |
|
Mexican Crude Oil Output by Area |
||||||||||||||||||||||||||||||||||
|
|
|
|
|
|
|
|
|
|
|
|
|
|
|
|
|
|
Annual change |
|
|
|
|||||||||||||||||||
2.2 |
|
|
|
|
|
|
|
|
|
|
|
|
|
|
|
|
100 |
|
|
|
|
|
|
|
|
|||||||||||||||
|
|
|
|
|
|
|
|
|
|
|
|
|
|
|
|
|
|
|
|
|
||||||||||||||||||||
2.0 |
|
|
|
|
|
|
|
|
|
|
|
|
|
|
|
|
|
|
|
|
|
|
|
|
|
|
|
|
|
|
|
|
|
|
|
|
|
|
||
|
|
|
|
|
|
|
|
|
|
|
|
|
|
|
|
|
|
|
|
|
|
|
|
|
|
|
|
|
|
|
|
|
|
|
|
|
||||
|
|
|
|
|
|
|
|
|
|
|
|
|
|
|
|
|
|
|
|
|
|
|
|
|
|
|
|
|
|
|
|
|
|
|
|
|
|
|
|
|
1.8 |
|
|
|
|
|
|
|
|
|
|
|
|
|
|
|
|
0 |
|
|
|
|
|
|
|
|
|
|
|
|
|
|
|
|
|
|
|
|
|
|
|
|
|
|
|
|
|
|
|
|
|
|
|
|
|
|
|
|
|
|
|
|
|
|
|
|
|
|
|
|
|
|
|
|
|
|
||||||
1.6 |
|
|
|
|
|
|
|
|
|
|
|
|
|
|
|
|
-100 |
|
|
|
|
|
|
|
|
|
|
|
|
|
|
|
|
|
|
|
|
|
|
|
1.4 |
|
|
|
|
|
|
|
|
|
|
|
|
|
|
|
|
|
|
|
|
|
|
|
|
|
|
|
|
|
|
|
|
|
|
|
|
|
|
||
|
|
|
|
|
|
|
|
|
|
|
|
|
|
|
|
|
|
|
|
|
|
|
|
|
|
|
|
|
|
|
|
|
|
|
|
|
||||
1.2 |
|
|
|
|
|
|
|
|
|
|
|
|
|
|
|
|
-200 |
|
|
|
|
|
|
|
|
|
|
|
|
|
|
|
|
|
|
|
|
|
|
|
1.0 |
|
|
|
|
|
|
|
|
|
|
|
|
|
|
|
|
|
|
|
|
|
|
|
|
|
|
|
|
|
|
|
|
|
|
|
|
|
|
||
|
|
|
|
|
|
|
|
|
|
|
|
|
|
|
|
|
|
|
|
|
|
|
|
|
|
|
|
|
|
|
|
|
|
|
|
|
||||
0.8 |
|
|
|
|
|
|
|
|
|
|
|
|
|
|
|
|
-300 |
|
|
|
|
|
|
|
|
|
|
|
|
|
|
|
|
|
|
|
|
|
|
|
0.6 |
|
|
|
|
|
|
|
|
|
|
|
|
|
|
|
|
|
|
|
|
|
|
|
|
|
|
|
|
|
|
|
|
|
|
|
|
|
|
||
|
|
|
|
|
|
|
|
|
|
|
|
|
|
|
|
|
|
|
|
|
|
|
|
|
|
|
|
|
|
|
|
|
|
|
|
|
|
|
|
|
0.4 |
|
|
|
|
|
|
|
|
|
|
|
|
|
|
|
|
-400 |
|
|
|
|
|
|
|
|
|
|
|
|
|
|
|
|
|
|
|
|
|
|
|
|
|
|
|
|
|
|
|
|
|
|
|
|
|
|
|
|
|
|
|
|
|
|
|
|
|
|
|
|
|
|
|
|
|
|
|
|
||||
0.2 |
|
|
|
|
|
|
|
|
|
|
|
|
|
|
|
|
|
Jan-15 |
Jan-16 |
Jan-17 |
|
Jan-18 |
Jan-19 |
|||||||||||||||||
0.0 |
|
|
|
|
|
|
|
|
|
|
|
|
|
|
|
|
|
|
|
|
Cantarell |
|
|
|
|
Ku-Maloob-Zaap |
||||||||||||||
|
|
|
|
|
|
|
|
|
|
|
|
|
|
|
|
|
|
|
|
|
|
|
|
|||||||||||||||||
Jan-17 |
|
|
Jan-18 |
Jan-19 |
|
|
|
|
|
|
|
|
||||||||||||||||||||||||||||
|
|
|
|
|
|
|
|
|
|
|||||||||||||||||||||||||||||||
|
|
|
|
|
|
SE Offshore |
|
|
|
|
S Onshore |
|
|
|
||||||||||||||||||||||||||
|
|
|
|
|
Heavy |
|
|
Light |
|
Extra Light |
|
|
|
|
|
|
|
|
|
|
|
|
|
|||||||||||||||||
|
|
|
|
|
|
|
|
|
|
|
|
|
|
|
|
|
|
|
|
|
||||||||||||||||||||
|
|
|
|
|
|
|
|
|
|
|
|
|
|
N Onshore |
|
|
|
|
Total Crude |
|
|
|
||||||||||||||||||
|
|
|
|
|
|
|
|
|
|
|
|
|
|
|
|
|
|
|
|
|
|
|
|
|
|
|
|
|||||||||||||
Norway’s oil output dropped by 30 kb/d in January to 1.82 mb/d, 200 kb/d below a year earlier. A complete set of data for 2018 shows oil supply falling by 120 kb/d, or 6%. The biggest declines came from the Oseberg-Troll fields, which saw a combined drop of 50 kb/d. Fields feeding into the SleipnerFrigg system saw a decline of nearly 40 kb/d. Output at Statfjord-Gullfaks fields dropped by 20 kb/d while the Ekofisk area fell by only 10 kb/d. Following a decline of 80 kb/d this year, output is expected to get a significant boost in 2020, when the Johan Sverdrup field starts up towards year-end.
20 |
15 MARCH 2019 |
vk.com/id446425943
INTERNATIONAL ENERGY AGENCY - OIL MARKET REPORT SUPPLY
mb/d |
Norway Total Oil Supply |
kb/d |
United Kingdom Total Oil Supply |
2.2 |
|
1300 |
|
2.1 |
|
1200 |
|
2.0 |
|
1100 |
|
1.9 |
|
|
|
|
1000 |
|
|
1.8 |
|
|
|
|
900 |
|
|
1.7 |
|
|
|
|
800 |
|
|
1.6 |
|
|
|
1.5 |
|
700 |
|
Jan Mar May Jul |
Sep Nov Jan |
Jan Mar May Jul |
Sep Nov Jan |
|||||
|
2016 |
|
2017 |
|
2016 |
|
|
2017 |
|
|
|
|
|
||||
|
2018 |
|
2019 |
|
2018 |
|
|
2019 |
|
|
|
|
|||||
|
|
|||||||
|
|
|
|
|||||
|
2019 forecast |
|
|
|
2019 forecast |
|
|
|
Following the submission of revised data from UK’s Oil and Gas Authority (OGA), oil production estimates for 2018 have been raised by 75 kb/d compared with last month’s Report. The new data show production rose to 1.1 mb/d last year, up nearly 9% on 2017 and the highest UK oil production level since 2011. According to a new OGA report, Projections of UK Oil and Gas Production and Expenditure, the increase is attributed to the start-up of over 30 new fields since 2015, improved production efficiency and asset integrity, the realisation of enhanced oil recovery projects and the UK’s offshore licensing rounds’ continued focus on associated exploration, appraisal and development commitments. The Report also found that total operating costs rose by 6.4% last year, driven by higher activity, while unit operating costs increased only marginally by 2.2%, from $14.7/boe in 2017 to $15.5/boe in 2018. While capital expenditure fell for the fourth straight year, a 4% increase is expected in 2019.
Russian crude and condensate output fell by 40 kb/d in February, to 11.34 mb/d. Rosneft and Gazprom Neft made the biggest reductions, cutting output by 23 kb/d and 14 kb/d, respectively. In contrast, supply from production sharing agreements (PSAs) rose 17 kb/d m-o-m to 416 kb/d. Sakhalin 1, led by Exxon Mobil, is actively ramping up output after having approved a new development scheme for three
new fields offshore Sakhalin. The |
|
|
|
|
|
||||||||||
PSAs |
output |
reached |
a |
record |
Russian Crude Oil Production by Company (kb/d) |
||||||||||
near 270 kb/d in September, but |
|||||||||||||||
|
|
|
|
|
|||||||||||
has since fallen back to around |
|
|
|
|
|
||||||||||
|
|
|
|
|
|||||||||||
220 kb/d |
currently. |
Despite |
the |
|
February |
Change |
Change Change since |
||||||||
month-on-month drop, Russian oil |
|
Output |
M-o-M |
Y-o-Y |
Oct-18 |
||||||||||
output was 380 kb/d higher than a |
Rosneft |
3,961 |
-23 |
149 |
-42 |
||||||||||
year ago, and only 80 kb/d lower |
|||||||||||||||
Lukoil |
1,657 |
-8 |
26 |
-15 |
|||||||||||
than |
the |
October |
baseline |
from |
|||||||||||
Surgutneftegaz |
1,233 |
-6 |
26 |
6 |
|||||||||||
which |
|
compliance |
|
with |
agreed |
||||||||||
|
|
Gazprom Neft |
762 |
-14 |
-18 |
-42 |
|||||||||
cuts is calculated. Russia pledged |
|||||||||||||||
Tatneft |
597 |
-4 |
18 |
-6 |
|||||||||||
to reduce output by 230 kb/d, but |
|||||||||||||||
Bashneft |
380 |
-1 |
-3 |
-1 |
|||||||||||
has |
said |
the |
cut |
will |
be |
||||||||||
Gazprom |
447 |
-4 |
31 |
12 |
|||||||||||
implemented gradually. |
|
|
|
||||||||||||
|
|
|
PSA operators |
416 |
17 |
55 |
10 |
||||||||
|
|
|
|
|
|
|
|
|
|
||||||
Crude |
|
oil |
exports |
outside |
the |
Slavneft |
283 |
-1 |
16 |
-1 |
|||||
|
Other Oil Companies |
1,259 |
1 |
49 |
0 |
||||||||||
former |
Soviet Union |
fell |
more |
Total |
11335 |
-40 |
380 |
-83 |
|||||||
sharply |
in |
February, |
however. |
|
|
|
|
|
|||||||
Shipments dropped from 5.21 mb/d in January to 5 mb/d, but were nearly 8% higher than a year ago. Exports via the Transneft system averaged 4.05 mb/d last month, up from 3.77 mb/d a year ago, with higher shipments from the Baltic Sea outlets of Primorsk and Ust-Luga and from the Pacific port of Kozmino. Pipeline exports to China were also up year-on-year.
15 MARCH 2019 |
21 |

vk.com/id446425943
SUPPLY |
|
|
INTERNATIONAL ENERGY AGENCY - OIL MARKET REPORT |
|
mb/d |
Russia Crude Oil Production |
mb/d |
Kazakhstan Total Oil Supply |
|
11.6 |
2.1 |
|||
|
|
|||
11.4 |
|
2.0 |
|
|
|
1.9 |
|
||
|
|
|
||
11.2 |
|
1.8 |
|
|
11.0 |
|
1.7 |
|
|
|
1.6 |
|
||
10.8 |
|
1.5 |
|
|
|
1.4 |
|
||
|
|
|
||
10.6 |
|
1.3 |
|
Jan Mar May Jul |
Sep Nov Jan |
Jan Mar May Jul |
Sep Nov Jan |
|||||
|
2016 |
|
|
2017 |
|
2016 |
|
2017 |
|
|
|
|
|
||||
|
2018 |
|
|
2019 |
|
2018 |
|
2019 |
|
|
|
|
|
||||
|
2019 forecast |
|
|
|
2019 forecast |
|
|
|
Kazakhstan’s oil production held steady at just over 2 mb/d in January, but was up more than 100 kb/d from a year ago thanks to the continuing ramp-up of the offshore Kashagan field. Kashagan, developed by the North Caspian Operating Co. (NCOC), which includes Exxon Mobil, Royal Dutch Shell, Total and Eni, saw production up by 55% over the year at 310 kb/d. Output likely rose further in February when, according to Total, the field achieved its full Phase 1 capacity of 380 kb/d. This spring, NCOC will shut down Kashagan entirely for 45 days maintenance, the first time this has happened since production began. The Tengiz field will shut for maintenance in August, with Karachaganak following in September. January production was 15 kb/d lower than November’s all-time high that also serves as Kazakhstan’s reference point for 40 kb/d of output cuts. Azeri crude and condensate output rose by 13 kb/d to 807 kb/d in February, despite a pledge to cut production by 20 kb/d along with other OPEC and nonOPEC countries.
Brazilian oil output dropped by 65 kb/d in January, to 2.73 mb/d. Production was steady compared with a year ago, as maintenance and declines from mature fields offset growth from new start-ups. According to ANP, Brazil’s national oil, gas and biofuels agency, the main reason for the fall was maintenance shutdowns at the P-74 and FPSO Cidade de São Paulo platforms, in the Búzios and Sapinhoá fields, respectively. Output should rise in February following the start-up of the P-67 platform in the Lula Norte area and the P-76 at Buzios. P-76 is the third 150 kb/d unit to enter production in the Búzios field since last April. According to Petrobras’ Strategic Plan, another two FPSO will enter operations this year. As a result, we expect Brazilian production to increase by an average 375 kb/d this year, to around 3.3 mb/d by year-end.
mb/d |
Brazil Total Oil Supply |
kb/d |
Brazil Annual Supply Change |
|
||
3.4 |
|
|
400 |
|
|
|
3.2 |
|
|
200 |
|
|
|
3.0 |
|
|
|
|
|
|
|
|
|
|
|
|
|
2.8 |
|
|
0 |
|
|
|
2.6 |
|
|
-200 |
|
|
|
2.4 |
|
|
|
|
|
|
|
|
|
|
|
|
|
2.2 |
|
|
-400 |
|
|
|
Jan |
Mar May Jul |
Sep Nov Jan |
Jan-16 |
Jan-17 |
Jan-18 |
Jan-19 |
|
2016 |
2017 |
Onshore |
Campos Basin |
||
|
2018 |
2019 |
Santos Basin |
Other Offshore |
||
|
2019 forecast |
|
Total |
|
|
|
22 |
15 MARCH 2019 |