

GPB_Russian Utilities Initiation_231118_watermark
.pdfvk.com/id446425943
NOVEMBER 23, 2018 |
RUSSIA > EQUITY RESEARCH > UTILITIES |
|
|
Electricity supply: CSA-backed capacity additions are ending
Russian generators are currently approaching the completion of capacity addition programs under the umbrella of so-called Capacity Supply Agreements (CSAs, Russian abbreviation DPM), which were launched prior to the break-up of the former quasimonopoly RAO UES (2008). The CSAs guarantee the involved generators the right to collect premium capacity payments for a pre-agreed set of newly built units with duration of 10 years for new thermal units and 20 years for new hydro units.
Over the past 10 years (2008-17), Russia has commissioned around 40 GW of new capacity, including ~23 GW of thermal capacity under the umbrella of CSAs (Chart 10).
Chart 10: Russia has added ~40 GW of capacity over the past 10 years, including ~23 GW of thermal capacity under the umbrella of CSAs
Commissioning of new capacity and decommissioning of old capacity in Russia
45
40
35
30
25
20
15
10
5
0 -5 -10 -15 -20
|
GW |
39.9 |
|
|
|
|
|
|
Capacity decommissioning (TPP) |
|
|
|
|
|
|
|
|
|
|
|
Capacity commissioning (CSA TPP) |
|
22.6 |
|
|
||
|
|
||
|
Capacity commissioning (Non-CSA TPP) |
|
|
|
|
||
|
|
||
|
|
|
|
17.3
|
|
|
|
|
|
|
|
|
|
|
|
|
|
|
|
|
|
|
|
|
-15.8 |
||
2008 |
2009 |
2010 |
2011 |
2012 |
2013 |
2014 |
2015 |
2016 |
2017 2008-17 |
||
Source: System Operator, Gazprombank estimates
However, net additions of capacity (30 GW) have been lower than commissioning (40 GW) over this period due to substantial decommissioning as well as other changes (Chart 11).
Chart 11: Net additions over the past 10 years were lower than commissioning due to capacity removals
Changes in Russian installed capacity of TPPs in 2010-17 (within UES)
45
40 GW
35 |
|
|
|
|
|
|
|
30 |
|
17 |
-16 |
|
|
|
|
|
|
|
6 |
|
|
||
25 |
|
|
|
|
|
||
|
|
|
|
|
|
||
|
|
|
|
|
|
||
20 |
|
|
|
|
|
|
|
15 |
|
|
|
|
|
30 |
|
10 |
23 |
|
|
|
|
|
|
|
|
|
|
|
|
||
5 |
|
|
|
|
|
|
|
0 |
|
|
|
|
|
|
|
Capacity additions |
Capacity additions |
Decommissioning Other net changes |
Net capacity |
||||
|
|||||||
|
(CSA TPP) |
(Non-CSA TPP) |
(TPP) |
addition (TPP) |
|||
Source: System Operator, Gazprombank estimates
Looking forward, we expect a slowdown in capacity additions in Russia on the back of the effective completion of introduction of CSA-supported thermal capacities.
11
vk.com/id446425943
NOVEMBER 23, 2018 |
RUSSIA > EQUITY RESEARCH > UTILITIES |
|
|
Supply-demand balance: softened due to CSA-backed additions
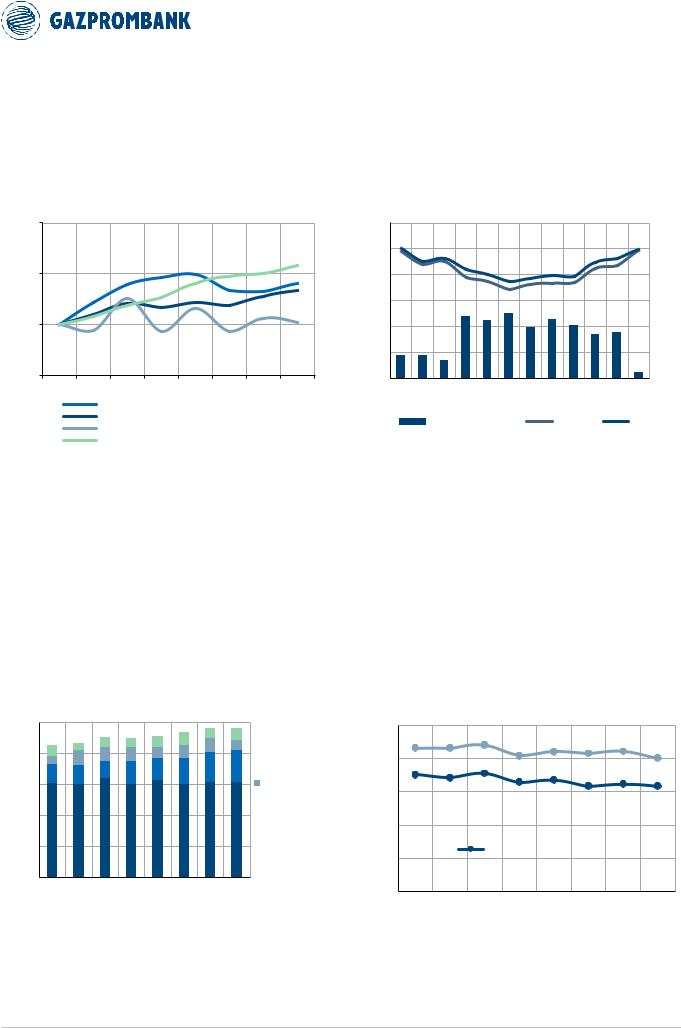
On the back of accelerated capacity introductions over the past decade (both CSA and non-CSA), growth in Russian capacity substantially exceeded that of electricity consumption (Chart 12).
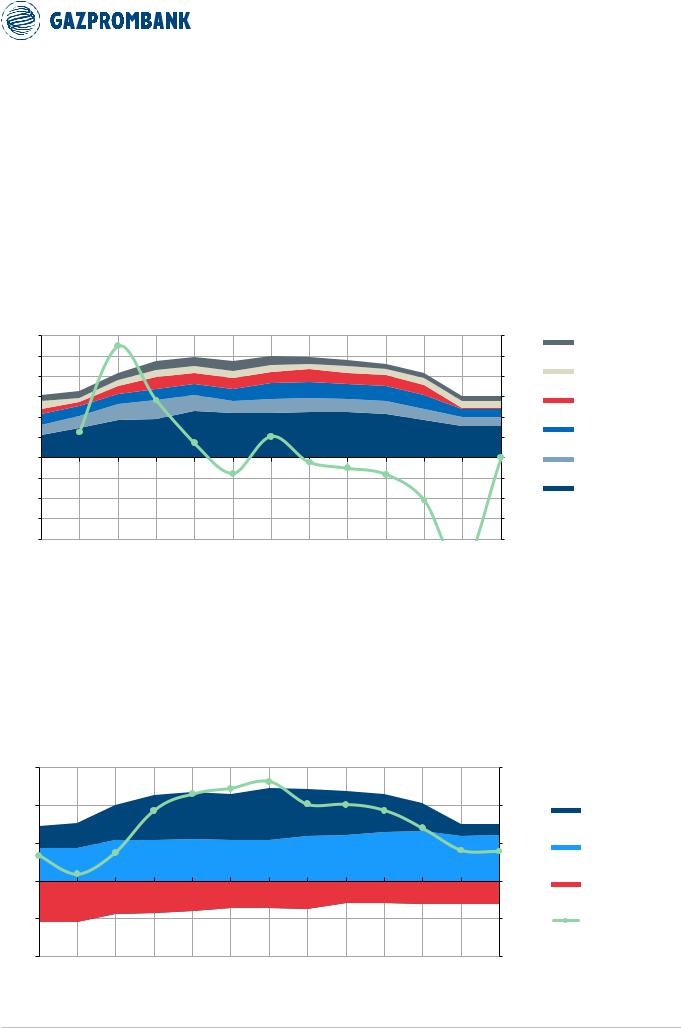
Chart 12. Growth in Russian installed capacity exceeded that of Russian electricity consumption and, especially, peak load
Russian GDP, electricity consumption, peak demand and installed capacity indexes (2010=100%)
Chart 13: Peak load growth has lagged that of demand, as demand growth was concentrated in “warm” periods
Monthly electricity consumption (line, lhs) in 2010 and 2017, and change 2017/2019 (columns, rhs)
120%
YoY
110%
100%
90%
2010 |
2011 |
2012 |
2013 |
2014 |
2015 |
2016 |
2017 |
GDP INDEX
ELECTRICITY DEMAND INDEX (RUSSIA TOTAL)
PEAK LOAD INDEX (UES)
INSTALLED CAPACITY INDEX (UES)
120 |
|
|
20% |
mln MWh |
|
YoY |
18% |
|
|
|
|
100 |
|
|
16% |
|
|
|
|
80 |
|
|
14% |
|
|
|
|
|
|
|
12% |
60 |
|
|
10% |
|
|
|
8% |
40 |
|
|
6% |
|
|
|
|
20 |
|
|
4% |
|
|
|
|
|
|
|
2% |
0 |
|
|
0% |
Jan Feb Mar Apr May June July |
Aug Sep Oct |
Nov Dec |
|
2017/2010 growth |
2010 |
2017 |
|
Source: State Statistics Service, System Operator |
Source: System Operator |
The gap between capacity hikes and peak demand over 2010-17 was even larger because the dynamics of peak demand were lagging that of electricity consumption. The reason was that the growth in volume of consumption was concentrated in the “warm” part of the year, whereas peak demand occurs during the “cold” period (Chart 13).
Accelerated growth in installed capacities triggered growth in Russian capacity reserves (Chart 14), which resulted in a decline of the following ratios (Chart 15):
Peak load as % of installed capacity declined to 63% in 2017 from 70% in 2010.
Peak load as % of available capacity declined to 80% in 2017 from 87% in 2010.
Chart 14. CSA-supported capacity additions triggered growth of reserve capacity
Russian installed capacity and peak load
250
GW
200
 RESTRICTIONS
150 |
REPAIRS |
 RESERVES
100
 PEAK LOAD (UES)
50
0
2010 2011 2012 2013 2014 2015 2016 2017
Chart 15. Peak load as % of installed and available capacity has declined with realization of CSA programs
UES peak load as % of installed and available capacity
100% as % share
80%
60%
40%
PEAK LOAD / INSTALLED CAPACITY
20%
 PEAK LOAD / AVAILABLE CAPACITY
0%
2010 |
2011 |
2012 |
2013 |
2014 |
2015 |
2016 |
2017 |
Source: System Operator |
Source: System Operator, Gazprombank estimates |
Looking forward, we expect the supply-demand balance in Russia to slowly tighten as the bulk of introductions under CSA have already been completed, while mild growth in electricity consumption and peak demand should continue.
12
vk.com/id446425943
NOVEMBER 23, 2018 |
RUSSIA > EQUITY RESEARCH > UTILITIES |
|
|
ELECTRICITY PRICES: GENERATORS
Russian electricity generators continue to receive two principal revenue streams from operating on electricity markets:
revenue for electrical energy, with the deregulated portion priced predominantly through the Day Ahead Market (DAM, Russian abbreviation RSV);
revenue for electrical capacity, with the deregulated portion priced in two ways:
-Capacity Supply Agreements (CSAs, Russian abbreviation DPM) for “new” units commissioned under the umbrella of CSAs as long as the latter do not expire. CSAs last for 10 years for new thermal units and 20 years for hydro units.
-Competitive Capacity Auctions (Russian abbreviation KOM) for units not supported by CSA agreements. This includes “old” and “new” units that were not built under the umbrella of CSAs or whose CSAs have expired.
Electric energy price (DAM): lackluster growth due to softer supplydemand
Wholesale prices for electrical energy (i.e. prices at which generators sell electrical energy) are sensitive to changes in the supply-demand balance, as they are defined via competitive bidding on an hourly basis. Thus, softening of the supply-demand balance (on the back of accelerated capacity introductions under the CSA umbrella) has exerted pressure on DAM prices, as shown by the following indicators:
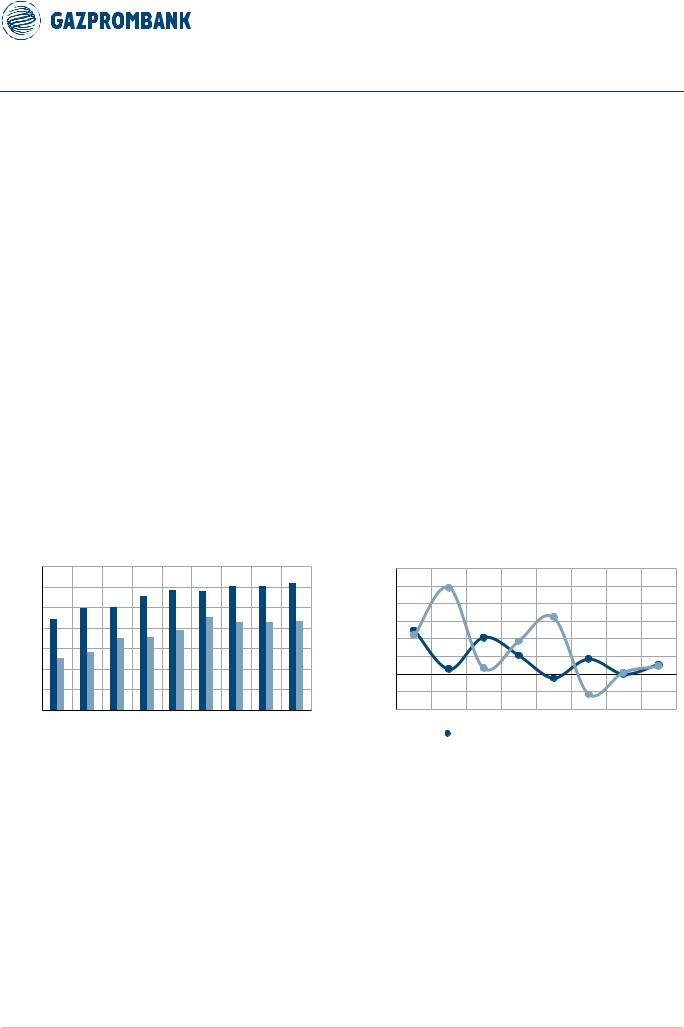
DAM prices in European Russia and the Urals (“1st pricing zone”) effectively stabilized starting in 2015 (Chart 16), with YoY growth falling to zero despite continued low single-digit growth in gas prices over this period.
Chart 16. Wholesale electricity prices on the DAM market have stabilized since 2014
Year average day-ahead-market (DAM) prices, RUB/MWh
1,400
RUB/MWh
1,200
1,000
800
600
400
200
0
2010 |
2011 |
2012 |
2013 |
2014 |
2015 |
2016 |
2017 10M2018 |
||
|
DAM PRICE (PRICE ZONE 1) |
|
DAM PRICE (PRICE ZONE 2) |
||||||
|
|
||||||||
|
|
||||||||
Chart 17. DAM prices in Siberia have been more volatile than in European Russia, but have not grown in the past two years
Year average day-ahead-market (DAM) price change, YoY
30%
YoY
25%
20%
15%
10%
5%
0% -5% -10%
2011 |
2012 |
2013 |
2014 |
2015 |
2016 |
2017 |
10M2018 |
|
|
DAM PRICE CHANGE (PRICE ZONE 1) |
|
||||
|
|
|
|||||
 DAM PRICE CHANGE (PRICE ZONE 2)
Source: ATS |
Source: ATS |
DAM prices in Siberia (“2nd pricing zone”) have been more volatile, in particular due to the high share of hydro capacities, output from which fluctuates depending on water supply. But, the pace of growth in such prices has also fallen to zero (Chart 17).
13

vk.com/id446425943
NOVEMBER 23, 2018 |
RUSSIA > EQUITY RESEARCH > UTILITIES |
|
|
Looking forward, we expect DAM prices in both the 1st and 2nd pricing zones to show below-inflation growth due to the still relatively soft supply-demand balance (Chart 18).
Chart 18. We expect DAM prices to sustain mild growth in the medium term on the back of growth in prices of underlying fuel..
Average DAM prices for electrical energy in European Russia and Siberia
Chart 19. … but DAM prices in European Russia should still grow slower than gas prices
DAM price for electrical energy / wholesale price for gas (European Russia)
1,500 |
|
0.40 |
|
|
RUB/MWh |
0.35 |
|
|
|
|
|
1,200 |
|
0.30 |
|
|
|
|
|
900 |
|
0.25 |
Electric |
|
energy price / |
||
|
|
||
|
|
|
|
|
|
0.20 |
Gas tariff, |
600 |
|
0.15 |
tcm/ MWh |
|
|
|
|
300 |
|
0.10 |
|
|
|
|
|
|
|
0.05 |
|
0 |
|
0.00 |
|
2010 |
2011 |
2012 |
2013 |
2014 |
2015 |
2016 |
2017 |
2018E |
2019E |
2020E |
2021E |
2022E |
2023E |
2024E |
2025E |
2026E |
2010 |
2011 |
2012 |
2013 |
2014 |
2015 |
2016 |
2017 |
2018E |
2019E |
2020E |
2021E |
2022E |
2023E |
2024E |
2025E |
2026E |
|||||
|
|
|
|
ELECTRICITY(EUROPE & URALS) |
|
|
|
ELECTRICITY(SIBERIA) |
|
|
|
|
|
|
|
|
ELECTRICITY / GAS |
|
|
|
|
|
|
|||||||||||||||
|
|
|
|
|
|
|
|
|
|
|
|
|
|
|
|
|
|
|
|
|
||||||||||||||||||
|
|
|
|
|
|
|
|
|
|
|
Source: ATS, Gazprombank estimates |
|
|
|
|
|
|
|
|
|
|
|
Source: ATS, Gazprombank estimates |
|||||||||||||||
Moreover, the dynamic of DAM prices in European Russia and the Urals should continue to lag that of gas prices, even though the latter is set to grow below inflation.
Price for “old” capacity (KOM): to be hiked in 2021
The price for “old” capacity (i.e. that not covered by CSAs) is defined via competitive capacity auctions (Russian abbreviation KOM). KOM prices are set separately for the 1st and 2nd pricing zones and currently operate on a four-year horizon (i.e. KOM conducted in late 2017 defined capacity prices for 2021). The government is preparing an extension of the KOM horizon to six years to synchronize regulatory decisions on KOM and the modernization program for thermal generators, according to indications by industry participants (e.g. Inter RAO, Unipro).
Chart 20. Capacity prices for “old” capacity are to be hiked in 2021
Prices for “old” capacity (based on KOM), RUB/kW/month
300
RUB/KW/month
250
200
150
100
50
-
2016 |
2017 |
2018E |
2019E |
2020E |
2021E |
2022E |
2023E |
2024E |
2025E |
2026E |
|
|
|
|
EUROPE & URALS; ACTUAL |
|
|
|
EUROPE & URALS; FORECAST |
|
|||
|
|
|
|
|
|
|
|||||
|
|
|
SIBERIA; ACTUAL |
|
|
|
|
SIBERIA; FORECAST |
|
|
|
|
|
|
|
|
|
|
|
|
|||
Source: System Operator, Gazprombank estimates
Based on the results of KOM for 2021 (conducted in 2017), we expect a substantial hike in KOM prices in 2021, with below-inflation growth thereafter (Chart 20). We note that our forecast appears conservative compared to expectations of some market participants (e.g. Unipro), who do not exclude further double-digit hikes in KOM tariffs after 2020
14
vk.com/id446425943
NOVEMBER 23, 2018 |
RUSSIA > EQUITY RESEARCH > UTILITIES |
|
|
Price for “new” capacity (CSA): gradual decline followed by hike during final years
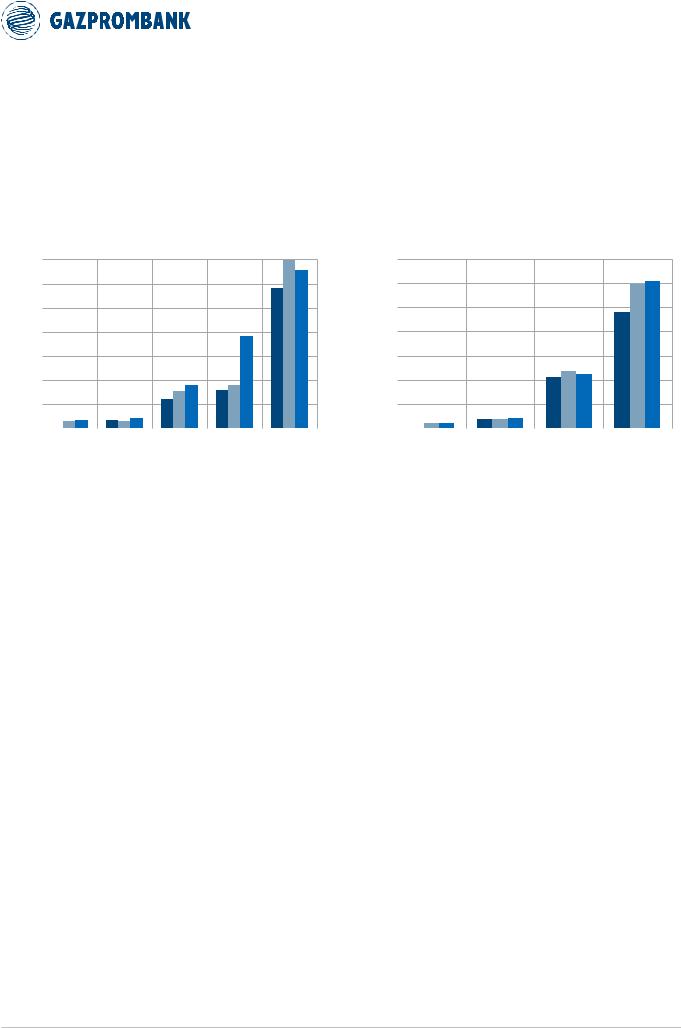
Capacity prices for “new” capacity under the CSA umbrella are set individually for each new unit and change over time. Typically, they are substantially higher than the prices for “old” capacity (even before accounting for the uplift for years 7-10) in both European Russia (Chart 21) and Siberia (Chart 22).
Chart 21. Capacity prices under CSA substantially exceed those under KOM in European Russia and the Urals…
Weighted-average capacity prices using various trading regimes (1st pricing zone), RUB/kW/month
Chart 22. … as well as in Siberia
Weighted-average capacity prices using various trading regimes (2nd pricing zone), RUB/kW/month
3,500 |
|
RUB/kW/month |
|
2015 |
|
2016 |
|
2017 |
3,500 |
|
RUB/kW/month |
|
2015 |
|
2016 |
|
2017 |
|
|
|
|
|
|
|
|
||||||||||
3,000 |
|
|
|
|
3,000 |
|
|
|
|
||||||||
|
|
|
|
|
|
|
|
|
|||||||||
|
|
|
|
|
|
|
|
|
|
|
|
|
|
|
|
||
2,500 |
|
|
|
|
|
|
|
|
2,500 |
|
|
|
|
|
|
|
|
2,000 |
|
|
|
|
|
|
|
|
2,000 |
|
|
|
|
|
|
|
|
1,500 |
|
|
|
|
|
|
|
|
1,500 |
|
|
|
|
|
|
|
|
1,000 |
|
|
|
|
|
|
|
|
1,000 |
|
|
|
|
|
|
|
|
500 |
|
|
|
|
|
|
|
|
500 |
|
|
|
|
|
|
|
|
0 |
|
|
|
|
|
|
|
|
0 |
|
|
|
|
|
|
|
|
|
|
|
|
|
|
|
|
|
|
|
|
|
|
|
|
REGULATED |
KOM |
CSA TPP CSA NPP/HPP |
CSA |
REGULATED |
KOM |
CSA TPP |
CSA |
CONTRACTS |
|
|
RENEWABLES |
CONTRACTS |
|
|
RENEWABLES |
|
|
Source: NP Market Council |
|
|
|
Source: NP Market Council |
|
Capacity prices for individual generating units should evolve in the coming years based on the following drivers:
gradual expiration of CSAs for new thermal capacities, as the first introductions date back to 2008. For example, among generators under our coverage, Mosenergo should see the CSA for its three new units expire in 2018. With the expiration of CSAs, capacity prices of corresponding units should decline to the level of KOM.
mild downward pressure on normalized level of CSA prices in the medium term on the back of a potential decline in the yield on government bonds (from currently elevated levels), which drives the target rate of return on CSA contracts.
hike in CSA prices for individual thermal units during years 7-10 of a corresponding CSA in order to compensate for the shortened period of CSA payments (to 10 years from an initially envisioned 15 years). This is typically substantial at around 1.5x. On the flipside, after the hike in CSA prices during years 7-10 of an CSA, the capacity price “dives” to the level of KOM starting from year 11.
15
vk.com/id446425943
NOVEMBER 23, 2018 |
RUSSIA > EQUITY RESEARCH > UTILITIES |
|
|
ELECTRICITY TARIFF: GRIDS
Transportation of electricity: Government envisions below-inflation growth in tariffs
Electricity transmission tariffs are regulated on a federal basis (for FSK) and regionally (for regional grids). These tariffs should evolve in the coming years based on the following drivers:
below-inflation growth in electricity transportation tariffs (except for residential supply) as envisioned by the government’s economic forecast for 2019-24, e.g. the government set the target growth rate for non-residential electricity transmission tariffs at around 3% in 2019-14, while CPI is envisioned at 4% (Chart 23).
Chart 23. Government envisions that average tariffs for electricity transportation services for non-residential supply can grow by ~3% p.a. in 2019-24
Growth of tariffs for electricity transportation (line) and electricity transportation revenues by Russian
Grids and FSK
25% |
YoY |
RUSSIAN GRIDS' TRANSPORTATION REVENUE |
|
20%
FSK' TRANSPORTATION REVENUE
AVERAGE ELECTRICITY TRANSPORTATION TARIFFS
CPI (RUSSIA), EOP
15%
10%
5%
0%
2011 |
2012 |
2013 |
2014 |
2015 |
2016 |
2017 |
2018E |
2019E |
2020E |
2021E |
-5%
Source: company data, Economy Ministry
accelerated growth in the electricity transportation tariff for direct customers of FSK, which may grow by 1.5x over seven years (implying an annual growth rate of ~6% p.a.) in order to reduce the tariff burden on other consumers, according to Kommersant. The accelerated growth in tariffs for direct customers could be accompanied by:
-simultaneous slowdown in growth of FSK tariffs for other customers
(e.g. regional distribution companies), which should ensure that the average growth in FSK tariffs will remain broadly in line with the government’s targets.
long-term (~10 years) tariff agreements between regional authorities and grid companies that would fix tariff growth over this period at inflation minus 0.1% and allow regional grid companies to benefit from realized efficiency gains. The possible introduction of these agreements is being considered by the government, according to Kommersant.
Connections of new customers: Government prepares to soften the requirements for grids
The government is considering adjustments to current rules governing connection of new customers to the grids, according to Energy Minister Dmitry Novak (interviewed by Kommersant), Russian Grids’ CEO Pavel Livinsky (interviewed by Interfax) and other media reports. The adjustments may include the following:
charges for the excessive grid capacity for consumers who request a connection with an excessive load. Such charges could be introduced gradually, with the share of to-be-paid-for capacity initially increasing by 5-10 pps annually to reach 100% by 2024. Consumers may reduce the charge by cutting the requested capacity.
16

vk.com/id446425943
NOVEMBER 23, 2018 |
RUSSIA > EQUITY RESEARCH > UTILITIES |
|
|
growth in “preferential” connection prices for small and medium-sized consumers (load <150 KW) from the current “symbolic” level to one that would cover a major portion (~50%) of economic costs, e.g. Russian Grids proposed to raise the tariff to RUB 5,000/KW.
Livinsky estimated annual benefits from these initiatives at RUB 50 bln and RUB 35 bln, respectively, according to an interview with Interfax. We do not yet include these potential gains into our forecasts.
17

vk.com/id446425943
NOVEMBER 23, 2018 |
RUSSIA > EQUITY RESEARCH > UTILITIES |
|
|
EBITDA AND FCF
Generators: CSA-backed additions are almost completed
Russian electricity generators are approaching the completion of capacity addition programs under the umbrella of CSAs.
Chart 24: Majority of covered generators should complete CSA programs by end 2018
Capacity addition plans (GW, lhs) and their completion by end 2018 (rhs)
5 |
|
GW |
|
|
|
|
|
|
100% |
|
2020-2021 |
||
|
|
|
|
|
|
|
|
||||||
|
|
|
|
|
|
|
|
||||||
|
|
|
|
|
|
|
|
|
|||||
|
|
|
|
|
|
|
|
|
|
|
|||
4 |
|
|
|
|
|
|
|
|
|
80% |
|
2019 |
|
|
|
|
|
|
|
|
|
|
|
||||
|
|
|
|
|
|
|
|
|
|
||||
|
|
|
|
|
|
|
|
|
|
|
|||
3 |
|
|
|
|
|
|
|
|
|
60% |
|
2018 |
|
|
|
|
|
|
|
|
|
|
|
||||
|
|
|
|
|
|
|
|
|
|
||||
|
|
|
|
|
|
|
|
|
|
|
|||
2 |
|
|
|
|
|
|
|
|
|
40% |
|
2016-17 |
|
|
|
|
|
|
|
|
|
|
|
||||
1 |
|
|
|
|
|
|
|
|
|
20% |
|
||
|
|
|
|
|
|
|
|
|
|
2008-2015 |
|||
|
|
|
|
|
|
|
|
|
|||||
0 |
|
|
|
|
|
|
|
|
|
|
0% |
|
|
|
|
|
|
|
|
|
|
|
|
|
|||
|
|
|
|
|
|
|
|
|
|
|
|||
|
|
|
|
|
|
|
|
|
|
|
|
||
|
|
|
Rushydro |
InterRAOEG |
Unipro |
OGKEnel-5 |
Mosenergo |
TGK-1 |
OGK-2 |
|
FINISHED BY |
||
|
|
|
|
|
|
|
|
|
|
|
|
|
|
END 2018 AS % OF TOTAL PROGRAM
Source: company data, Gazprombank estimates
In particular, most of the covered generators should have their CSA-sponsored capacity addition programs completed by end 2018 (Chart 24). Key exceptions from this pattern are the following:
Unipro, which is yet to re-launch the new Beryozovskaya TPP (0.8 GW, 2H19), which was damaged in early 2016 and, according to company guidance, should be brought back onstream by 2H19. The CSA for this unit should still expire at end 2024 – 10 years after the “prescribed” launch time.
Enel Russia, which is yet to launch two wind power plants (“wind parks”) with capacity of 0.1 GW and 0.2 GW by end 2020 and 2021, respectively. While these units are technically not part of the initial CSA-supported program, the economic return on these investments is to be supported by a mechanism similar to CSA that was designed for encouraging investment in renewable capacities.
RusHydro is to launch both hydro and thermal capacities in 2018 or later, including the following:
-Hydro capacities: 3rd unit of Ust’-Srednekanskaya HPP (0.1 GW, 2018), Zaramagskaya HPP-1 (0.3 GW, 2018-19).
-Thermal capacities in the Far East already under construction: Sakhalin TPP-2 (0.1 GW, 2018-19), Sovetskaya Gavan TPP-2 (0.1 GW, 2019-21). These power plants are not part of the CSA or a similar scheme.
-Thermal capacities in the Far East that are envisioned for construction in the future: Artemovskaya CHP-2 (0.5 GW) and Khabarovskaya CHP-4 (0.3 GW) 1. These units are likely to be constructed as part of the program to modernize Russian thermal capacities and are supported by regulatory arrangements similar to CSA agreements. We do not yet include these units into our financial forecasts as their specific parameters are not yet established.
18
vk.com/id446425943
NOVEMBER 23, 2018 |
RUSSIA > EQUITY RESEARCH > UTILITIES |
|
|
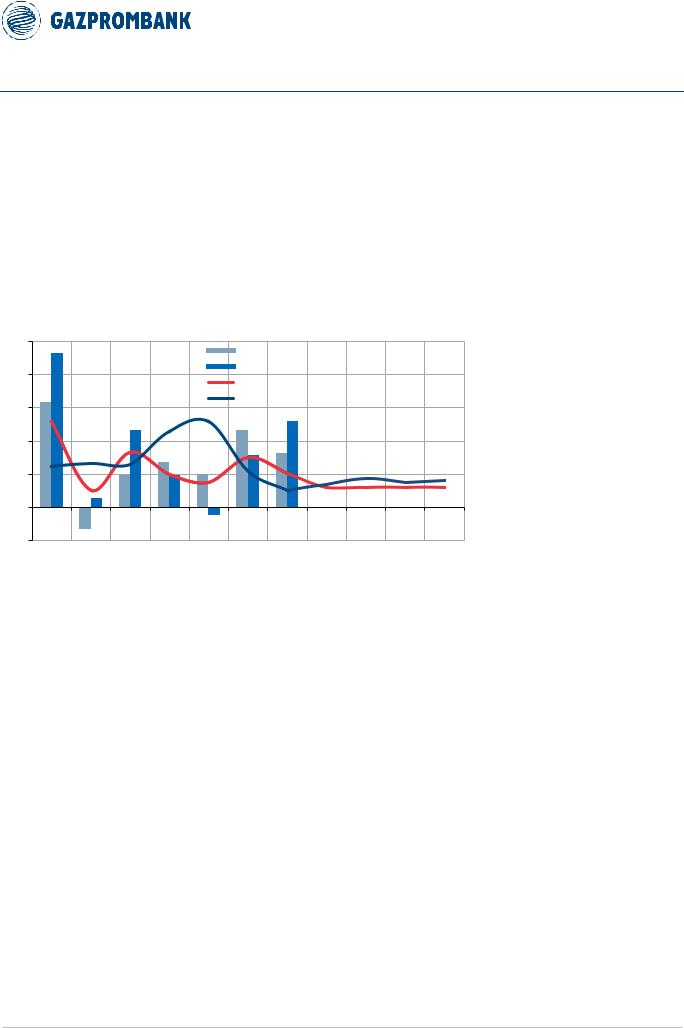
EBITDA of generators: to decline after 2020 with expiration of CSAs
The aggregated “premium” (i.e. above KOM) revenues from CSAs for Russian thermal generators as well as their EBITDA should start declining in the medium term (without accounting for the effect of modernization programs) on the back of the following two drivers:
gradual expiration of CSAs (starting from capacities introduced during the early stages of the program), with their capacity prices descending from the CSA to KOM level, e.g. Mosenergo should see CSA contracts for its three new units expiring in 2018.
vanishing stream of newly introduced capacities that are supported by CSAs, as the last introduction of CSA-supported thermal capacity should take place in 2019.
Chart 25. EBITDA of covered thermal generators should decline after 2020 on the back of gradual expiration of CSAs
EBITDA of covered thermal generators (lhs) and YoY change (rhs) – not including “premium” revenue from modernized capacities
300 |
|
RUB bln |
|
|
|
|
|
|
|
|
|
YoY |
|
30% |
|
|
|
|
|
|
|
|
|
|
|
|
|
||
250 |
|
|
|
|
|
|
|
|
|
|
|
|
|
25% |
200 |
|
|
|
|
|
|
|
|
|
|
|
|
|
20% |
150 |
|
|
|
|
|
|
|
|
|
|
|
|
|
15% |
100 |
|
|
|
|
|
|
|
|
|
|
|
|
|
10% |
50 |
|
|
|
|
|
|
|
|
|
|
|
|
|
5% |
0 |
2014 |
2015 |
2016 |
2017 |
2018E |
2019E |
2020E |
2021E |
2022E |
2023E |
2024E |
2025E |
2026E |
0% |
-50 |
-5% |
|||||||||||||
|
|
|||||||||||||
-100 |
|
|
|
|
|
|
|
|
|
|
|
|
|
-10% |
-150 |
|
|
|
|
|
|
|
|
|
|
|
|
|
-15% |
-200 |
|
|
|
|
|
|
|
|
|
|
|
|
|
-20% |
TGK-1
ENEL RUSSIA
OGK-2
UNIPRO
MOSENERGO
INTERRAO
 EBITDA GROWTH: THERMAL
Source: company data, Gazprombank estimates
As a result, the aggregate EBITDA of covered thermal generators should reach a peak around 2020 and start declining thereafter (Chart 25). This does not include the potential impact of the “modernization” program for “old” thermal capacities, as its specific projects are not defined yet.
FCF of generators: to peak around 2020
Similar to EBITDA of the covered generators, their FCF is also approaching a peak, which should take place around 2020, according to our estimates (Chart 26).
Chart 26. Aggregate FCF of covered thermal generators should start declining after 2020 on the back of expiration of CSAs
Aggregate FCF profile of covered generators (lhs) and median FCFY (rhs), not including potential modernization capex and revenues.
300 |
|
|
|
|
|
|
|
|
|
|
|
30% |
|
|
RUB bln |
|
|
|
|
|
|
|
|
FCFY (line) |
|
|
|
200 |
|
|
|
|
|
|
|
|
|
|
|
20% |
EBITDA ("NEW") |
|
|
|
|
|
|
|
|
|
|
|
|
|
|
100 |
|
|
|
|
|
|
|
|
|
|
|
10% |
EBITDA ("OLD") |
|
|
|
|
|
|
|
|
|
|
|
|
|
|
0 |
|
|
|
|
|
|
|
|
|
|
|
0% |
CAPEX |
|
|
|
|
|
|
|
|
|
|
|
|
|
|
-100 |
|
|
|
|
|
|
|
|
|
|
|
-10% |
FCFY |
-200 |
|
|
|
|
|
|
|
|
|
|
|
-20% |
|
2014 |
2015 |
2016 |
2017 |
2018E |
2019E |
2020E |
2021E |
2022E |
2023E |
2024E |
2025E |
2026E |
|
|
|
|
|
|
|
|
|
|
|
|
|
Source: company data, Gazprombank estimates |
|
19
vk.com/id446425943
NOVEMBER 23, 2018 |
RUSSIA > EQUITY RESEARCH > UTILITIES |
|
|
The average FCFY of covered thermal generators should show healthy levels, as seen from the following indicators (Chart 26):
substantial FCFY-to-CoE premium during “peak years” of CSA payments
(2018-23), with median FCFY for covered thermal generators over this period around 20%
broad FCFY-to-CoE parity after the expiration of a major part of CSAs (2024), with median FCFY for covered thermal generators descending toward ~15%.
high single-digit FCFY-to-CoE after expiration of the bulk of CSAs (2026).
This pattern does not include the effect of the potential launch of the program to
“modernize” “old” capacities due to uncertainty regarding individual projects.
FCF profile of generators: variations due to differences in CSA portfolio
While the aggregate FCF of covered thermal generators should peak around 2020, the FCFY profiles of individual generators should vary significantly (Chart 27), driven in particular by differences in the following factors:
timing of introduction of new capacities supported with CSAs, as capacity introductions under CSAs are spread out over more than a decade (2008-18);
timing of expiration of CSAs, which for some thermal units arrives sooner than the “prescribed” 10 years after commissioning due to a delay in actual commissioning relative to the “prescribed” timing.
timing of the start of “premium” years for thermal CSAs (years 7-10), when CSA prices experience a four-year hike before descending to the level of KOM.
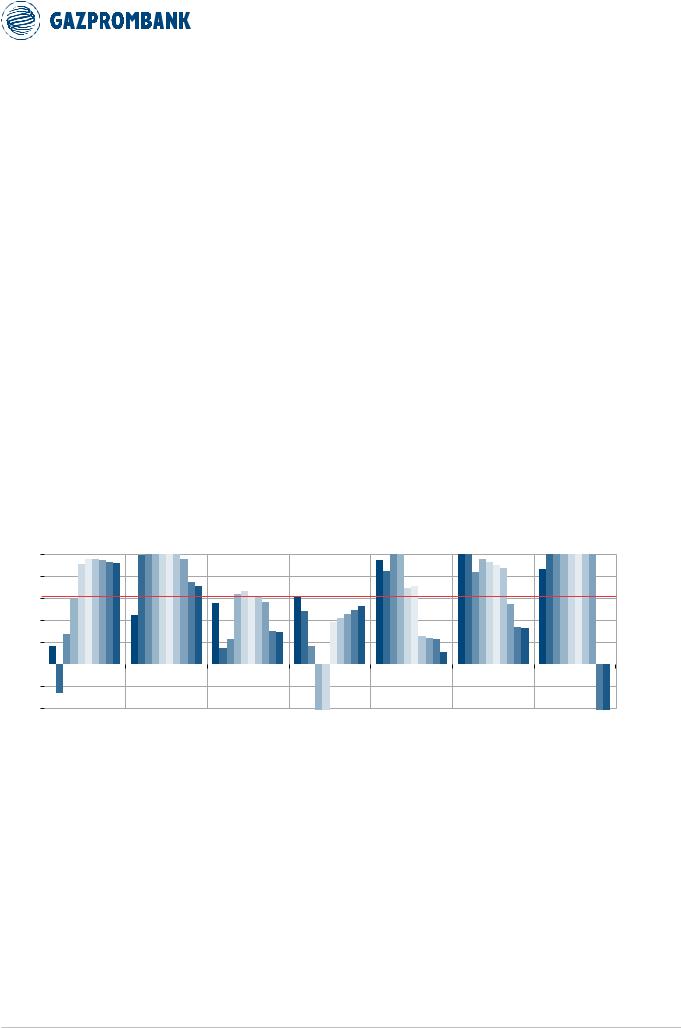
Chart 27. Majority of covered gencos reached positive FCF, but not necessarily a FCFY-to-CoE premium.
Estimated FCFY of covered generators (without including effect of modernization program): 2017-26
25% |
|
FCFY |
|
|
|
|
|
|
|
|
2017 |
|
|
|
|
|
|
|
|
||||
|
|
|
|
|
|
|
|
|
|
2018E |
|
20% |
|
CoE |
|
|
|
|
|
|
|
|
|
|
|
|
|
|
|
|
|
|
|||
|
|
|
|
|
|
|
|
|
|||
|
|
|
|
|
|
|
|
|
|
||
15% |
|
|
|
|
|
|
|
|
|
2019E |
|
|
|
|
|
|
|
|
|
|
|
||
|
|
|
|
|
|
|
|
|
|
|
|
10% |
|
|
|
|
|
|
|
|
|
|
2020E |
|
|
|
|
|
|
|
|
|
|
||
|
|
|
|
|
|
|
|
|
|
||
|
|
|
|
|
|
|
|
|
|
2021E |
|
5% |
|
|
|
|
|
|
|
|
|
|
|
|
|
|
|
|
|
|
|
|
|
||
|
|
|
|
|
|
|
|
|
|
2022E |
|
0% |
|
|
|
|
|
|
|
|
|
|
|
|
|
|
|
|
|
|
|
|
|
2023E |
|
|
|
|
|
|
|
|
|
|
|
||
|
|
|
|
|
|
|
|
|
|
||
-5% |
|
|
|
|
|
|
|
|
|
|
2024E |
|
|
|
|
|
|
|
|
|
|
||
|
|
|
|
|
|
|
|
|
|
||
-10% |
|
Rushydro |
InterRAO |
Unipro |
Enel Russia |
TGK-1 |
Mosenergo |
OGK-2 |
|
|
2025E |
|
|
|
|||||||||
|
|
|
2026E |
||||||||
|
|
|
|
||||||||
|
|
|
|
||||||||
|
|
|
|
Source: company data, Gazprombank estimates
In relation to the estimated FCF profile of covered generators, we highlight the following:
positive FCF territory reached by all covered thermal generators:
-RusHydro (which is predominantly a hydro generator) is on track to become FCF-positive in 2019 (based on current capex guidance by the company).
FCFY-to-CoE premium not yet reached by some covered thermal generators:
-Enel Russia’s FCFY can descend below its CoE in 2019 due to capex associated with the construction of wind-powered capacity.
20