

GPB_Russian Utilities Initiation_231118_watermark
.pdfvk.com/id446425943
NOVEMBER 23, 2018 RUSSIA > EQUITY RESEARCH > UTILITIES
Table 9. Mosenergo forecast (IFRS based) and valuation, RUB bln or RUB per share
P&L (IFRS), RUB bln: Mosenergo |
2013 |
2014 |
2015 |
2016 |
2017 |
2018E |
2019E |
2020E |
2021E |
2022E |
2023E |
2024E |
2025E |
2026E |
TV'2027 |
Revenue electricity: old |
62.8 |
63.9 |
60.9 |
63.8 |
64.9 |
64.9 |
66.6 |
68.9 |
72.7 |
74.9 |
77.1 |
79.2 |
81.3 |
84.0 |
|
Revenue electicity: new |
19.1 |
19.6 |
24.4 |
37.0 |
44.0 |
38.6 |
29.9 |
32.9 |
31.9 |
32.4 |
33.0 |
27.8 |
25.3 |
26.1 |
|
Revenue electricity |
82.0 |
83.5 |
85.2 |
100.7 |
108.9 |
103.5 |
96.5 |
101.7 |
104.6 |
107.4 |
110.1 |
107.1 |
106.6 |
110.1 |
|
Heat revenue |
61.2 |
65.5 |
69.9 |
77.9 |
75.2 |
79.3 |
79.9 |
80.4 |
80.9 |
81.3 |
81.6 |
81.7 |
81.6 |
82.3 |
|
Revenue other (incl. reselling) |
12.8 |
15.0 |
16.0 |
12.0 |
12.0 |
12.4 |
10.0 |
8.2 |
6.8 |
5.7 |
4.8 |
4.1 |
3.5 |
3.1 |
|
Revenue (before subsidies) |
155.9 |
164.0 |
171.2 |
190.7 |
196.1 |
195.2 |
186.4 |
190.3 |
192.3 |
194.3 |
196.5 |
192.8 |
191.7 |
195.5 |
|
Subsidies |
0.0 |
0.0 |
0.0 |
0.0 |
0.0 |
0.0 |
0.0 |
0.0 |
0.0 |
0.0 |
0.0 |
0.0 |
0.0 |
0.0 |
|
Revenue |
155.9 |
164.0 |
171.2 |
190.7 |
196.1 |
195.2 |
186.4 |
190.3 |
192.3 |
194.3 |
196.5 |
192.8 |
191.7 |
195.5 |
|
Fuel costs electricity, old |
(53.8) |
(57.4) |
(56.2) |
(62.6) |
(61.1) |
(64.5) |
(65.2) |
(65.7) |
(66.8) |
(68.0) |
(69.1) |
(70.1) |
(71.1) |
(72.9) |
|
Fuel costs heat, old |
(28.0) |
(29.9) |
(29.2) |
(32.6) |
(31.8) |
(33.6) |
(33.9) |
(34.2) |
(34.8) |
(35.4) |
(35.9) |
(36.5) |
(37.0) |
(37.9) |
|
Fuel costs, new |
(7.6) |
(8.4) |
(10.9) |
(15.1) |
(15.0) |
(16.1) |
(16.4) |
(16.8) |
(17.3) |
(17.8) |
(18.3) |
(18.8) |
(19.3) |
(19.8) |
|
Fuel costs,old and new |
(89.4) |
(95.7) |
(96.3) |
(110.2) |
(107.8) |
(114.2) |
(115.5) |
(116.7) |
(118.8) |
(121.1) |
(123.3) |
(125.4) |
(127.4) |
(130.6) |
|
Purchased power & Re-selling |
(9.4) |
(8.6) |
(8.8) |
(9.6) |
(10.0) |
(10.5) |
(8.7) |
(7.3) |
(6.1) |
(5.2) |
(4.5) |
(3.9) |
(3.3) |
(2.9) |
|
Heat transportation |
(7.6) |
(7.3) |
(6.5) |
(4.0) |
(1.9) |
(0.9) |
(0.9) |
(0.9) |
(0.9) |
(1.0) |
(1.0) |
(1.0) |
(1.0) |
(1.0) |
|
Water payment |
0.0 |
0.0 |
0.0 |
0.0 |
0.0 |
0.0 |
0.0 |
0.0 |
0.0 |
0.0 |
0.0 |
0.0 |
0.0 |
0.0 |
|
Gross profit |
49.5 |
52.4 |
59.5 |
66.9 |
76.3 |
69.6 |
61.3 |
65.4 |
66.4 |
67.1 |
67.7 |
62.6 |
60.0 |
61.0 |
|
Non-fuel Opex: Old plants |
(21.0) |
(24.6) |
(25.3) |
(23.4) |
(23.1) |
(23.9) |
(25.0) |
(26.1) |
(27.1) |
(28.1) |
(29.0) |
(29.8) |
(30.5) |
(31.1) |
|
Non-fuel Opex: new plants |
(2.6) |
(2.8) |
(3.8) |
(5.0) |
(5.2) |
(5.5) |
(5.8) |
(6.0) |
(6.3) |
(6.5) |
(6.7) |
(6.9) |
(7.1) |
(7.5) |
|
Cost of subsidies |
0.0 |
0.0 |
0.0 |
0.0 |
0.0 |
0.0 |
0.0 |
0.0 |
0.0 |
0.0 |
0.0 |
0.0 |
0.0 |
0.0 |
|
Non-fuel Opex |
(23.5) |
(27.4) |
(29.2) |
(28.3) |
(28.4) |
(29.4) |
(30.8) |
(32.1) |
(33.4) |
(34.6) |
(35.8) |
(36.8) |
(37.6) |
(38.7) |
|
EBITDA, old plants |
13.5 |
10.2 |
13.5 |
19.2 |
22.3 |
21.3 |
21.5 |
22.3 |
24.0 |
23.9 |
23.7 |
23.5 |
23.3 |
23.5 |
|
EBITDA, new plants |
9.0 |
8.5 |
9.6 |
16.9 |
23.8 |
17.0 |
7.7 |
10.1 |
8.3 |
8.1 |
7.9 |
2.1 |
(1.1) |
(1.2) |
|
EBITDA, reselling / other |
3.5 |
6.4 |
7.3 |
2.5 |
1.9 |
1.9 |
1.3 |
0.9 |
0.6 |
0.5 |
0.3 |
0.2 |
0.2 |
0.1 |
|
EBITDA |
26.0 |
25.1 |
30.3 |
38.6 |
48.0 |
40.2 |
30.5 |
33.3 |
32.9 |
32.4 |
32.0 |
25.9 |
22.4 |
22.3 |
|
Depreciation: Old plants |
(11.5) |
(12.1) |
(14.5) |
(10.7) |
(10.7) |
(10.9) |
(10.9) |
(10.9) |
(10.9) |
(10.9) |
(10.9) |
(10.9) |
(10.9) |
(10.9) |
|
Depreciation: New plants |
(2.5) |
(3.4) |
(4.1) |
(4.4) |
(4.4) |
(4.4) |
(4.4) |
(4.4) |
(4.4) |
(4.4) |
(4.4) |
(4.4) |
(4.4) |
(4.4) |
|
Depreciation |
(14.0) |
(15.5) |
(18.6) |
(15.1) |
(15.1) |
(15.2) |
(15.2) |
(15.2) |
(15.2) |
(15.2) |
(15.2) |
(15.2) |
(15.2) |
(15.2) |
|
EBIT |
12.0 |
9.6 |
11.7 |
23.5 |
32.9 |
25.0 |
15.3 |
18.1 |
17.7 |
17.2 |
16.8 |
10.6 |
7.1 |
7.1 |
|
Finance (costs) / income |
0.5 |
1.4 |
(1.9) |
4.4 |
1.3 |
1.1 |
1.6 |
2.4 |
3.4 |
4.2 |
4.8 |
5.2 |
5.3 |
5.2 |
|
One-offs (cash) |
0.0 |
0.0 |
0.0 |
(0.0) |
1.2 |
0.0 |
0.0 |
0.0 |
0.0 |
0.0 |
0.0 |
0.0 |
0.0 |
0.0 |
|
One-offs (non-cash): operational |
(2.2) |
(8.0) |
(12.2) |
(6.9) |
(4.9) |
(3.7) |
(1.8) |
(0.9) |
(0.5) |
(0.2) |
(0.1) |
(0.1) |
(0.0) |
(0.0) |
|
One-offs (non-cash): financial |
(1.2) |
(6.3) |
0.0 |
0.0 |
0.0 |
0.0 |
0.0 |
0.0 |
0.0 |
0.0 |
0.0 |
0.0 |
0.0 |
0.0 |
|
EBT |
9.2 |
(3.3) |
(2.4) |
20.9 |
30.5 |
22.5 |
15.1 |
19.6 |
20.6 |
21.2 |
21.4 |
15.8 |
12.4 |
12.3 |
|
Income tax |
(1.7) |
0.2 |
0.6 |
(7.4) |
(5.7) |
(4.7) |
(3.2) |
(4.1) |
(4.3) |
(4.4) |
(4.5) |
(3.3) |
(2.6) |
(2.6) |
|
Net profit (pre-minorities) |
7.5 |
(3.1) |
(1.8) |
13.5 |
24.8 |
17.7 |
11.9 |
15.5 |
16.3 |
16.7 |
16.9 |
12.5 |
9.8 |
9.7 |
|
Minority |
0.0 |
0.0 |
0.0 |
0.0 |
0.0 |
0.0 |
0.0 |
0.0 |
0.0 |
0.0 |
0.0 |
0.0 |
0.0 |
0.0 |
|
Net profit (reported) |
7.5 |
(3.1) |
(1.8) |
13.5 |
24.8 |
17.7 |
11.9 |
15.5 |
16.3 |
16.7 |
16.9 |
12.5 |
9.8 |
9.7 |
|
Net profit (adj) |
10.2 |
10.2 |
7.7 |
22.0 |
27.0 |
20.6 |
13.3 |
16.2 |
16.7 |
16.9 |
17.0 |
12.5 |
9.8 |
9.7 |
|
Leverage, RUB bn |
|
|
|
|
|
|
|
|
|
|
|
|
|
|
TV'2027 |
Net (Debt) / Cash (year end) |
(24) |
(39) |
(43) |
(18) |
(3) |
19 |
29 |
41 |
51 |
58 |
64 |
64 |
64 |
65 |
(45) |
Net Debt or (Cash) / EBITDA (year end) |
0.9 |
1.6 |
1.4 |
0.5 |
0.1 |
(0.5) |
(1.0) |
(1.2) |
(1.5) |
(1.8) |
(2.0) |
(2.5) |
(2.8) |
(2.9) |
2.0 |
Multiples |
|
|
` |
|
|
|
|
|
|
|
|
|
|
|
|
FCF Yield |
-13% |
10% |
-4% |
37% |
39% |
32% |
21% |
24% |
23% |
23% |
22% |
14% |
9% |
8% |
|
|
|||||||||||||||
DY |
2% |
2% |
3% |
5% |
10% |
7% |
5% |
9% |
10% |
12% |
12% |
9% |
7% |
7% |
|
EV/EBITDA |
3.5 |
4.0 |
3.6 |
2.6 |
1.6 |
1.6 |
1.7 |
1.3 |
1.1 |
1.0 |
0.9 |
1.0 |
1.1 |
1.1 |
|
PE (adj) |
6.7 |
6.6 |
8.8 |
3.1 |
2.5 |
3.3 |
5.1 |
4.2 |
4.1 |
4.0 |
4.0 |
5.4 |
6.9 |
7.0 |
|
Dividend, RUB / s |
|
|
|
|
|
|
|
|
|
|
|
|
|
|
TV'2027 |
DPS: regular |
0.04 |
0.03 |
0.06 |
0.08 |
0.17 |
0.11 |
0.09 |
0.15 |
0.18 |
0.21 |
0.21 |
0.16 |
0.12 |
0.12 |
0.98 |
DPS: special (leverage optimization) |
|
|
|
|
|
|
|
|
|
|
|
|
|
|
2.75 |
DPS: special (non-core assets sale) |
|
|
|
|
|
|
|
|
|
|
|
|
|
|
- |
DPS: total |
0.04 |
0.03 |
0.06 |
0.08 |
0.17 |
0.11 |
0.09 |
0.15 |
0.18 |
0.21 |
0.21 |
0.16 |
0.12 |
0.12 |
3.73 |
Dividend / Net profit (nominal) |
21% |
0% |
0% |
25% |
27% |
25% |
31% |
37% |
44% |
50% |
50% |
50% |
50% |
50% |
|
Dividend / Net profit (adj) |
16% |
12% |
29% |
15% |
24% |
22% |
28% |
36% |
43% |
49% |
50% |
50% |
50% |
50% |
|
Dividend / FCF |
neg |
18% |
neg |
13% |
25% |
21% |
26% |
35% |
45% |
55% |
57% |
66% |
83% |
86% |
|
Cash Flow, RUB bn |
|
|
|
|
|
|
|
|
|
|
|
|
|
|
TV'2027 |
NOPAT: old plants |
1.7 |
(1.9) |
(1.0) |
6.7 |
9.1 |
8.3 |
8.4 |
9.1 |
10.4 |
10.3 |
10.2 |
10.0 |
9.8 |
9.9 |
|
NOPAT: new |
5.3 |
4.7 |
4.4 |
9.9 |
15.3 |
10.0 |
2.7 |
4.5 |
3.1 |
3.0 |
2.8 |
(2.3) |
(5.5) |
(5.6) |
|
NOPAT: reselling / other |
2.8 |
6.0 |
5.7 |
1.9 |
1.5 |
1.5 |
1.0 |
0.7 |
0.5 |
0.4 |
0.3 |
0.2 |
0.1 |
0.1 |
|
NOPAT |
9.8 |
8.8 |
9.1 |
18.6 |
26.0 |
19.8 |
12.1 |
14.3 |
14.0 |
13.6 |
13.2 |
7.9 |
4.5 |
4.4 |
|
CapEx: Maintenance |
0.0 |
0.0 |
(7.7) |
(8.2) |
(11.0) |
(13.5) |
(13.0) |
(13.2) |
(13.3) |
(13.5) |
(13.6) |
(13.8) |
(13.9) |
(14.0) |
|
CapEx: New |
(27.8) |
(17.8) |
(15.4) |
0.0 |
(4.2) |
0.0 |
0.0 |
0.0 |
0.0 |
0.0 |
0.0 |
0.0 |
0.0 |
0.0 |
|
CapEx |
(27.8) |
(17.8) |
(23.1) |
(8.2) |
(15.2) |
(13.5) |
(13.0) |
(13.2) |
(13.3) |
(13.5) |
(13.6) |
(13.8) |
(13.9) |
(14.0) |
|
Working Capital Red./ (Incr.) |
(5.0) |
0.0 |
(7.1) |
0.0 |
0.0 |
0.0 |
0.0 |
0.0 |
0.0 |
0.0 |
0.0 |
0.0 |
0.0 |
0.0 |
|
FCF; old plants |
8.2 |
10.2 |
(1.4) |
9.2 |
8.8 |
5.6 |
6.3 |
6.8 |
7.9 |
7.6 |
7.4 |
7.1 |
6.8 |
6.8 |
58.8 |
FCF; new plants |
(20.0) |
(9.7) |
(7.0) |
14.3 |
15.5 |
14.3 |
7.0 |
8.9 |
7.5 |
7.3 |
7.2 |
2.1 |
(1.1) |
(1.2) |
35.5 |
FCF: reselling / other |
2.8 |
6.0 |
5.7 |
1.9 |
1.5 |
1.5 |
1.0 |
0.7 |
0.5 |
0.4 |
0.3 |
0.2 |
0.1 |
0.1 |
0.7 |
FCF: cash one-offs |
0.0 |
0.0 |
0.0 |
(0.0) |
1.0 |
0.0 |
0.0 |
0.0 |
0.0 |
0.0 |
0.0 |
0.0 |
0.0 |
0.0 |
|
FCF (to EV) |
(9.0) |
6.5 |
(2.6) |
25.4 |
26.8 |
21.5 |
14.3 |
16.4 |
15.9 |
15.3 |
14.8 |
9.4 |
5.9 |
5.7 |
95.0 |
Interest (CF) |
0.3 |
0.3 |
0.0 |
0.0 |
0.0 |
0.0 |
0.0 |
0.0 |
0.0 |
0.0 |
0.0 |
0.0 |
0.0 |
0.0 |
|
FCF (to Equity) |
(8.7) |
6.7 |
(2.6) |
25.5 |
26.8 |
21.5 |
14.3 |
16.4 |
15.9 |
15.3 |
14.8 |
9.4 |
5.9 |
5.7 |
|
Discounting parameters |
|
|
|
|
|
|
|
|
|
|
|
|
|
|
|
Period for discounting, years |
DCF |
|
|
|
|
(1.4) |
(0.4) |
0.6 |
1.6 |
2.6 |
3.6 |
4.6 |
5.6 |
6.6 |
0.6 |
|
DDM |
|
|
|
|
(0.4) |
0.6 |
1.6 |
2.6 |
3.6 |
4.6 |
5.6 |
6.6 |
7.6 |
1.6 |
Discounting factor |
DCF |
|
|
|
|
|
1.03 |
0.93 |
0.81 |
0.72 |
0.63 |
0.56 |
0.49 |
0.43 |
0.38 |
|
DDM |
|
|
|
|
1.03 |
0.91 |
0.79 |
0.68 |
0.59 |
0.50 |
0.44 |
0.38 |
0.32 |
0.28 |
DCF |
|
|
|
|
|
|
|
|
|
|
|
|
|
|
|
DCF: Old plants |
|
|
|
|
|
|
6.4 |
6.3 |
6.4 |
5.5 |
4.7 |
4.0 |
3.3 |
2.9 |
22.3 |
DCF: New plants |
|
|
|
|
|
|
7.2 |
8.2 |
6.1 |
5.3 |
4.5 |
1.2 |
(0.5) |
(0.5) |
13.5 |
DCF: Reselling / other |
|
|
|
|
|
|
1.1 |
0.7 |
0.4 |
0.3 |
0.2 |
0.1 |
0.1 |
0.0 |
0.3 |
DCF: total |
|
|
|
|
|
|
14.7 |
15.1 |
12.9 |
11.0 |
9.4 |
5.2 |
2.9 |
2.4 |
36.1 |
|
|
|
|
|
|
|
|
|
|
|
|
|
|
|
|
TP (DCF), RUB bln or RUB/s |
|
|
TP (w-average, rounded), RUB/s |
|
|
|
|
Valuation parameters |
|
DDM |
DCF |
Other |
|||
EV, RUB bln |
110 |
|
TP |
|
RUB/s |
Weight |
|
|
|
CoE |
|
|
16.0% |
|
|
Non-core assets |
- |
|
DDM |
|
1.90 |
60% |
|
DDM is a floor for PT |
WACC |
|
|
|
13.6% |
|
|
Net (debt) / Cash (discounted), end 2018 |
13 |
|
DCF |
|
3.10 |
40% |
|
|
|
TG (Dividends) |
|
|
3.5% |
|
|
Equity, RUB bln |
123 |
|
Result (rounded) |
2.40 |
100% |
|
|
|
TG (FCF): "old" assets |
|
|
2.0% |
0.0% |
||
# of shares: current |
40 |
|
|
|
|
|
|
|
|
TG (FCF): "new" assets |
|
|
2.0% |
|
|
# of shares: Ord: New |
- |
|
|
|
|
|
|
|
|
|
|
|
|
|
|
# of shares: Ord |
40 |
|
|
|
|
|
|
|
|
|
|
|
|
|
|
# of shares: Ord: treasury |
- |
|
|
|
|
|
|
|
|
|
|
|
|
|
|
# of shares: Pref |
- |
|
|
|
|
|
|
|
|
|
|
|
|
|
|
# of shares: effective, total |
40 |
|
|
|
|
|
|
|
|
|
|
|
|
|
|
TP (DCF), RUB |
3.08 |
|
|
|
|
|
|
|
|
|
|
|
|
|
|
Source: company data, Gazprombank estimates
41
vk.com/id446425943
NOVEMBER 23, 2018 |
RUSSIA > EQUITY RESEARCH > UTILITIES |
|
|
INITIATION OF COVERAGE
TGK-1
RU
SSI
FCFY-to-CoE premium is sustainable until 2022, but the need to upgrade heat network adds uncertainty
TGK-1 should deliver a FCFY-to-CoE premium until 2022 with a decline in 2023 due to CSA expirations. Potential capex needs for St. Petersburg Heat network is a source of additional uncertainty.
Operations
Key regional provider of electrical and heat energy in St. Petersburg and surrounding regions (electrical capacity ~7 GW) with a high (>40%) proportion of hydro capacity.
Positives
High share of hydro generation within total capacity (~3 GW out of ~7 GW).
FCF-to-CoE premium in 2018-22, partially on the back of the start of CSA uplift for selected units.
Potential increase in dividend payout (from ~25% of 2017 IFRS net income) on the back of premium FCF starting from 2018 and no net debt starting from end 2019.
Presence of Fortum as a blocking shareholder reduces corporate governance risks.
Possible sale of St. Petersburg Heat Network could limit upside risk to capex.
Potential beneficiary of the change in heat regulation ("alternative boiler shop").
Negatives
Modest historical dividend payout, e.g. ~25% of 2017 IFRS net income paid as dividends.
FCFY to decline after 2020 with the expiration of CSAs at South CHP (Dec. 2020), Pervomai CHP (June 2020, Dec. 2021) and Pravoberezh CHP (Dec. 2022).
Uncertaintly to medium-term capex due to the potential needs to upgrade St. Petersburg Heat Network.
Uncertain progress in the attempted sale of St. Petersburg Heat Network.
Valuation (2018-2026)
FCFY-to-CoE premium: 2018-22.
DY-to-CoD premium: 2019-20, 2022.
Note: Share prices as of closure 20-Nov-2018
TICKER |
TGKA RX |
Currency |
RUB |
|
|
Target price |
0.010 |
Upside |
16% |
|
|
Recommendation |
Neutral |
MCap, bln |
33 |
|
|
Share price |
0.009 |
52-week high |
0.013 |
|
|
52-week low |
0.009 |
|
|
Source: Bloomberg, Gazprombank estimates
|
SHAREHOLDERS |
|
|
|
|
|
|
|
|
||
|
|
Gazprom |
51.8% |
|
|
|
|
Energoholding |
|
||
|
|
|
|
||
|
|
Fortum |
|
29.5% |
|
|
|
Free-float |
19.7% |
|
|
|
|
|
|
|
|
Source: company data
12M PRICE PERFORMANCE |
|
||||
140% |
|
|
|
|
|
120% |
|
|
|
|
|
100% |
|
|
|
|
|
80% |
|
|
|
|
|
60% |
|
MOEX INDEX |
|
|
|
|
TGKA |
|
|
|
|
|
|
|
|
|
|
40% |
Jan-18 |
Mar-18 |
May-18 |
Jul-18 |
|
Nov-17 |
Sep-18 |
||||
Source: Bloomberg
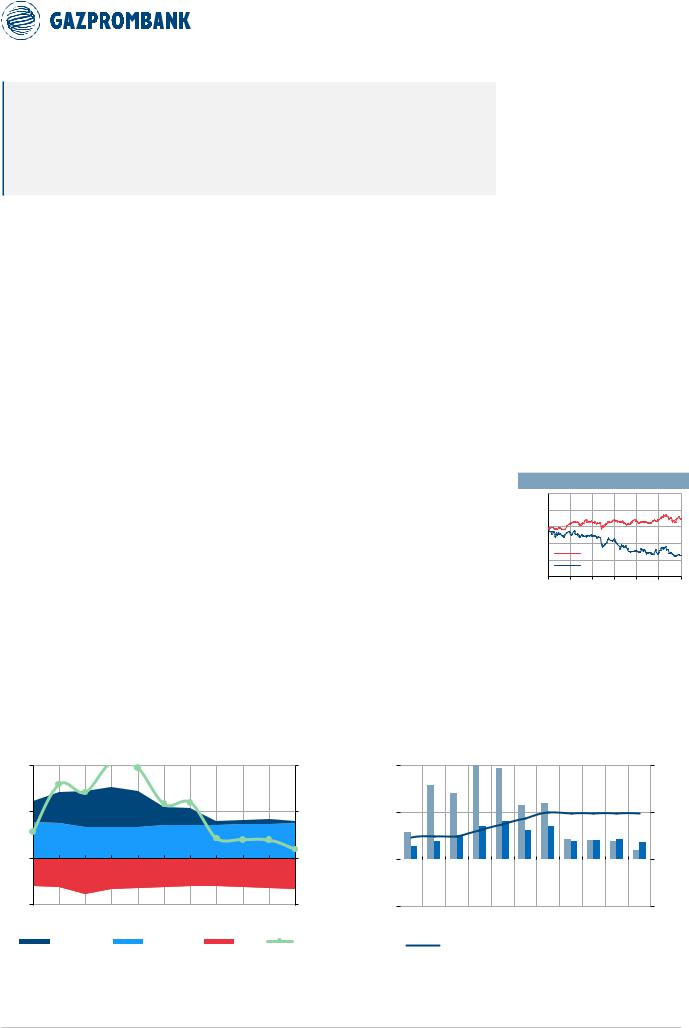
Chart 53. TGK-1: FCF profile |
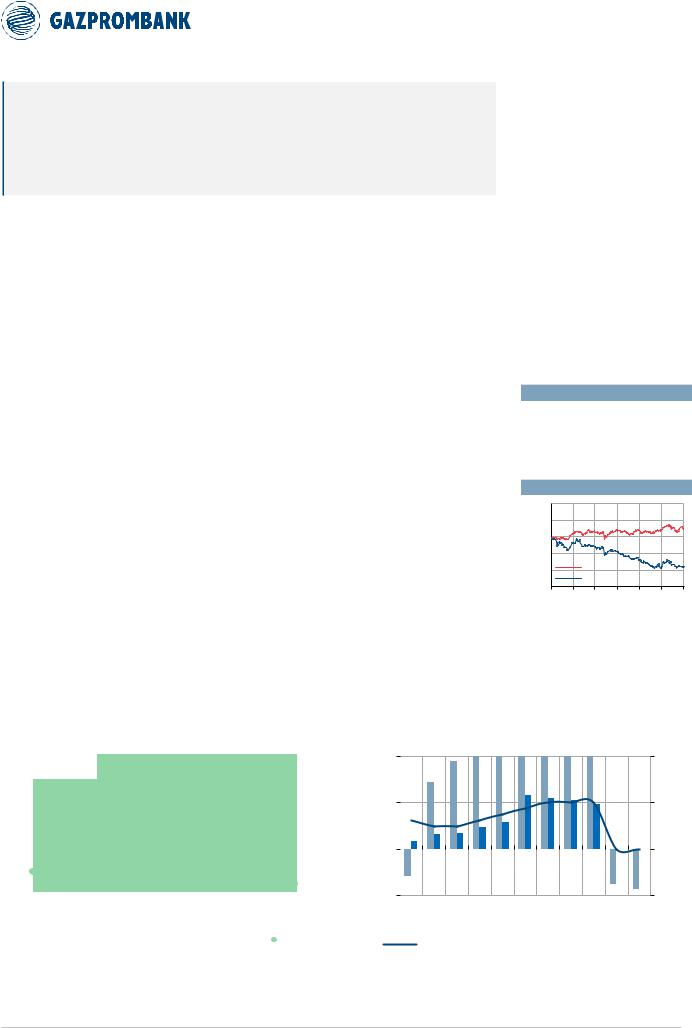
Chart 54. TGK-1: FCFY and DY profile |
EBITDA (lhs), capex (lhs), FCFY (rhs) |
FCFY (lhs), DY (lhs) and dividend payout vs IFRS net profit (rhs) |
30 |
EBITDA, Capex |
|
|
|
|
|
|
FCFY |
30% |
30% |
||
|
|
|
|
|
|
|
|
|
||||
|
RUB bln |
|
|
|
|
|
|
|
(line) |
|
|
|
15 |
|
|
|
|
|
|
|
|
|
|
15% |
15% |
0 |
|
|
|
|
|
|
|
|
|
|
0% |
0% |
-15 |
|
|
|
|
|
|
|
|
|
|
-15% |
-15% |
|
2016 |
2017 |
2018E |
2019E |
2020E |
2021E |
2022E |
2023E |
2024E |
2025E |
2026E |
|
|
|
EBITDA ("NEW") |
|
EBITDA ("OLD") |
|
CAPEX |
|
FCFY |
|
|||
|
FCFY and DY |
|
|
|
|
|
|
|
Dividend |
|
100% |
||||
|
|
|
|
|
|
|
|
|
|||||||
|
|
|
|
|
|
|
|
|
|
||||||
|
(columns) |
|
|
|
|
|
|
|
|
payout (line) |
|
|
|||
|
|
|
|
|
|
|
|
|
|
|
|
|
|
|
50% |
|
|
|
|
|
|
|
|
|
|
|
|
|
|
|
0% |
|
2016 |
2017 |
2018E |
2019E |
2020E |
2021E |
2022E |
2023E |
2024E |
2025E |
2026E |
|
|||
|
|
|
|||||||||||||
|
|
|
|
|
|
|
|
|
|
|
|
|
|
|
-50% |
|
|
|
|
|
|
|
|
|
|
|
|
|
|
|
|
|
|
|
|
FCF YIELD (LHS) |
|
|
|
|
DIVIDEND YIELD (LHS) |
||||||
|
|
|
|
|
|
|
|
||||||||
|
|
|
|
|
|
|
|
||||||||
|
|
|
|
DIVIDEND PAYOUT (RHS) |
|
|
|
|
|
|
|
|
|||
Source: company data, Gazprombank estimates |
Source: company data, Gazprombank estimates |
42

vk.com/id446425943
NOVEMBER 23, 2018 RUSSIA > EQUITY RESEARCH > UTILITIES
Table 10. TGK-1 forecast (IFRS-based) and valuation, RUB bln or RUB per share
P&L (IFRS), RUB bln: TGK-1 |
2013 |
2014 |
2015 |
2016 |
2017 |
2018E |
2019E |
2020E |
2021E |
2022E |
2023E |
2024E |
2025E |
2026E |
TV'2027 |
Revenue electricity: old |
21.8 |
20.7 |
19.7 |
22.4 |
23.3 |
25.3 |
26.1 |
27.2 |
28.8 |
30.0 |
31.2 |
32.4 |
33.6 |
34.9 |
|
Revenue electicity: new |
15.6 |
14.0 |
13.1 |
15.4 |
20.3 |
22.6 |
24.5 |
23.3 |
17.9 |
18.2 |
14.2 |
14.7 |
15.2 |
14.7 |
|
Revenue electricity |
37.4 |
34.7 |
32.9 |
37.8 |
43.6 |
47.9 |
50.6 |
50.6 |
46.8 |
48.1 |
45.5 |
47.1 |
48.8 |
49.6 |
|
Heat revenue |
26.0 |
27.7 |
29.6 |
33.7 |
35.3 |
35.5 |
35.8 |
36.2 |
36.5 |
36.8 |
37.0 |
37.2 |
37.3 |
37.7 |
|
Revenue other (incl. reselling) |
6.1 |
6.1 |
6.0 |
7.1 |
8.4 |
8.7 |
6.7 |
5.2 |
4.1 |
3.3 |
2.6 |
2.1 |
1.8 |
1.5 |
|
Revenue (before subsidies) |
69.4 |
68.4 |
68.5 |
78.6 |
87.3 |
92.1 |
93.1 |
91.9 |
87.4 |
88.2 |
85.1 |
86.5 |
87.8 |
88.8 |
|
Subsidies |
0.4 |
0.6 |
0.9 |
0.3 |
0.1 |
0.1 |
0.1 |
0.1 |
0.1 |
0.1 |
0.1 |
0.1 |
0.1 |
0.1 |
|
Revenue |
69.9 |
69.0 |
69.4 |
78.9 |
87.4 |
92.1 |
93.2 |
92.0 |
87.4 |
88.3 |
85.2 |
86.6 |
87.9 |
88.9 |
|
Fuel costs electricity, old |
(10.8) |
(10.4) |
(9.6) |
(10.7) |
(11.4) |
(12.5) |
(12.7) |
(12.8) |
(13.1) |
(13.3) |
(13.6) |
(13.8) |
(14.1) |
(14.4) |
|
Fuel costs heat, old |
(12.8) |
(12.4) |
(11.4) |
(12.7) |
(13.5) |
(14.8) |
(15.0) |
(15.1) |
(15.4) |
(15.7) |
(16.0) |
(16.2) |
(16.5) |
(16.9) |
|
Fuel costs, new |
(5.9) |
(5.8) |
(5.4) |
(6.1) |
(7.1) |
(7.9) |
(8.1) |
(8.3) |
(8.6) |
(8.9) |
(9.2) |
(9.5) |
(9.7) |
(10.0) |
|
Fuel costs,old and new |
(29.5) |
(28.5) |
(26.4) |
(29.5) |
(31.9) |
(35.2) |
(35.8) |
(36.3) |
(37.1) |
(37.9) |
(38.7) |
(39.5) |
(40.3) |
(41.4) |
|
Purchased power & Re-selling |
(5.4) |
(5.5) |
(5.8) |
(6.2) |
(7.1) |
(7.3) |
(5.7) |
(4.6) |
(3.7) |
(3.0) |
(2.4) |
(2.0) |
(1.7) |
(1.4) |
|
Heat transportation |
(0.6) |
(1.2) |
(2.0) |
(2.1) |
(2.6) |
(2.7) |
(2.7) |
(2.8) |
(2.8) |
(2.8) |
(2.8) |
(2.8) |
(2.9) |
(2.9) |
|
Water payment |
(2.2) |
(2.3) |
(2.4) |
(2.6) |
(2.7) |
(2.9) |
(3.0) |
(3.1) |
(3.2) |
(3.4) |
(3.5) |
(3.6) |
(3.7) |
(3.7) |
|
Gross profit |
32.0 |
31.4 |
32.8 |
38.5 |
43.1 |
44.1 |
46.0 |
45.3 |
40.6 |
41.2 |
37.7 |
38.6 |
39.5 |
39.5 |
|
Non-fuel Opex: Old plants |
(12.5) |
(13.4) |
(13.0) |
(16.5) |
(17.4) |
(17.9) |
(18.7) |
(19.5) |
(20.3) |
(21.1) |
(21.7) |
(22.3) |
(22.9) |
(23.3) |
|
Non-fuel Opex: new plants |
(2.3) |
(2.4) |
(2.5) |
(2.7) |
(3.0) |
(3.1) |
(3.3) |
(3.4) |
(3.6) |
(3.7) |
(3.9) |
(4.0) |
(4.1) |
(4.3) |
|
Cost of subsidies |
0.0 |
0.0 |
0.0 |
0.0 |
0.0 |
0.0 |
0.0 |
0.0 |
0.0 |
0.0 |
0.0 |
0.0 |
0.0 |
0.0 |
|
Non-fuel Opex |
(14.8) |
(15.8) |
(15.5) |
(19.1) |
(20.4) |
(21.0) |
(22.0) |
(23.0) |
(23.9) |
(24.8) |
(25.6) |
(26.3) |
(26.9) |
(27.6) |
|
EBITDA, old plants |
8.8 |
8.7 |
11.0 |
11.6 |
11.1 |
10.0 |
9.9 |
10.0 |
10.5 |
10.5 |
10.6 |
10.8 |
10.9 |
11.3 |
|
EBITDA, new plants |
7.4 |
5.9 |
5.2 |
6.6 |
10.2 |
11.5 |
13.0 |
11.6 |
5.7 |
5.5 |
1.2 |
1.3 |
1.4 |
0.4 |
|
EBITDA, reselling / other |
1.1 |
1.1 |
1.1 |
1.2 |
1.4 |
1.5 |
1.0 |
0.7 |
0.5 |
0.4 |
0.3 |
0.2 |
0.2 |
0.1 |
|
EBITDA |
17.2 |
15.6 |
17.3 |
19.4 |
22.7 |
23.1 |
23.9 |
22.3 |
16.7 |
16.4 |
12.1 |
12.3 |
12.5 |
11.9 |
|
Depreciation: Old plants |
(3.9) |
(4.1) |
(4.6) |
(5.1) |
(5.9) |
(5.4) |
(5.4) |
(5.4) |
(5.4) |
(5.4) |
(5.4) |
(5.4) |
(5.4) |
(5.4) |
|
Depreciation: New plants |
(2.3) |
(2.5) |
(2.6) |
(2.6) |
(2.6) |
(2.6) |
(2.6) |
(2.6) |
(2.6) |
(2.6) |
(2.6) |
(2.6) |
(2.6) |
(2.6) |
|
Depreciation |
(6.2) |
(6.6) |
(7.2) |
(7.7) |
(8.4) |
(8.0) |
(8.0) |
(8.0) |
(8.0) |
(8.0) |
(8.0) |
(8.0) |
(8.0) |
(8.0) |
|
EBIT |
11.0 |
9.1 |
10.1 |
11.7 |
14.3 |
15.1 |
15.9 |
14.3 |
8.7 |
8.4 |
4.1 |
4.3 |
4.5 |
3.9 |
|
Finance (costs) / income |
(2.0) |
(2.6) |
(2.6) |
(2.1) |
(1.5) |
(0.7) |
(0.5) |
0.1 |
0.6 |
0.8 |
1.0 |
0.9 |
0.9 |
0.9 |
|
One-offs (cash) |
0.0 |
0.0 |
0.0 |
0.0 |
0.0 |
0.0 |
0.0 |
0.0 |
0.0 |
0.0 |
0.0 |
0.0 |
0.0 |
0.0 |
|
One-offs (non-cash): operational |
(1.1) |
(2.6) |
(0.1) |
(3.1) |
(2.2) |
(1.6) |
(0.8) |
(0.4) |
(0.2) |
(0.1) |
(0.1) |
(0.0) |
(0.0) |
(0.0) |
|
One-offs (non-cash): financial |
0.0 |
0.0 |
0.0 |
0.0 |
0.0 |
0.0 |
0.0 |
0.0 |
0.0 |
0.0 |
0.0 |
0.0 |
0.0 |
0.0 |
|
EBT |
7.9 |
3.9 |
7.5 |
6.5 |
10.6 |
12.7 |
14.5 |
14.0 |
9.1 |
9.0 |
5.0 |
5.1 |
5.4 |
4.7 |
|
Income tax |
(0.7) |
0.8 |
(0.8) |
(0.9) |
(2.6) |
(2.8) |
(3.0) |
(2.9) |
(1.9) |
(1.9) |
(1.0) |
(1.1) |
(1.1) |
(1.0) |
|
Net profit (pre-minorities) |
7.2 |
4.7 |
6.7 |
5.6 |
8.0 |
10.0 |
11.5 |
11.1 |
7.2 |
7.2 |
4.0 |
4.1 |
4.3 |
3.7 |
|
Minority |
0.0 |
(0.3) |
0.2 |
0.1 |
(0.3) |
0.0 |
(0.1) |
(0.2) |
(0.1) |
(0.1) |
(0.0) |
(0.0) |
(0.0) |
(0.0) |
|
Net profit (reported) |
7.2 |
4.5 |
6.9 |
5.7 |
7.7 |
10.0 |
11.4 |
10.9 |
7.1 |
7.1 |
3.9 |
4.0 |
4.2 |
3.7 |
|
Net profit (adj) |
7.3 |
6.3 |
5.3 |
7.4 |
10.1 |
11.3 |
12.1 |
11.3 |
7.3 |
7.2 |
4.0 |
4.0 |
4.2 |
3.7 |
|
Leverage, RUB bn |
|
|
|
|
|
|
|
|
|
|
|
|
|
|
TV'2027 |
Net (Debt) / Cash (year end) |
(33) |
(28) |
(28) |
(24) |
(18) |
(7) |
1 |
8 |
9 |
12 |
11 |
11 |
11 |
10 |
(24) |
Net Debt or (Cash) / EBITDA (year end) |
1.9 |
1.8 |
1.6 |
1.2 |
0.8 |
0.3 |
(0.1) |
(0.3) |
(0.6) |
(0.7) |
(0.9) |
(0.9) |
(0.9) |
(0.8) |
2.0 |
Multiples |
|
|
` |
|
|
|
|
|
|
|
|
|
|
|
|
FCF Yield |
7% |
11% |
4% |
8% |
24% |
21% |
31% |
29% |
17% |
18% |
6% |
6% |
6% |
3% |
|
|
|||||||||||||||
DY |
2% |
1% |
3% |
4% |
6% |
7% |
11% |
12% |
9% |
11% |
6% |
6% |
6% |
5% |
|
EV/EBITDA |
3.8 |
4.0 |
3.5 |
3.0 |
2.4 |
2.0 |
1.5 |
1.4 |
1.6 |
1.6 |
2.1 |
2.1 |
2.1 |
2.2 |
|
PE (adj) |
4.5 |
5.3 |
6.3 |
4.5 |
3.3 |
2.9 |
2.7 |
2.9 |
4.5 |
4.6 |
8.4 |
8.3 |
7.9 |
9.0 |
|
Dividend, RUB / s |
|
|
|
|
|
|
|
|
|
|
|
|
|
|
TV'2027 |
DPS: regular |
0.00 |
0.00 |
0.00 |
0.00 |
0.00 |
0.00 |
0.00 |
0.00 |
0.00 |
0.00 |
0.00 |
0.00 |
0.00 |
0.00 |
0.00 |
DPS: special (leverage optimization) |
|
|
|
|
|
|
|
|
|
|
|
|
|
|
0.01 |
DPS: special (non-core assets sale) |
|
|
|
|
|
|
|
|
|
|
|
|
|
|
- |
DPS: total |
0.00 |
0.00 |
0.00 |
0.00 |
0.00 |
0.00 |
0.00 |
0.00 |
0.00 |
0.00 |
0.00 |
0.00 |
0.00 |
0.00 |
0.01 |
Dividend / Net profit (nominal) |
9% |
11% |
13% |
24% |
25% |
25% |
31% |
37% |
43% |
49% |
49% |
49% |
49% |
49% |
|
Dividend / Net profit (adj) |
9% |
7% |
18% |
18% |
19% |
22% |
29% |
36% |
42% |
49% |
49% |
49% |
49% |
49% |
|
Dividend / FCF |
26% |
13% |
77% |
47% |
24% |
35% |
34% |
42% |
54% |
59% |
92% |
100% |
108% |
193% |
|
Cash Flow, RUB bn |
|
|
|
|
|
|
|
|
|
|
|
|
|
|
TV'2027 |
NOPAT: old plants |
4.1 |
4.6 |
5.0 |
5.1 |
4.1 |
3.6 |
3.5 |
3.6 |
4.0 |
4.0 |
4.1 |
4.2 |
4.3 |
4.7 |
|
NOPAT: new |
4.4 |
3.4 |
2.1 |
3.2 |
6.0 |
7.1 |
8.3 |
7.1 |
2.5 |
2.3 |
(1.4) |
(1.3) |
(1.2) |
(2.2) |
|
NOPAT: reselling / other |
0.6 |
0.5 |
0.2 |
0.8 |
1.1 |
1.2 |
0.7 |
0.5 |
0.3 |
0.2 |
0.2 |
0.1 |
0.1 |
0.1 |
|
NOPAT |
9.0 |
8.5 |
7.3 |
9.0 |
11.2 |
11.8 |
12.5 |
11.2 |
6.8 |
6.6 |
2.9 |
3.1 |
3.3 |
2.5 |
|
CapEx: Maintenance |
0.0 |
(8.3) |
(9.5) |
(9.2) |
(8.0) |
(11.5) |
(10.0) |
(9.7) |
(9.3) |
(9.0) |
(9.3) |
(9.5) |
(9.8) |
(10.0) |
|
CapEx: New |
(7.1) |
0.0 |
(0.3) |
0.0 |
(1.4) |
0.0 |
0.0 |
0.0 |
0.0 |
0.0 |
0.0 |
0.0 |
0.0 |
0.0 |
|
CapEx |
(7.1) |
(8.3) |
(9.8) |
(9.2) |
(9.4) |
(11.5) |
(10.0) |
(9.7) |
(9.3) |
(9.0) |
(9.3) |
(9.5) |
(9.8) |
(10.0) |
|
Working Capital Red./ (Incr.) |
(2.9) |
(0.6) |
(0.6) |
(2.1) |
(1.5) |
(0.7) |
0.0 |
0.0 |
(0.0) |
(0.0) |
0.0 |
0.0 |
0.0 |
0.0 |
|
FCF; old plants |
5.2 |
(0.2) |
(0.4) |
(1.0) |
0.5 |
(3.1) |
(1.1) |
(0.6) |
0.1 |
0.4 |
0.3 |
0.1 |
0.0 |
0.1 |
31.4 |
FCF; new plants |
(0.4) |
5.9 |
4.3 |
5.7 |
7.2 |
9.6 |
10.8 |
9.7 |
5.1 |
4.9 |
1.2 |
1.3 |
1.4 |
0.4 |
21.2 |
FCF: reselling / other |
0.6 |
0.5 |
0.2 |
0.8 |
1.1 |
1.2 |
0.7 |
0.5 |
0.3 |
0.2 |
0.2 |
0.1 |
0.1 |
0.1 |
0.4 |
FCF: cash one-offs |
0.0 |
0.0 |
0.0 |
0.0 |
0.0 |
0.0 |
0.0 |
0.0 |
0.0 |
0.0 |
0.0 |
0.0 |
0.0 |
0.0 |
|
FCF (to EV) |
5.3 |
6.2 |
4.1 |
5.5 |
8.8 |
7.7 |
10.5 |
9.6 |
5.5 |
5.6 |
1.7 |
1.6 |
1.5 |
0.5 |
53.0 |
Interest (CF) |
(2.9) |
(2.5) |
(2.9) |
(2.7) |
(0.9) |
(0.7) |
(0.2) |
0.1 |
0.3 |
0.3 |
0.4 |
0.4 |
0.4 |
0.4 |
|
FCF (to Equity) |
2.4 |
3.7 |
1.2 |
2.8 |
7.9 |
7.0 |
10.3 |
9.6 |
5.8 |
5.9 |
2.1 |
2.0 |
1.9 |
0.9 |
|
Discounting parameters |
|
|
|
|
|
|
|
|
|
|
|
|
|
|
|
Period for discounting, years |
DCF |
|
|
|
|
(1.4) |
(0.4) |
0.6 |
1.6 |
2.6 |
3.6 |
4.6 |
5.6 |
6.6 |
0.6 |
|
DDM |
|
|
|
|
(0.4) |
0.6 |
1.6 |
2.6 |
3.6 |
4.6 |
5.6 |
6.6 |
7.6 |
1.6 |
Discounting factor |
DCF |
|
|
|
|
|
1.03 |
0.93 |
0.82 |
0.72 |
0.64 |
0.57 |
0.50 |
0.44 |
0.39 |
|
DDM |
|
|
|
|
1.03 |
0.92 |
0.79 |
0.69 |
0.60 |
0.52 |
0.45 |
0.39 |
0.34 |
0.29 |
DCF |
|
|
|
|
|
|
|
|
|
|
|
|
|
|
|
DCF: Old plants |
|
|
|
|
|
|
(1.1) |
(0.6) |
0.1 |
0.3 |
0.2 |
0.1 |
0.0 |
0.0 |
12.3 |
DCF: New plants |
|
|
|
|
|
|
11.1 |
9.0 |
4.2 |
3.6 |
0.8 |
0.7 |
0.7 |
0.2 |
8.3 |
DCF: Reselling / other |
|
|
|
|
|
|
0.8 |
0.5 |
0.3 |
0.2 |
0.1 |
0.1 |
0.0 |
0.0 |
0.2 |
DCF: total |
|
|
|
|
|
|
10.8 |
8.9 |
4.5 |
4.0 |
1.1 |
0.9 |
0.8 |
0.2 |
20.7 |
|
|
|
|
|
|
|
|
|
|
|
|
|
|
|
|
TP (DCF), RUB bln or RUB/s |
|
|
TP (w-average, rounded), RUB/s |
|
|
|
|
Valuation parameters |
|
DDM |
DCF |
Other |
|||
EV, RUB bln |
52 |
|
TP |
|
RUB/s |
Weight |
|
|
|
CoE |
|
|
15.4% |
|
|
Non-core assets |
- |
|
DDM |
|
0.008 |
60% |
|
DDM is a floor for PT |
WACC |
|
|
|
13.2% |
|
|
Net (debt) / Cash (discounted), end 2018 |
(7) |
|
DCF |
|
0.012 |
40% |
|
|
|
TG (Dividends) |
|
|
3.5% |
|
|
Equity, RUB bln |
45 |
|
Result (rounded) |
|
0.010 |
100% |
|
|
|
TG (FCF): "old" assets |
|
|
3.0% |
0.0% |
|
# of shares: current |
3,854 |
|
|
|
|
|
|
|
|
TG (FCF): "new" assets |
|
|
3.0% |
|
|
# of shares: Ord: New |
- |
|
|
|
|
|
|
|
|
|
|
|
|
|
|
# of shares: Ord |
3,854 |
|
|
|
|
|
|
|
|
|
|
|
|
|
|
# of shares: Ord: treasury |
- |
|
|
|
|
|
|
|
|
|
|
|
|
|
|
# of shares: Pref |
- |
|
|
|
|
|
|
|
|
|
|
|
|
|
|
# of shares: effective, total |
3,854 |
|
|
|
|
|
|
|
|
|
|
|
|
|
|
TP (DCF), RUB |
0.012 |
|
|
|
|
|
|
|
|
|
|
|
|
|
|
Source: company data, Gazprombank estimates
43
vk.com/id446425943
NOVEMBER 23, 2018 |
RUSSIA > EQUITY RESEARCH > UTILITIES |
|
|
INITIATION OF COVERAGE
OGK-2
RU
SSI
Major FCFY-to-CoE premium until 2024 despite substantial decline thereafter
OGK-2 should preserve a major FCFY-to-CoE premium until 2024, followed by a substantial FCFY decline in 2025 on the back of expiration of CSAs.
Operations
OGK-2 is a major inter-regional thermal generator (electrical capacity ~19 GW) with belowaverage efficiency of "old" capacity but a substantial EBITDA contribution from "new" CSAsupported capacity.
Positives
FCFY-to-CoE premium from 2017 following completion of the CSA program in mid2016 should last until 2024.
Potential increase in dividend payout (from ~25% of 2017 IFRS net income) on the back of positive FCF and reduced leverage.
High share of core shareholder (Gazprom Energoholding) in the capital of OGK-2 (~73%) should raise its propensity to pay dividends.
Negatives
Modest historical dividend payout: e.g. ~25% of 2017 IFRS net income paid as dividends.
FCF to decline after 2024 due to expiration of CHPs at Ryazan TPP (Nov. 2024), Serov TPP (Nov. 2024), Troitsk TPP (Nov. 2024) and Novocherkassk TPP (Nov. 2024).
Leverage is above the industry average: Net debt/EBITDA’18=~1.4x.
Below-average efficiency of "old" power plants triggering a sharp decline in EBITDA after CSA expirations.
Note: Share prices as of closure 20-Nov-2018
TICKER |
OGKB RX |
Currency |
RUB |
|
|
Target price |
0.44 |
Upside |
31% |
|
|
Recommendation |
Overweight |
MCap, bln |
37 |
|
|
Share price |
0.34 |
52-week high |
0.54 |
|
|
52-week low |
0.33 |
|
|
Source: Bloomberg, Gazprombank estimates
SHAREHOLDERS
Gazprom
EnergoHolding 73.4% (via Centerenergy-
holding)
Free-float |
26.6% |
|
|
Source: company data
12M PRICE PERFORMANCE
140% |
|
|
|
|
|
120% |
|
|
|
|
|
100% |
|
|
|
|
|
80% |
|
|
|
|
|
60% |
|
MOEX INDEX |
|
|
|
|
|
|
|
|
|
40% |
|
OGKB |
|
|
|
Jan-18 |
Mar-18 |
May-18 |
Jul-18 |
|
|
Nov-17 |
Sep-18 |
||||
Source: Bloomberg
Valuation (2018-26)
FCFY-to-CoE premium: 2018-24.
DY-to-CoD premium: 2021-24.
Chart 55. OGK-2: FCF profile
EBITDA (lhs), capex (lhs), FCFY (rhs)
40 |
EBITDA, Capex |
30% |
|
FCFY |
|
|
RUB bln |
(line) |
20 |
|
15% |
0 |
|
|
|
|
|
|
|
|
|
|
|
0% |
|
-20 |
|
|
|
|
|
|
|
|
|
|
|
-15% |
|
2016 |
2017 |
2018E |
2019E |
2020E |
2021E |
2022E |
2023E |
2024E |
2025E |
2026E |
|||
|
|
EBITDA ("NEW") |
|
|
|
CAPEX |
|
EBITDA ("OLD") |
|
FCFY |
|||
|
|
|
|
|
|
|
|||||||
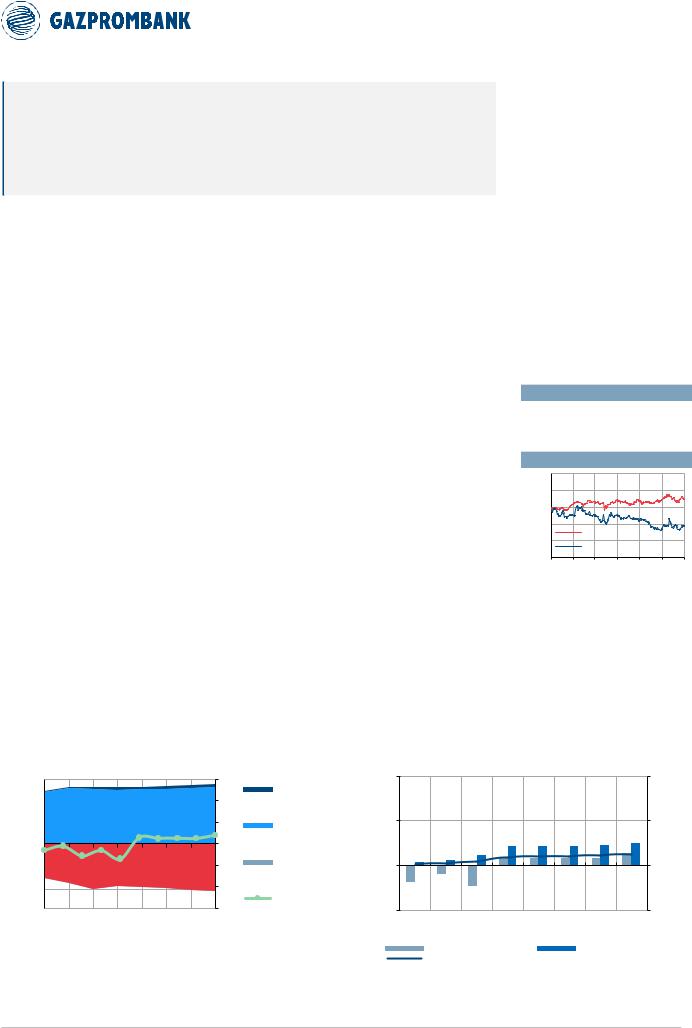
Chart 56. OGK-2: FCFY and DY profile
FCFY (lhs), DY (lhs) and dividend payout vs IFRS net profit (rhs)
30% |
|
FCFY and DY |
|
|
|
|
|
|
|
|
Dividend |
|
100% |
|||
|
|
|
|
|
|
|
|
|
|
|||||||
|
|
|
|
|
|
|
|
|
|
|
|
|
||||
|
|
|
(columns) |
|
|
|
|
|
|
|
|
payout (line) |
|
|
||
15% |
|
|
|
|
|
|
|
|
|
|
|
|
|
|
50% |
|
0% |
|
|
|
|
|
|
|
|
|
|
|
|
|
|
0% |
|
|
|
|
|
|
|
|
|
|
|
|
|
|
|
|||
-15% |
|
|
|
2018E |
2019E |
2020E |
2021E |
2022E |
2023E |
2024E |
2025E |
2026E |
|
-50% |
||
2016 |
2017 |
|
||||||||||||||
|
|
|
|
|||||||||||||
|
|
|
|
FCF YIELD (LHS) |
|
|
|
|
|
DIVIDEND YIELD (LHS) |
||||||
|
|
|
|
|
|
|
|
|
||||||||
|
|
|
|
|
|
|
|
|
||||||||
|
|
|
|
DIVIDEND PAYOUT (RHS) |
|
|
|
|
|
|
|
|
|
|||
Source: company data, Gazprombank estimates |
Source: company data, Gazprombank estimates |
44

vk.com/id446425943
NOVEMBER 23, 2018 RUSSIA > EQUITY RESEARCH > UTILITIES
Table 11. OGK-2 forecast (IFRS-based) and valuation, RUB bln or RUB per share
P&L (IFRS), RUB bln: OGK-2 |
2013 |
2014 |
2015 |
2016 |
2017 |
2018E |
2019E |
2020E |
2021E |
2022E |
2023E |
2024E |
2025E |
2026E |
TV'2027 |
Revenue electricity: old |
81.6 |
82.6 |
75.0 |
78.1 |
73.4 |
71.8 |
73.6 |
76.1 |
80.8 |
82.9 |
85.0 |
86.9 |
88.7 |
91.9 |
|
Revenue electicity: new |
15.7 |
16.4 |
20.9 |
38.5 |
46.9 |
48.3 |
51.0 |
51.6 |
57.3 |
54.2 |
53.6 |
52.4 |
29.9 |
31.0 |
|
Revenue electricity |
97.3 |
99.0 |
95.9 |
116.6 |
120.4 |
120.1 |
124.6 |
127.7 |
138.1 |
137.1 |
138.6 |
139.3 |
118.6 |
122.9 |
|
Heat revenue |
4.2 |
4.6 |
4.5 |
5.0 |
5.0 |
5.3 |
5.4 |
5.4 |
5.4 |
5.4 |
5.4 |
5.4 |
5.4 |
5.4 |
|
Revenue other (incl. reselling) |
10.5 |
12.4 |
11.8 |
12.7 |
15.9 |
18.2 |
12.9 |
9.3 |
6.8 |
5.1 |
3.9 |
3.0 |
2.3 |
1.9 |
|
Revenue (before subsidies) |
112.0 |
116.0 |
112.2 |
134.4 |
141.3 |
143.7 |
142.8 |
142.3 |
150.3 |
147.6 |
147.9 |
147.7 |
126.3 |
130.2 |
|
Subsidies |
0.0 |
0.0 |
0.0 |
0.0 |
0.0 |
0.0 |
0.0 |
0.0 |
0.0 |
0.0 |
0.0 |
0.0 |
0.0 |
0.0 |
|
Revenue |
112.0 |
116.0 |
112.2 |
134.4 |
141.3 |
143.7 |
142.8 |
142.3 |
150.3 |
147.6 |
147.9 |
147.7 |
126.3 |
130.2 |
|
Fuel costs electricity, old |
(54.5) |
(55.1) |
(51.9) |
(53.8) |
(50.7) |
(47.5) |
(48.2) |
(48.8) |
(49.6) |
(50.5) |
(51.3) |
(52.0) |
(52.5) |
(54.4) |
|
Fuel costs heat, old |
(2.6) |
(2.6) |
(2.5) |
(2.6) |
(2.4) |
(2.3) |
(2.3) |
(2.3) |
(2.4) |
(2.4) |
(2.4) |
(2.5) |
(2.5) |
(2.6) |
|
Fuel costs, new |
(7.3) |
(7.7) |
(8.4) |
(12.5) |
(13.2) |
(12.7) |
(13.3) |
(13.8) |
(14.4) |
(15.0) |
(15.6) |
(16.2) |
(16.7) |
(17.3) |
|
Fuel costs,old and new |
(64.3) |
(65.4) |
(62.8) |
(68.9) |
(66.3) |
(62.5) |
(63.7) |
(64.9) |
(66.4) |
(67.9) |
(69.3) |
(70.6) |
(71.8) |
(74.2) |
|
Purchased power & Re-selling |
(9.3) |
(11.3) |
(10.7) |
(11.6) |
(13.0) |
(13.2) |
(9.8) |
(7.4) |
(5.7) |
(4.4) |
(3.4) |
(2.7) |
(2.1) |
(1.7) |
|
Heat transportation |
0.0 |
0.0 |
0.0 |
0.0 |
0.0 |
0.0 |
0.0 |
0.0 |
0.0 |
0.0 |
0.0 |
0.0 |
0.0 |
0.0 |
|
Water payment |
0.0 |
0.0 |
0.0 |
0.0 |
0.0 |
0.0 |
0.0 |
0.0 |
0.0 |
0.0 |
0.0 |
0.0 |
0.0 |
0.0 |
|
Gross profit |
38.4 |
39.3 |
38.7 |
53.9 |
62.0 |
68.1 |
69.3 |
70.0 |
78.3 |
75.4 |
75.2 |
74.4 |
52.4 |
54.3 |
|
Non-fuel Opex: Old plants |
(23.4) |
(23.3) |
(23.9) |
(26.0) |
(25.0) |
(31.2) |
(32.7) |
(34.1) |
(35.5) |
(36.8) |
(37.9) |
(39.0) |
(39.9) |
(40.7) |
|
Non-fuel Opex: new plants |
(2.3) |
(2.5) |
(3.6) |
(6.8) |
(8.4) |
(8.8) |
(9.3) |
(9.7) |
(10.1) |
(10.5) |
(10.8) |
(11.1) |
(11.4) |
(12.1) |
|
Cost of subsidies |
0.0 |
0.0 |
0.0 |
0.0 |
0.0 |
0.0 |
0.0 |
0.0 |
0.0 |
0.0 |
0.0 |
0.0 |
0.0 |
0.0 |
|
Non-fuel Opex |
(25.7) |
(25.9) |
(27.6) |
(32.8) |
(33.4) |
(40.0) |
(42.0) |
(43.8) |
(45.6) |
(47.2) |
(48.8) |
(50.1) |
(51.3) |
(52.8) |
|
EBITDA, old plants |
5.3 |
6.2 |
1.2 |
0.8 |
0.4 |
(3.8) |
(4.2) |
(3.7) |
(1.3) |
(1.3) |
(1.3) |
(1.1) |
(0.9) |
(0.3) |
|
EBITDA, new plants |
6.2 |
6.2 |
8.9 |
19.2 |
25.4 |
26.8 |
28.4 |
28.1 |
32.8 |
28.7 |
27.2 |
25.1 |
1.8 |
1.6 |
|
EBITDA, reselling / other |
1.2 |
1.1 |
1.0 |
1.1 |
2.9 |
5.1 |
3.0 |
1.9 |
1.2 |
0.7 |
0.5 |
0.3 |
0.2 |
0.1 |
|
EBITDA |
12.7 |
13.4 |
11.1 |
21.1 |
28.7 |
28.0 |
27.3 |
26.3 |
32.7 |
28.1 |
26.4 |
24.3 |
1.1 |
1.4 |
|
Depreciation: Old plants |
(2.1) |
(1.8) |
(2.1) |
(4.7) |
(6.1) |
(7.6) |
(7.6) |
(7.6) |
(7.6) |
(7.6) |
(7.6) |
(7.6) |
(7.6) |
(7.6) |
|
Depreciation: New plants |
(2.5) |
(3.2) |
(4.1) |
(4.8) |
(5.1) |
(5.2) |
(5.2) |
(5.2) |
(5.2) |
(5.2) |
(5.2) |
(5.2) |
(5.2) |
(5.2) |
|
Depreciation |
(4.6) |
(5.0) |
(6.2) |
(9.5) |
(11.3) |
(12.8) |
(12.8) |
(12.8) |
(12.8) |
(12.8) |
(12.8) |
(12.8) |
(12.8) |
(12.8) |
|
EBIT |
8.1 |
8.5 |
4.9 |
11.5 |
17.4 |
15.2 |
14.5 |
13.4 |
19.9 |
15.3 |
13.6 |
11.5 |
(11.7) |
(11.4) |
|
Finance (costs) / income |
(1.4) |
0.3 |
(0.5) |
(4.4) |
(5.4) |
(4.4) |
(3.1) |
(2.0) |
(1.1) |
0.3 |
1.2 |
2.1 |
2.9 |
2.1 |
|
One-offs (cash) |
0.0 |
0.0 |
0.0 |
0.0 |
0.0 |
0.0 |
0.0 |
0.0 |
0.0 |
0.0 |
0.0 |
0.0 |
0.0 |
0.0 |
|
One-offs (non-cash): operational |
(1.2) |
(9.3) |
(1.0) |
(2.1) |
(1.9) |
(1.4) |
(0.7) |
(0.3) |
(0.2) |
(0.1) |
(0.0) |
(0.0) |
(0.0) |
(0.0) |
|
One-offs (non-cash): financial |
0.0 |
0.0 |
0.0 |
0.0 |
0.0 |
0.0 |
0.0 |
0.0 |
0.0 |
0.0 |
0.0 |
0.0 |
0.0 |
0.0 |
|
EBT |
5.4 |
(0.5) |
3.4 |
5.0 |
10.1 |
9.4 |
10.7 |
11.0 |
18.7 |
15.5 |
14.8 |
13.6 |
(8.8) |
(9.3) |
|
Income tax |
(1.2) |
(0.9) |
(0.8) |
(1.9) |
(2.9) |
(2.0) |
(2.2) |
(2.3) |
(3.9) |
(3.3) |
(3.1) |
(2.8) |
0.0 |
0.0 |
|
Net profit (pre-minorities) |
4.2 |
(1.4) |
2.6 |
3.1 |
7.2 |
7.4 |
8.4 |
8.7 |
14.7 |
12.2 |
11.7 |
10.7 |
(8.8) |
(9.3) |
|
Minority |
0.0 |
(0.1) |
(0.8) |
(0.1) |
0.0 |
0.0 |
(0.1) |
(0.0) |
(0.1) |
(0.1) |
(0.1) |
(0.1) |
0.1 |
0.1 |
|
Net profit (reported) |
4.2 |
(1.6) |
1.8 |
2.9 |
7.2 |
7.4 |
8.3 |
8.7 |
14.7 |
12.1 |
11.6 |
10.6 |
(8.8) |
(9.2) |
|
Net profit (adj) |
5.2 |
25.8 |
3.5 |
5.6 |
9.5 |
8.5 |
9.0 |
9.0 |
14.9 |
12.3 |
11.7 |
10.7 |
(7.0) |
(7.3) |
|
Leverage, RUB bn |
|
|
|
|
|
|
|
|
|
|
|
|
|
|
TV'2027 |
Net (Debt) / Cash (year end) |
(29) |
(34) |
(65) |
(63) |
(54) |
(38) |
(25) |
(13) |
4 |
15 |
26 |
36 |
26 |
21 |
(3) |
Net Debt or (Cash) / EBITDA (year end) |
2.3 |
2.5 |
5.8 |
3.0 |
1.9 |
1.4 |
0.9 |
0.5 |
(0.1) |
(0.5) |
(1.0) |
(1.5) |
(23.4) |
(14.8) |
2.0 |
Multiples |
|
|
` |
|
|
|
|
|
|
|
|
|
|
|
|
FCF Yield |
-20% |
-20% |
-64% |
-9% |
22% |
28% |
31% |
32% |
48% |
43% |
41% |
38% |
-11% |
-13% |
|
|
|||||||||||||||
DY |
0% |
1% |
2% |
2% |
5% |
5% |
7% |
9% |
17% |
16% |
16% |
14% |
0% |
0% |
|
EV/EBITDA |
5.2 |
5.1 |
7.8 |
4.8 |
3.3 |
3.0 |
2.5 |
2.1 |
1.3 |
1.1 |
0.9 |
0.7 |
14.9 |
14.8 |
|
PE (adj) |
7.2 |
1.4 |
10.7 |
6.6 |
3.9 |
4.4 |
4.1 |
4.1 |
2.5 |
3.0 |
3.2 |
3.5 |
neg |
neg |
|
Dividend, RUB / s |
|
|
|
|
|
|
|
|
|
|
|
|
|
|
TV'2027 |
DPS: regular |
0.00 |
0.00 |
0.01 |
0.01 |
0.02 |
0.02 |
0.02 |
0.03 |
0.06 |
0.06 |
0.05 |
0.05 |
0.00 |
0.00 |
0.00 |
DPS: special (leverage optimization) |
|
|
|
|
|
|
|
|
|
|
|
|
|
|
0.22 |
DPS: special (non-core assets sale) |
|
|
|
|
|
|
|
|
|
|
|
|
|
|
- |
DPS: total |
0.00 |
0.00 |
0.01 |
0.01 |
0.02 |
0.02 |
0.02 |
0.03 |
0.06 |
0.06 |
0.05 |
0.05 |
0.00 |
0.00 |
0.22 |
Dividend / Net profit (nominal) |
0% |
0% |
34% |
31% |
25% |
25% |
31% |
38% |
44% |
50% |
50% |
50% |
0% |
0% |
|
Dividend / Net profit (adj) |
0% |
2% |
18% |
16% |
19% |
22% |
29% |
36% |
43% |
49% |
50% |
50% |
0% |
0% |
|
Dividend / FCF |
neg |
neg |
neg |
neg |
22% |
17% |
22% |
28% |
36% |
38% |
38% |
37% |
neg |
neg |
|
Cash Flow, RUB bn |
|
|
|
|
|
|
|
|
|
|
|
|
|
|
TV'2027 |
NOPAT: old plants |
2.5 |
4.4 |
(0.9) |
(3.9) |
(5.8) |
(11.4) |
(11.8) |
(11.3) |
(8.9) |
(8.9) |
(8.9) |
(8.7) |
(8.5) |
(7.9) |
|
NOPAT: new |
2.9 |
3.0 |
3.8 |
11.3 |
16.0 |
17.0 |
18.3 |
18.1 |
21.8 |
18.5 |
17.4 |
15.7 |
(3.4) |
(3.6) |
|
NOPAT: reselling / other |
0.9 |
1.1 |
0.8 |
0.9 |
2.3 |
4.0 |
2.4 |
1.5 |
0.9 |
0.6 |
0.4 |
0.2 |
0.2 |
0.1 |
|
NOPAT |
6.3 |
8.5 |
3.7 |
8.3 |
12.5 |
9.6 |
9.0 |
8.2 |
13.8 |
10.2 |
8.9 |
7.2 |
(11.8) |
(11.4) |
|
CapEx: Maintenance |
0.0 |
0.0 |
(2.5) |
(3.4) |
(5.0) |
(7.0) |
(7.1) |
(7.3) |
(7.4) |
(7.5) |
(7.6) |
(7.8) |
(7.9) |
(8.0) |
|
CapEx: New |
(17.0) |
(19.0) |
(24.3) |
(11.4) |
(5.1) |
0.0 |
0.0 |
0.0 |
0.0 |
0.0 |
0.0 |
0.0 |
0.0 |
0.0 |
|
CapEx |
(17.0) |
(19.0) |
(26.8) |
(14.8) |
(10.1) |
(7.0) |
(7.1) |
(7.3) |
(7.4) |
(7.5) |
(7.6) |
(7.8) |
(7.9) |
(8.0) |
|
Working Capital Red./ (Incr.) |
0.0 |
0.0 |
(2.9) |
(0.4) |
0.0 |
(0.2) |
0.0 |
0.0 |
(0.6) |
0.0 |
0.0 |
0.0 |
0.0 |
0.0 |
|
FCF; old plants |
4.6 |
6.2 |
(4.1) |
(3.0) |
(4.6) |
(11.0) |
(11.3) |
(11.0) |
(9.2) |
(8.8) |
(8.9) |
(8.9) |
(8.8) |
(8.3) |
88.7 |
FCF; new plants |
(11.6) |
(12.8) |
(16.5) |
4.7 |
16.0 |
22.2 |
23.6 |
23.3 |
27.0 |
23.8 |
22.6 |
20.9 |
1.8 |
1.6 |
46.8 |
FCF: reselling / other |
0.9 |
1.1 |
0.8 |
0.9 |
2.3 |
4.0 |
2.4 |
1.5 |
0.9 |
0.6 |
0.4 |
0.2 |
0.2 |
0.1 |
0.8 |
FCF: cash one-offs |
0.0 |
0.0 |
0.0 |
0.0 |
0.0 |
0.0 |
0.0 |
0.0 |
0.0 |
0.0 |
0.0 |
0.0 |
0.0 |
0.0 |
|
FCF (to EV) |
(6.1) |
(5.6) |
(19.8) |
2.6 |
13.7 |
15.2 |
14.7 |
13.8 |
18.8 |
15.5 |
14.1 |
12.3 |
(6.8) |
(6.6) |
136.3 |
Interest (CF) |
(1.5) |
(2.1) |
(3.9) |
(5.9) |
(5.7) |
(4.7) |
(3.1) |
(2.0) |
(1.0) |
0.3 |
1.1 |
1.9 |
2.6 |
1.8 |
|
FCF (to Equity) |
(7.6) |
(7.6) |
(23.7) |
(3.3) |
8.1 |
10.6 |
11.6 |
11.8 |
17.7 |
15.8 |
15.2 |
14.2 |
(4.2) |
(4.8) |
|
Discounting parameters |
|
|
|
|
|
|
|
|
|
|
|
|
|
|
|
Period for discounting, years |
DCF |
|
|
|
|
(1.4) |
(0.4) |
0.6 |
1.6 |
2.6 |
3.6 |
4.6 |
5.6 |
6.6 |
0.6 |
|
DDM |
|
|
|
|
(0.4) |
0.6 |
1.6 |
2.6 |
3.6 |
4.6 |
5.6 |
6.6 |
7.6 |
1.6 |
Discounting factor |
DCF |
|
|
|
|
|
1.03 |
0.93 |
0.82 |
0.72 |
0.64 |
0.56 |
0.50 |
0.44 |
0.39 |
|
DDM |
|
|
|
|
1.03 |
0.92 |
0.79 |
0.69 |
0.59 |
0.51 |
0.45 |
0.39 |
0.33 |
0.29 |
DCF |
|
|
|
|
|
|
|
|
|
|
|
|
|
|
|
DCF: Old plants |
|
|
|
|
|
|
(11.6) |
(10.2) |
(7.5) |
(6.4) |
(5.7) |
(5.0) |
(4.4) |
(3.7) |
34.5 |
DCF: New plants |
|
|
|
|
|
|
24.2 |
21.6 |
22.1 |
17.2 |
14.4 |
11.8 |
0.9 |
0.7 |
18.2 |
DCF: Reselling / other |
|
|
|
|
|
|
2.5 |
1.4 |
0.8 |
0.4 |
0.2 |
0.1 |
0.1 |
0.0 |
0.3 |
DCF: total |
|
|
|
|
|
|
15.1 |
12.8 |
15.4 |
11.2 |
9.0 |
6.9 |
(3.4) |
(2.9) |
53.0 |
|
|
|
|
|
|
|
|
|
|
|
|
|
|
|
|
TP (DCF), RUB bln or RUB/s |
|
|
TP (w-average, rounded), RUB/s |
|
|
|
|
Valuation parameters |
|
DDM |
DCF |
Other |
|||
EV, RUB bln |
117 |
|
TP |
|
RUB/s |
Weight |
|
|
|
CoE |
|
|
15.5% |
|
|
Non-core assets |
- |
|
DDM |
|
0.25 |
60% |
|
DDM is a floor for PT |
WACC |
|
|
|
13.2% |
|
|
Net (debt) / Cash (discounted), end 2018 |
(38) |
|
DCF |
|
0.72 |
40% |
|
|
|
TG (Dividends) |
|
|
3.5% |
|
|
Equity, RUB bln |
79 |
|
Result (rounded) |
|
0.44 |
100% |
|
|
|
TG (FCF): "old" assets |
|
|
2.0% |
0.0% |
|
# of shares: current |
110 |
|
|
|
|
|
|
|
|
TG (FCF): "new" assets |
|
|
2.0% |
|
|
# of shares: Ord: New |
- |
|
|
|
|
|
|
|
|
|
|
|
|
|
|
# of shares: Ord |
110 |
|
|
|
|
|
|
|
|
|
|
|
|
|
|
# of shares: Ord: treasury |
- |
|
|
|
|
|
|
|
|
|
|
|
|
|
|
# of shares: Pref |
- |
|
|
|
|
|
|
|
|
|
|
|
|
|
|
# of shares: effective, total |
110 |
|
|
|
|
|
|
|
|
|
|
|
|
|
|
TP (DCF), RUB |
0.72 |
|
|
|
|
|
|
|
|
|
|
|
|
|
|
Source: company data, Gazprombank estimates
45
vk.com/id446425943
NOVEMBER 23, 2018 |
RUSSIA > EQUITY RESEARCH > UTILITIES |
|
|
INITIATION OF COVERAGE
ROSSETI (Russian Grids)
RU
SSI
Potentially solid dividends are currently muted by cross-financing within the group
ROSSETI (Russian Grids) enjoys major dividend inflow from subsidiaries and can potentially benefit from the government’s new regulatory initiatives. But the existing mechanism of cross-financing within the group prevents the translation of solid dividend inflow into a healthy dividend outflow.
Operations
ROSSETI (Russian Grids) is the key holding company in Russia’s power grid sector, owning controlling stakes in FSK (~80%) as well as mega-regional power distribution companies.
Positives
Modest P&L-based valuation: consolidated P/E'18 < 1.5x.
"Exclusive" channel for the government to collect dividends from the power grid sector.
Substantial dividend inflow from underlying grids: ~RUB 24 bln in 2018 (>15% of Russian Grids' MCap).
New dividend policy (2017) implies a more structural approach to calculation of dividends (50% of adjusted RAS or IFRS net income, whichever is larger).
Note: Share prices as of closure 20-Nov-2018
TICKER |
RSTI RX |
Currency |
RUB |
|
|
Target price |
0.75 |
Upside |
7% |
|
|
Recommendation |
Neutral |
MCap, bln |
139 |
|
|
Share price |
0.70 |
52-week high |
0.96 |
|
|
52-week low |
0.66 |
|
|
Source: Bloomberg, Gazprombank estimates
SHAREHOLDERS (ORD.)
Russian Government |
88.9% |
|
|
Free-float |
11.1% |
|
|
Source: company data
Positive regulatory initiatives considered, including: a) long-term tariff agreements with regional authorities; b) restrictions on preferential connections, c) charges for excessive capacity, and d) limits ("social norm") for subsidized residenial supply.
Negatives
Modest medium-term growth in power transportation tariffs envisioned by the government (~3% p.a.).
Cross-financing within Russian Grids group as major part of the dividend inflow from underlying companies (e.g. FSK) is used for "financial support" of selected subsidiaries.
12M PRICE PERFORMANCE
140% |
|
|
|
|
|
120% |
|
|
|
|
|
100% |
|
|
|
|
|
80% |
|
|
|
|
|
|
|
MOEX INDEX |
|
|
|
60% |
|
RSTI |
|
|
|
|
|
|
|
|
|
40% |
Jan-18 |
Mar-18 |
May-18 |
Jul-18 |
|
Nov-17 |
Sep-18 |
||||
|
Substantial subtractions from IFRS net profit before it becomes the basis for dividends, |
Source: Bloomberg |
|
incl. : a) the difference between IFRS and RAS (sum for subsidiaries) depreciaton, b) |
|
|
the value of "financial support" to subsidiaries, c) portion of net profit used for CapEx. |
|
|
"Grids digitalization" program may trigger hikes in capex and opex on a mid-term horizon. |
|
Valuation
PE'18<1.5x (IFRS), DY'18 = ~3-4%.
Our target price is based on a DDM approach, even though we run DCF as well.
Chart 57. Russian Grids: FCF profile |
Chart 58. Russian Grids: FCFY and DY profile |
EBITDA (lhs), capex (lhs), FCFY (rhs) |
FCFY, DY (lhs) and dividend payout vs connection adjusted IFRS profit(rhs) |
350 |
EBITDA, Capex |
|
|
|
FCFY (line) |
30% |
||
RUB bln |
|
|
|
|
|
|
||
|
|
|
|
|
|
|
|
|
250 |
|
|
|
|
|
|
|
20% |
|
|
|
|
|
|
|
|
|
150 |
|
|
|
|
|
|
|
10% |
|
|
|
|
|
|
|
|
|
50 |
|
|
|
|
|
|
|
0% |
(50) |
|
|
|
|
|
|
|
|
|
|
|
|
|
|
|
|
|
(150) |
|
|
|
|
|
|
|
-10% |
|
|
|
|
|
|
|
|
|
(250) |
|
|
|
|
|
|
|
-20% |
|
|
|
|
|
|
|
|
|
(350) |
|
2018E |
2019E |
2020E |
2021E |
2022E |
2023E |
-30% |
2016 |
2017 |
|
||||||
30%
CONNECTION |
|
|
(ONE-OFF): |
|
|
CASH |
15% |
|
EBITDA: |
||
|
||
CONNECTION |
|
|
-ADJ |
|
|
CAPEX |
0% |
|
|
||
FCF YIELD |
|
|
|
-15% |
FCFY and DY (columns)
2016 |
2017 |
2018E |
2019E |
2020E |
FCF YIELD (LHS)
DIVIDEND PAYOUT (RHS)
|
|
100% |
|
Dividend payout |
|
|
|
(line) |
|
|
50% |
|
|
0% |
|
|
-50% |
2021E |
2022E |
2023E |
DIVIDEND YIELD (LHS)
Source: company data, Gazprombank estimates |
Source: company data, Gazprombank estimates |
46

vk.com/id446425943
NOVEMBER 23, 2018 RUSSIA > EQUITY RESEARCH > UTILITIES
Table 12. Russian Grids forecast (IFRS-based) and valuation, RUB bln or RUB per share
P&L (IFRS), RUB bln: Russian Grids |
2013 |
2014 |
2015 |
2016 |
2017 |
2018E |
2019E |
2020E |
2021E |
2022E |
2023E |
TV'2024E |
Electricity transportation |
643.3 |
620.0 |
650.4 |
721.9 |
784.2 |
862.5 |
892.8 |
924.1 |
956.6 |
990.3 |
1,025.1 |
|
Connection: regular |
37.0 |
31.5 |
23.2 |
30.1 |
33.4 |
25.0 |
23.3 |
22.4 |
21.7 |
21.2 |
21.0 |
|
Connection: one-off |
0.0 |
5.0 |
11.0 |
38.0 |
19.0 |
20.7 |
16.7 |
13.8 |
5.0 |
3.0 |
0.0 |
|
Reselling |
64.4 |
86.5 |
55.9 |
78.3 |
75.7 |
90.9 |
81.8 |
73.6 |
66.3 |
59.6 |
53.7 |
|
Construction |
0.0 |
0.0 |
7.0 |
21.3 |
19.1 |
7.0 |
4.0 |
3.0 |
2.0 |
1.0 |
0.0 |
|
Other |
11.1 |
16.6 |
19.3 |
11.5 |
17.0 |
19.5 |
17.6 |
15.8 |
14.2 |
12.8 |
11.5 |
|
Revenue |
755.8 |
759.6 |
766.8 |
901.0 |
948.3 |
1,025.6 |
1,036.1 |
1,052.7 |
1,065.8 |
1,087.9 |
1,111.3 |
|
Transmission Cash Opex: variable |
(223.6) |
(217.5) |
(220.5) |
(242.5) |
(271.1) |
(316.1) |
(327.2) |
(338.7) |
(350.6) |
(362.9) |
(375.6) |
|
Purchased power (reselling) |
(60.2) |
(46.8) |
(30.7) |
(46.0) |
(42.2) |
(50.7) |
(45.6) |
(41.0) |
(36.9) |
(33.2) |
(29.9) |
|
Cost of construction |
0.0 |
(1.7) |
(5.9) |
(19.9) |
(18.1) |
(6.7) |
(3.8) |
(2.9) |
(1.9) |
(1.0) |
0.0 |
|
Gross profit |
472.1 |
493.5 |
509.7 |
592.6 |
617.0 |
652.2 |
659.5 |
670.1 |
676.4 |
690.9 |
705.7 |
|
Transmission Cash Opex: fixed |
(246.6) |
(247.6) |
(252.0) |
(274.3) |
(298.4) |
(338.6) |
(350.7) |
(363.0) |
(375.3) |
(387.6) |
(400.0) |
|
EBITDA |
225.5 |
245.9 |
257.7 |
318.3 |
318.6 |
313.6 |
308.8 |
307.1 |
301.1 |
303.2 |
305.8 |
|
Depreciation |
(115.9) |
(125.9) |
(100.5) |
(113.8) |
(109.3) |
(113.8) |
(123.8) |
(132.0) |
(140.1) |
(148.0) |
(155.9) |
|
EBIT |
109.5 |
120.0 |
157.2 |
204.5 |
209.3 |
199.7 |
184.9 |
175.1 |
161.0 |
155.2 |
149.8 |
|
Finance income / (costs), net |
(41.6) |
(32.2) |
(22.6) |
(23.6) |
(18.3) |
(14.9) |
(13.3) |
(13.3) |
(13.4) |
(13.6) |
(13.7) |
|
Share of results of associates |
(0.0) |
(0.0) |
(0.0) |
0.0 |
(0.3) |
0.0 |
0.0 |
0.0 |
0.0 |
0.0 |
0.0 |
|
Non-cash and one-offs |
(287.1) |
(105.9) |
(20.8) |
(60.8) |
(13.4) |
(12.3) |
(6.1) |
(3.1) |
(1.5) |
(0.8) |
(0.4) |
|
EBT |
(219.2) |
(18.0) |
113.7 |
120.2 |
177.3 |
172.5 |
165.5 |
158.8 |
146.1 |
140.9 |
135.7 |
|
Income tax |
59.8 |
(6.2) |
(32.1) |
(21.8) |
(40.1) |
(36.2) |
(34.7) |
(33.3) |
(30.7) |
(29.6) |
(28.5) |
|
Net profit: pre-minorities |
(159.4) |
(24.3) |
81.6 |
98.3 |
137.1 |
136.3 |
130.7 |
125.4 |
115.4 |
111.3 |
107.2 |
|
Minority |
27.3 |
8.9 |
(17.6) |
(23.7) |
(34.8) |
(30.0) |
(31.5) |
(30.3) |
(27.8) |
(26.8) |
(25.9) |
|
Net profit: post-minorities |
(132.1) |
(15.4) |
64.0 |
74.6 |
102.3 |
106.3 |
99.2 |
95.2 |
87.6 |
84.4 |
81.4 |
|
EBITDA: connection-adj |
225.5 |
240.9 |
246.7 |
280.3 |
299.6 |
292.9 |
292.1 |
293.4 |
296.1 |
300.2 |
305.8 |
|
Net profit: connection-adj (post-minorities) |
61.3 |
42.5 |
76.6 |
85.7 |
101.2 |
101.1 |
92.9 |
88.8 |
85.5 |
83.1 |
81.6 |
|
Difference in depreciation (vs RAS) |
|
(36.7) |
(64.3) |
(60.1) |
(67.9) |
(68.0) |
(68.4) |
(68.8) |
(69.2) |
(69.6) |
(70.0) |
|
Connection revenue: one-off, cash (post-tax) |
0.0 |
0.4 |
1.3 |
4.4 |
6.1 |
8.1 |
9.9 |
11.6 |
12.7 |
13.7 |
14.5 |
|
Financial support of subsidiaries |
|
|
|
(17.6) |
(18.0) |
(18.0) |
(15.0) |
(12.0) |
(9.0) |
(6.0) |
(3.0) |
|
Net profit: adj (for dividends) |
61.3 |
6.3 |
13.5 |
12.4 |
21.4 |
23.3 |
19.4 |
19.6 |
20.0 |
21.2 |
23.1 |
|
Net Debt, RUB/s |
|
|
|
|
|
|
|
|
|
|
|
TV'2024E |
Net (debt) / cash, year end |
(436.4) |
(468.6) |
(487.2) |
(471.9) |
(456.2) |
(407.8) |
(406.6) |
(410.8) |
(415.0) |
(419.4) |
(420.9) |
(611.5) |
Net debt / EBITDA (connection adjusted): year average |
1.9 |
1.9 |
1.9 |
1.7 |
1.5 |
1.5 |
1.4 |
1.4 |
1.4 |
1.4 |
1.4 |
2.0 |
Dividend, RUB/s |
|
|
|
|
|
|
|
|
|
|
|
TV'2024E |
DPS: Ordinary |
0.0 |
0.0 |
0.008 |
0.006 |
0.012 |
0.023 |
0.044 |
0.044 |
0.045 |
0.048 |
0.052 |
0.44 |
DPS: Special (leverage optimization) |
|
|
|
|
|
|
|
|
|
|
|
0.72 |
DPS: Special (non-core assets sale) |
|
|
|
|
|
|
|
|
|
|
|
0.10 |
DPS: Total |
0.0 |
0.0 |
0.008 |
0.006 |
0.012 |
0.023 |
0.044 |
0.044 |
0.045 |
0.048 |
0.052 |
1.26 |
Dividend / Net profit (for dividends) |
0% |
0% |
13% |
16% |
12% |
22% |
50% |
50% |
50% |
50% |
50% |
|
Dividend / Net profit (connection-adj) |
0% |
0% |
2% |
1% |
2% |
5% |
9% |
10% |
11% |
11% |
13% |
|
Multiples |
|
|
|
|
|
|
|
|
|
|
|
|
FCF Yield |
-31% |
-3% |
-1% |
-6% |
-3% |
-7% |
3% |
2% |
2% |
2% |
4% |
|
DY (Ords) |
0% |
0% |
1% |
1% |
2% |
3% |
6% |
6% |
6% |
7% |
7% |
179% |
EV/EBITDA |
2.9 |
2.8 |
2.7 |
2.1 |
2.1 |
2.0 |
2.0 |
2.0 |
2.1 |
2.1 |
2.1 |
|
EV/EBITDA (connection-adj) |
2.9 |
2.8 |
2.8 |
2.4 |
2.2 |
2.1 |
2.1 |
2.1 |
2.1 |
2.1 |
2.1 |
|
PE (adjusted) |
2.3 |
3.3 |
1.8 |
1.6 |
1.4 |
1.4 |
1.5 |
1.6 |
1.6 |
1.7 |
1.7 |
|
Cash Flow, RUB bn |
|
|
|
|
|
|
|
|
|
|
|
TV'2024E |
EBITDA: connection-adj |
225.5 |
240.9 |
246.7 |
280.3 |
299.6 |
292.9 |
292.1 |
293.4 |
296.1 |
300.2 |
305.8 |
|
Connection (one-off): cash |
0.0 |
0.5 |
1.6 |
5.5 |
7.8 |
10.3 |
12.6 |
14.7 |
16.1 |
17.4 |
18.4 |
|
(Tax) |
0.0 |
(6.2) |
(32.1) |
(21.8) |
(40.1) |
(36.2) |
(34.7) |
(33.3) |
(30.7) |
(29.6) |
(28.5) |
|
Changes in working capital |
0.0 |
0.0 |
0.0 |
(40.1) |
(25.0) |
0.0 |
0.0 |
0.0 |
0.0 |
0.0 |
0.0 |
|
Capex |
(266.4) |
(204.2) |
(171.8) |
(190.5) |
(213.8) |
(248.8) |
(232.6) |
(238.3) |
(244.6) |
(250.9) |
(257.2) |
|
FCF (to EV) |
(40.9) |
31.0 |
44.4 |
33.4 |
28.5 |
18.1 |
37.4 |
36.4 |
36.9 |
37.1 |
38.4 |
738.7 |
Interest : CF |
(30.2) |
(38.2) |
(47.1) |
(46.8) |
(35.9) |
(34.8) |
(31.1) |
(31.0) |
(31.3) |
(31.4) |
(29.4) |
|
FCF (to equity) |
(71.1) |
(7.1) |
(2.7) |
(13.4) |
(7.5) |
(16.6) |
6.3 |
5.4 |
5.6 |
5.7 |
9.1 |
|
Discounting parameters |
|
|
|
|
|
|
|
|
|
|
|
TV'2024E |
Period for discounting, years |
|
|
|
|
|
|
|
|
|
|
|
|
DCF |
|
|
|
|
|
(1.4) |
(0.4) |
0.6 |
1.6 |
2.6 |
3.6 |
4.6 |
|
|
|
|
|
|
|
|
|
|
|
|
|
DDM |
|
|
|
|
|
(0.4) |
0.6 |
1.6 |
2.6 |
3.6 |
4.6 |
5.6 |
Discounting factor |
|
|
|
|
|
|
|
|
|
|
|
|
DCF |
|
|
|
|
|
|
1.04 |
0.93 |
0.82 |
0.72 |
0.64 |
0.56 |
DDM |
|
|
|
|
|
1.04 |
0.92 |
0.79 |
0.69 |
0.59 |
0.51 |
0.45 |
|
|
|
|
|
|
|
|
|
|
|
|
|
TP (DCF), RUB/s |
|
|
|
TP (w-average, rounded), RUB/s |
|
|
Valuation |
|
DDM |
DCF |
||
Value and share price |
Fair value |
Adj. % |
|
TP |
|
RUB/s |
Weights |
|
CoE |
|
15.5% |
|
|
|
|
|
|
|
|
|
|
|
|||
EV of core assets |
571 |
|
|
DDM |
|
0.75 |
100% |
|
WACC |
|
|
13.2% |
Net debt / (cash), end 2018 |
(408) |
|
|
DCF |
|
0.56 |
0% |
|
TG (Dividends) |
|
3.5% |
|
Non-core assets |
20 |
|
|
Result (rounded) |
|
0.75 |
100% |
|
TG (FCF) |
|
|
3.0% |
Equity (incl. minority share) |
183 |
|
|
|
|
|
|
|
|
|
|
|
Minority share |
(45) |
-24% |
|
|
|
|
|
|
|
|
|
|
Equity exl minority share) |
139 |
|
|
|
|
|
|
|
|
|
|
|
Holding discount |
(28) |
-20% |
|
|
|
|
|
|
Comment |
|
|
|
Equity value (excl minority stake and holding discount) |
111 |
|
|
|
|
|
|
|
|
|
|
|
# of shares (effective), bln |
200 |
|
|
|
|
|
|
|
|
|
|
|
TP (DCF), RUB |
0.56 |
|
|
|
|
|
|
|
|
|
|
|
Source: company data, Gazprombank estimates
47
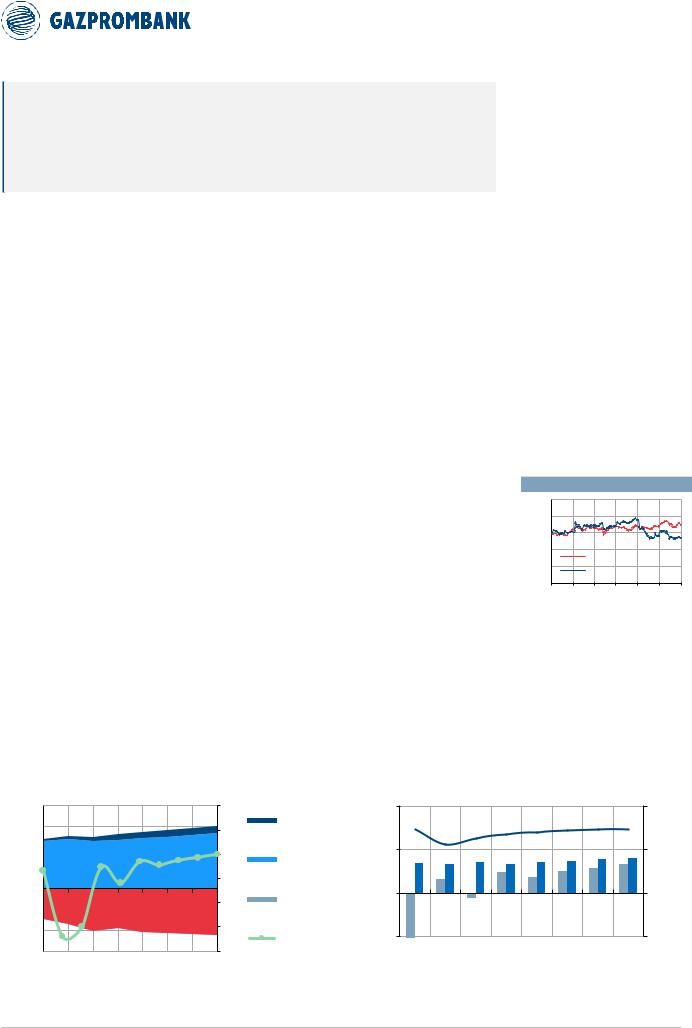
vk.com/id446425943
NOVEMBER 23, 2018 |
RUSSIA > EQUITY RESEARCH > UTILITIES |
|
|
INITIATION OF COVERAGE
Federal Grid Company (FSK)
RU
SSI
Solid dividend stream stimulated by cash needs of core shareholder (Russian Grids) but not fully backed by FCF
Based on its new dividend policy, FSK should broadly sustain its solid dividend stream, which is currently partly used to finance other subsidiaries of its core shareholder (ROSSETI or Russian Grids), but this stream is not fully backed by FCF.
Operations
Dominant owner of Russia’s backbone high-voltage electricity grid (220 kV or higher) and key source of dividends for its ~80% parent ROSSETI (Russian Grids).
Positives
Solid dividend payments on the back of 2015-17 results.
Note: Share prices as of closure 20-Nov-2018
TICKER |
FEES RX |
Currency |
RUB |
|
|
Target price |
0.17 |
Upside |
13% |
|
|
Recommendation |
Neutral |
MCap, bln |
192 |
|
|
Share price |
0.15 |
52-week high |
0.19 |
|
|
52-week low |
0.15 |
|
|
Source: Bloomberg, Gazprombank estimates
New dividend policy (2018) provides a structural approach to calculation of dividends: 50% of adjusted net income under IFRS or RAS, whichever is largest.
Major revenues for connecting generators to the network in 2015-21 represent an additional source of cash flow, albeit paid in arrears (10 years with 6% interest).
Accelerated growth in electricity transportation tariffs for consumers directly connected to FSK is being considered by the government.
Negatives
To become the basis for dividend, net profit is reduced by a) the difference in RAS and IFRS depreciations, b) non-cash part of "connection" revenues, c) portion of net profit allocated to CapEx, c) revaluation of financial assets (e.g. InterRAO stake)
Modest medium-term growth in electricity transportation tariffs envisioned by the government (~3% p.a.).
Substantial leverage: Net Debt/EBITDA’18 (connection adjusted) = ~1.8x
Uncertainty over medium-term capex program, which undergoes regular adjustments.
Valuation
PE'18=~6x (RAS-based), DY'18=~10%.
Our TP is based on DDM, even though we run DCF as well. Our forecasts for FSK are based on RAS, which effectively has been driving dividends in recent years
|
SHAREHOLDERS |
|
|
|
|
||
|
|
|
|
|
|||
|
|
Russian Grids |
80.1% |
|
|||
|
|
(Rosseti) |
|
||||
|
|
|
|
|
|||
|
|
Federal Property |
|
|
|
0.6% |
|
|
|
Management Agency |
|
|
|
|
|
|
|
|
|
|
|
|
|
|
|
Free-float |
19.3% |
|
|||
|
|
|
|
|
|
|
|
Source: company data
12M PRICE PERFORMANCE
140% |
|
|
|
|
|
120% |
|
|
|
|
|
100% |
|
|
|
|
|
80% |
|
MOEX INDEX |
|
|
|
|
|
|
|
||
60% |
|
FEES (FSK) |
|
|
|
|
|
|
|
||
40% |
Jan-18 |
Mar-18 |
May-18 |
Jul-18 |
|
Nov-17 |
Sep-18 |
||||
Source: Bloomberg
Chart 59. FSK: FCF profile |
Chart 60. FSK: FCFY and DY profile |
EBITDA (lhs), capex (lhs), FCFY (rhs) |
FCFY (lhs), DY (lhs) and dividend payout vs connection-adj RAS profit (rhs) |
200 |
EBITDA, Capex |
|
|
|
|
30% |
|
|
|
|
|
FCFY (line) |
|||
|
RUB bln |
|
|
|
|
||
150 |
|
|
|
|
|
20% |
|
|
|
|
|
|
|
|
|
100 |
|
|
|
|
|
|
10% |
|
|
|
|
|
|
|
|
50 |
|
|
|
|
|
|
|
|
|
|
|
|
|
|
0% |
- |
|
|
|
|
|
|
|
(50) |
|
|
|
|
|
|
-10% |
|
|
|
|
|
|
|
|
(100) |
|
|
|
|
|
|
-20% |
|
|
|
|
|
|
|
|
(150) |
|
|
|
|
|
|
-30% |
2016 |
2017 |
2018E |
2019E |
2020E |
2021E |
2022E |
2023E |
30%
CONNECTIO |
|
N (ONE- |
|
OFF): CASH |
15% |
|
|
EBITDA: |
|
CONNECTIO |
|
N-ADJ |
|
CAPEX |
0% |
|
|
FCF YIELD |
-15% |
FCFY and DY (bars)
2016 |
2017 |
2018E |
2019E |
2020E |
2021E |
|||
|
|
|
FCF YIELD (LHS) |
|
|
|
||
|
|
|
|
|
|
|||
|
|
|
|
|
|
|||
|
100% |
Dividend payout |
|
|
(line) |
|
50% |
|
0% |
|
-50% |
2022E |
2023E |
DIVIDEND YIELD (LHS)
Source: company data, Gazprombank estimates |
Source: company data, Gazprombank estimates |
48

vk.com/id446425943
NOVEMBER 23, 2018 RUSSIA > EQUITY RESEARCH > UTILITIES
Table 13. Federal Grid Company (FSK) forecast (RAS-based) and valuation, RUB bln or RUB per share
P&L (RAS), RUB bln: FSK |
2013 |
2014 |
2015 |
2016 |
2017 |
2018E |
2019E |
2020E |
2021E |
2022E |
2023E |
TV'2024E |
Electricity transportation |
152.7 |
159.9 |
159.0 |
171.1 |
192.6 |
214.0 |
221.5 |
229.3 |
237.3 |
245.7 |
254.3 |
|
Connection: regular |
1.0 |
2.0 |
1.4 |
7.5 |
2.4 |
2.2 |
2.0 |
1.9 |
1.9 |
1.9 |
1.8 |
|
Connection: one-off |
0.0 |
5.0 |
11.0 |
38.0 |
19.0 |
20.7 |
16.7 |
13.8 |
5.0 |
3.0 |
0.0 |
|
Reselling |
0.0 |
0.0 |
0.0 |
0.0 |
0.0 |
0.0 |
0.0 |
0.0 |
0.0 |
0.0 |
0.0 |
|
Construction |
0.0 |
0.0 |
0.0 |
0.0 |
0.0 |
0.0 |
0.0 |
0.0 |
0.0 |
0.0 |
0.0 |
|
Other |
1.6 |
2.0 |
1.9 |
1.7 |
2.0 |
2.4 |
2.2 |
2.0 |
1.8 |
1.6 |
1.4 |
|
Revenue |
155.4 |
168.9 |
173.3 |
218.3 |
216.0 |
239.2 |
242.4 |
246.9 |
246.0 |
252.1 |
257.6 |
|
Transmission Cash Opex: variable |
(13.7) |
(13.3) |
(14.3) |
(14.7) |
(24.2) |
(39.6) |
(40.9) |
(42.4) |
(43.9) |
(45.4) |
(47.0) |
|
Purchased power (reselling) |
0.0 |
0.0 |
0.0 |
0.0 |
0.0 |
0.0 |
0.0 |
0.0 |
0.0 |
0.0 |
0.0 |
|
Cost of construction |
0.0 |
0.0 |
0.0 |
0.0 |
0.0 |
0.0 |
0.0 |
0.0 |
0.0 |
0.0 |
0.0 |
|
Gross profit |
141.7 |
155.7 |
158.9 |
203.5 |
191.8 |
199.7 |
201.4 |
204.5 |
202.1 |
206.7 |
210.5 |
|
Transmission Cash Opex: fixed |
(42.5) |
(49.0) |
(51.3) |
(51.8) |
(54.5) |
(64.8) |
(67.3) |
(70.0) |
(72.6) |
(75.2) |
(77.8) |
|
EBITDA |
99.1 |
106.7 |
107.7 |
151.8 |
137.3 |
134.9 |
134.1 |
134.6 |
129.5 |
131.5 |
132.7 |
|
Depreciation |
(76.7) |
(78.0) |
(77.2) |
(81.5) |
(82.0) |
(80.3) |
(83.5) |
(85.5) |
(88.2) |
(90.8) |
(93.6) |
|
EBIT |
22.4 |
28.7 |
30.5 |
70.3 |
55.4 |
54.6 |
50.5 |
49.1 |
41.4 |
40.6 |
39.1 |
|
Finance income / (costs), net |
3.6 |
0.5 |
(0.3) |
1.6 |
4.7 |
4.6 |
(0.2) |
(0.2) |
(0.2) |
(0.2) |
(0.2) |
|
Share of results of associates |
0.0 |
0.0 |
0.0 |
0.3 |
1.9 |
2.3 |
1.9 |
1.5 |
1.2 |
1.0 |
0.8 |
|
Non-cash and one-offs |
(43.7) |
(15.1) |
(2.4) |
52.2 |
(1.4) |
0.0 |
0.0 |
0.0 |
0.0 |
0.0 |
0.0 |
|
EBT |
(17.8) |
14.0 |
27.8 |
124.3 |
60.6 |
61.5 |
52.2 |
50.3 |
42.3 |
41.4 |
39.7 |
|
Income tax |
(8.1) |
(8.9) |
(9.9) |
(18.2) |
(18.2) |
(12.9) |
(11.0) |
(10.6) |
(8.9) |
(8.7) |
(8.3) |
|
Net profit: pre-minorities |
(25.9) |
5.1 |
17.9 |
106.1 |
42.4 |
48.6 |
41.2 |
39.8 |
33.5 |
32.7 |
31.3 |
|
Minority |
0.0 |
0.0 |
0.0 |
0.0 |
0.0 |
0.0 |
0.0 |
0.0 |
0.0 |
0.0 |
0.0 |
|
Net profit: post-minorities |
(25.9) |
5.1 |
17.9 |
106.1 |
42.4 |
48.6 |
41.2 |
39.8 |
33.5 |
32.7 |
31.3 |
|
EBITDA: connection-adj |
99.1 |
101.7 |
96.7 |
113.8 |
118.3 |
114.3 |
117.4 |
120.8 |
124.5 |
128.5 |
132.7 |
|
Net profit: connection-adj (post-minorities) |
20.5 |
19.1 |
15.2 |
27.0 |
33.9 |
32.3 |
28.1 |
28.9 |
29.5 |
30.3 |
31.3 |
|
Difference in depreciation (vs RAS) |
|
0.0 |
0.0 |
0.0 |
0.0 |
0.0 |
0.0 |
0.0 |
0.0 |
0.0 |
0.0 |
|
Connection revenue: one-off, cash (post-tax) |
0.0 |
0.4 |
1.3 |
4.4 |
6.1 |
8.1 |
9.9 |
11.6 |
12.7 |
13.7 |
14.5 |
|
Financial support of subsidiaries |
0.0 |
0.0 |
0.0 |
0.0 |
0.0 |
0.0 |
0.0 |
0.0 |
0.0 |
0.0 |
0.0 |
|
Net profit: adj (for dividends) |
20.5 |
19.5 |
16.5 |
31.3 |
40.1 |
40.4 |
38.0 |
40.5 |
42.2 |
44.0 |
45.9 |
|
Net Debt, RUB/s |
|
|
|
|
|
|
|
|
|
|
|
TV'2024E |
Net (debt) / cash, year end |
(229.5) |
(220.1) |
(220.2) |
(227.8) |
(221.1) |
(179.4) |
(186.0) |
(194.3) |
(200.4) |
(205.0) |
(207.8) |
(265.4) |
Net debt / EBITDA (connection adjusted): year average |
2.3 |
2.2 |
2.3 |
2.0 |
1.9 |
1.8 |
1.6 |
1.6 |
1.6 |
1.6 |
1.6 |
2.0 |
Dividend, RUB/s |
|
|
|
|
|
|
|
|
|
|
|
TV'2024E |
DPS: Ordinary |
0.000 |
0.001 |
0.013 |
0.015 |
0.015 |
0.016 |
0.015 |
0.016 |
0.017 |
0.017 |
0.018 |
0.15 |
DPS: Special (leverage optimization) |
|
|
|
|
|
|
|
|
|
|
|
0.05 |
DPS: Special (non-core assets sale) |
|
|
|
|
|
|
|
|
|
|
|
0.02 |
DPS: Total |
0.000 |
0.001 |
0.013 |
0.015 |
0.015 |
0.016 |
0.015 |
0.016 |
0.017 |
0.017 |
0.018 |
0.21 |
Dividend / Net profit (for dividends) |
2% |
4% |
103% |
63% |
47% |
50% |
50% |
50% |
50% |
50% |
50% |
|
Dividend / Net profit (connection-adj) |
2% |
4% |
112% |
73% |
56% |
63% |
68% |
70% |
72% |
73% |
73% |
|
Multiples |
|
|
|
|
|
|
|
|
|
|
|
|
FCF Yield |
-26% |
3% |
-24% |
-20% |
5% |
-2% |
7% |
6% |
7% |
9% |
10% |
|
DY (Ords) |
0% |
0% |
9% |
10% |
10% |
10% |
10% |
11% |
11% |
11% |
12% |
143% |
EV/EBITDA |
4.0 |
3.6 |
3.6 |
2.6 |
2.8 |
2.6 |
2.6 |
2.7 |
2.8 |
2.8 |
2.8 |
|
EV/EBITDA (connection-adj) |
4.0 |
3.8 |
4.0 |
3.5 |
3.3 |
3.0 |
3.0 |
3.0 |
2.9 |
2.9 |
2.8 |
|
PE (adjusted) |
9.4 |
10.1 |
12.6 |
7.1 |
5.7 |
5.9 |
6.8 |
6.6 |
6.5 |
6.3 |
6.1 |
|
Cash Flow, RUB bn |
|
|
|
|
|
|
|
|
|
|
|
TV'2024E |
EBITDA: connection-adj |
99.1 |
101.7 |
96.7 |
113.8 |
118.3 |
114.3 |
117.4 |
120.8 |
124.5 |
128.5 |
132.7 |
|
Connection (one-off): cash |
0.0 |
0.5 |
1.6 |
5.5 |
7.8 |
10.3 |
12.6 |
14.7 |
16.1 |
17.4 |
18.4 |
|
(Tax) |
(8.1) |
(8.9) |
(9.9) |
(18.2) |
(18.2) |
(12.9) |
(11.0) |
(10.6) |
(8.9) |
(8.7) |
(8.3) |
|
Changes in working capital |
0.0 |
0.0 |
(36.7) |
(43.2) |
0.0 |
0.0 |
0.0 |
0.0 |
0.0 |
0.0 |
0.0 |
|
Capex |
(122.1) |
(74.2) |
(74.6) |
(74.9) |
(86.5) |
(103.6) |
(95.8) |
(104.4) |
(107.1) |
(109.9) |
(112.6) |
|
FCF (to EV) |
(31.1) |
19.1 |
(22.9) |
(17.1) |
21.3 |
8.0 |
23.2 |
20.6 |
24.6 |
27.3 |
30.2 |
364.1 |
Interest : CF |
(19.2) |
(12.9) |
(23.1) |
(21.2) |
(12.2) |
(11.8) |
(9.6) |
(10.0) |
(10.4) |
(10.7) |
(11.0) |
|
FCF (to equity) |
(50.3) |
6.2 |
(46.0) |
(38.2) |
9.1 |
(3.8) |
13.6 |
10.6 |
14.2 |
16.5 |
19.2 |
|
Discounting parameters |
|
|
|
|
|
|
|
|
|
|
|
TV'2024E |
Period for discounting, years |
|
|
|
|
|
|
|
|
|
|
|
|
DCF |
|
|
|
|
|
(1.4) |
(0.4) |
0.6 |
1.6 |
2.6 |
3.6 |
4.6 |
DDM |
|
|
|
|
|
(0.4) |
0.6 |
1.6 |
2.6 |
3.6 |
4.6 |
5.6 |
Discounting factor |
|
|
|
|
|
|
|
|
|
|
|
|
DCF |
|
|
|
|
|
|
1.04 |
0.93 |
0.82 |
0.72 |
0.64 |
0.56 |
DDM |
|
|
|
|
|
1.04 |
0.92 |
0.79 |
0.69 |
0.59 |
0.51 |
0.45 |
|
|
|
|
|
|
|
|
|
|
|
|
|
TP (DCF), RUB/s |
|
|
|
TP (w-average, rounded), RUB/s |
|
|
Valuation |
|
DDM |
DCF |
||
Value and share price |
Fair value |
Adj. % |
|
TP |
|
RUB/s |
Weights |
|
CoE |
|
15.5% |
|
|
|
|
|
|
|
|
|
|
|
|||
EV of core assets |
308 |
|
|
DDM |
|
0.17 |
100% |
|
WACC |
|
|
13.2% |
Net debt / (cash), end 2018 |
(179) |
|
|
DCF |
|
0.13 |
0% |
|
TG (Dividends) |
|
3.5% |
|
Non-core assets |
25 |
|
|
Result (rounded) |
|
0.17 |
100% |
|
TG (FCF) |
|
|
3.0% |
Equity (incl. minority share) |
153 |
|
|
|
|
|
|
|
|
|
|
|
Minority share |
- |
0% |
|
|
|
|
|
|
|
|
|
|
Equity exl minority share) |
153 |
|
|
|
|
|
|
|
|
|
|
|
Holding discount |
- |
0% |
|
|
|
|
|
|
Comment |
|
|
|
Equity value (excl minority stake and holding discount) |
153 |
|
|
|
|
|
|
|
|
|
|
|
# of shares (effective), bln |
1,275 |
|
|
|
|
|
|
|
|
|
|
|
TP (DCF), RUB |
0.13 |
|
|
|
|
|
|
|
|
|
|
|
Source: company data, Gazprombank estimates
49

vk.com/id446425943
NOVEMBER 23, 2018 RUSSIA > EQUITY RESEARCH > UTILITIES
APPENDIX 1: SENSITIVITY TO VALUATION PARAMETERS
Table 14. Sensitivity of DCF-based target price to WACC and terminal growth: RusHydro
WACC
|
|
|
0.72 |
|
12.4% |
|
|
12.9% |
|
13.4% |
|
|
13.9% |
|
|
14.4% |
|
|
|||||
|
|
|
1.0% |
0.74 |
|
0.72 |
|
0.68 |
|
|
0.65 |
|
|
0.62 |
|
|
|||||||
|
TG |
|
1.5% |
0.74 |
|
0.73 |
|
0.70 |
|
|
0.66 |
|
|
0.63 |
|
|
|||||||
|
|
|
|
|
|
|
|
|
|
||||||||||||||
|
|
|
|
|
|
|
|
|
|
|
|
|
|
|
|
|
|
|
|
|
|
|
|
|
|
2.0% |
0.74 |
|
0.73 |
|
0.72 |
|
|
0.68 |
|
|
0.65 |
|
|
||||||||
|
|
|
|
|
|
|
|
|
|
|
|||||||||||||
|
|
|
2.5% |
0.74 |
|
0.73 |
|
0.72 |
|
|
0.69 |
|
|
0.66 |
|
|
|||||||
|
|
|
|
|
0.74 |
|
0.73 |
|
0.72 |
|
|
0.70 |
|
|
0.67 |
|
|
||||||
|
|
|
3.0% |
|
|
|
|
|
|
|
|
||||||||||||
|
|
|
|
|
|
|
|
|
|
|
|
|
|
|
|
Source: Gazprombank estimates |
|
||||||
|
Table 15. Sensitivity of DCF-based target price to WACC and terminal growth: Inter RAO |
|
|
|
|
|
|
|
|
|
|
|
|||||||||||
|
|
|
|
|
|
|
|
|
|
|
|
|
|
|
|
|
|
|
|
|
|
|
|
|
|
|
|
|
|
|
|
|
|
WACC |
|
|
|
|
|
|
|
|
|
|
|
||
|
|
|
8.4 |
12.4% |
|
|
12.9% |
|
13.4% |
|
|
13.9% |
|
|
|
14.4% |
|
|
|||||
|
|
|
1.0% |
8.6 |
|
8.4 |
|
8.2 |
|
|
8.0 |
|
|
7.8 |
|
|
|||||||
|
|
|
|
|
|
|
|
|
|
|
|||||||||||||
|
TG |
|
|
8.7 |
|
8.5 |
|
8.3 |
|
|
8.1 |
|
|
7.9 |
|
|
|||||||
|
|
|
|
|
|
|
|
|
|
|
|||||||||||||
|
1.5% |
|
|
|
|
|
|
|
|
||||||||||||||
|
|
|
|
|
|
|
|
|
|
|
|
|
|
|
|
|
|
|
|
|
|
||
|
2.0% |
8.8 |
|
8.6 |
|
8.4 |
|
|
8.1 |
|
|
8.0 |
|
|
|||||||||
|
|
|
|
|
|
|
|
|
|
|
|||||||||||||
|
|
|
2.5% |
8.9 |
|
8.7 |
|
8.4 |
|
|
8.2 |
|
|
8.0 |
|
|
|||||||
|
|
|
|
|
|
|
|
|
|
|
|||||||||||||
|
|
|
|
|
9.1 |
|
8.8 |
|
8.5 |
|
|
8.3 |
|
|
8.1 |
|
|
||||||
|
|
|
3.0% |
|
|
|
|
|
|
|
|
||||||||||||
|
|
|
|
|
|
|
|
|
|
|
|
|
|
|
|
Source: Gazprombank estimates |
|
||||||
|
Table 16. Sensitivity of DCF-based target price to WACC and terminal growth (new assets): Unipro |
|
|
|
|
|
|
|
|
||||||||||||||
|
|
|
|
|
|
|
|
|
|
|
|
|
|
|
|
|
|
|
|
|
|
|
|
|
|
|
|
|
|
|
|
|
|
WACC |
|
|
|
|
|
|
|
|
|
|
|
||
|
|
|
2.9 |
|
11.5% |
|
|
12.0% |
|
|
12.5% |
|
|
13.0% |
|
|
13.5% |
|
|||||
|
|
|
|
|
|
|
|
|
|
|
|
|
|
|
|
|
|
|
|
||||
|
|
|
2.5% |
|
3.1 |
|
|
3.0 |
|
|
2.9 |
|
|
2.8 |
2.7 |
|
|||||||
|
|
|
|
|
|
|
|
|
|
|
|||||||||||||
|
TG |
|
3.0% |
|
3.1 |
|
|
3.0 |
|
|
2.9 |
|
|
2.8 |
2.7 |
|
|||||||
|
|
|
|
|
|
|
|
|
|
||||||||||||||
|
|
|
|
|
|
|
|
|
|
||||||||||||||
|
(new assets) |
|
3.5% |
|
3.1 |
|
|
3.0 |
|
|
2.9 |
|
|
2.8 |
2.8 |
|
|||||||
|
|
|
|
|
|
|
|
|
|
|
|
|
|
|
|
|
|
|
|||||
|
|
|
4.0% |
|
3.2 |
|
|
3.1 |
|
|
3.0 |
|
|
2.9 |
2.8 |
|
|||||||
|
|
|
|
|
|
|
|
|
|
|
|||||||||||||
|
|
|
|
|
3.2 |
|
|
3.1 |
|
|
3.0 |
|
|
2.9 |
2.8 |
|
|||||||
|
|
|
|
|
|
|
|
|
|
|
|
||||||||||||
|
|
|
4.5% |
|
|
|
|
|
|
|
|
||||||||||||
|
|
|
|
|
|
|
|
|
|
|
|
|
|
|
|
|
|
|
|
|
|
|
|
|
|
|
|
|
|
|
|
|
|
|
|
|
|
|
|
Source: Gazprombank estimates |
|||||||
|
Table 17. Sensitivity of DCF-based target price to WACC and terminal growth (new assets): Enel Russia |
|
|
|
|
|
|
|
|
||||||||||||||
|
|
|
|
|
|
|
|
|
|
|
|
|
|
|
|
|
|
|
|
|
|
|
|
|
|
|
|
|
|
|
|
|
|
WACC |
|
|
|
|
|
|
|
|
|
|
|
||
|
|
|
0.94 |
|
11.7% |
|
|
12.2% |
|
|
12.7% |
|
|
13.2% |
|
|
13.7% |
|
|||||
|
|
|
3.0% |
|
1.04 |
|
|
0.95 |
|
0.87 |
|
|
0.80 |
0.73 |
|
||||||||
|
TG |
|
3.5% |
|
1.08 |
|
|
0.99 |
|
0.90 |
|
|
0.83 |
0.76 |
|
||||||||
|
|
|
|
|
|
|
|
|
|||||||||||||||
|
(new assets) |
|
4.0% |
|
1.12 |
|
|
1.03 |
|
0.94 |
|
|
0.85 |
0.78 |
|
||||||||
|
|
|
|
|
|
|
|
|
|
|
|
|
|
|
|
||||||||
|
|
|
4.5% |
|
1.18 |
|
|
1.07 |
|
0.97 |
|
|
0.89 |
0.81 |
|
||||||||
|
|
|
|
|
1.24 |
|
|
1.12 |
|
1.02 |
|
|
0.92 |
0.84 |
|
||||||||
|
|
|
|
|
|
|
|
|
|
|
|||||||||||||
|
|
|
5.0% |
|
|
|
|
|
|
|
|||||||||||||
|
|
|
|
|
|
|
|
|
|
|
|
|
|
|
|
|
|
|
|
|
|
|
|
50