

GPB_Russian Utilities Initiation_231118_watermark
.pdfvk.com/id446425943
COMPANIES
vk.com/id446425943
INITIATION OF COVERAGE
RusHydro
Shareholder value is driven by sustainability of regulatory support for Far East operations
RU
SSI
Regulatory support for Far East operations should trigger healthy group-wide FCFY and DY if sustained over a multi-year period as currently mulled by the government.
Operations
Valuable core business (hydro generation ~30 GW) coupled with not self-sufficient Far East operators, additionally supported by uplift to RusHydro’s capacity prices in other regions.
Positives
Solid potential value of core assets base (hydro generation)
Approaching start of positive FCFY (~2019-20) and FCFY-to-CoE premium (~2021-22).
Regulatory support for Far East operations via an uplift to RusHydro's capacity prices in other regions (RUB 35 bln in 2018).
Potential prolongation of regulatory support until 2028 is being considered by the government following a proposal by the President (RIA Novosti, Kommersant).
Practically applied dividend payout of 50% of IFRS net income, with potential protection against a dividend decline via setting a dividend floor as the past 3Y average.
Negatives
Substantial sensitivity of profits and FCF to regulatory support for Far East operations. Unclear value of regulatory support in the medium term.
Risk of further increase in Far East capex, as the Energy Ministry envisions the addition of 1.3 GW of capacity at a total cost of ~RUB 150 bln as part of the “modernization” program.
Forward contract to compensate VTB for the gap between the market and the “target” value of its stake in RusHydro (55 bln shares) in 1H22 currently has negative value.
Downward pressure on dividends (calculated as 50% of net profit) due to the nonmonetary writedowns of the value of fixed or financial assets.
Risk of delays to introduction of thermal plants in the Far East (Sakhalin-2, Sov. Gavan).
Unclear timing and costs of recovery of Zagorskaya PSS-2 (accumulated costs of ~RUB 70 bln). Risk of subsequent writedowns that may affect net profit and dividends.
Exclusion from MSCI Russia Index (November 2018) to trigger fund outflow (~$65 mln).
Valuation (2018-2026)
FCFY-to-CoE premium: 2021-26.
DY-to-CoD premium: 2021-26.
Note: Share prices as of closure 20-Nov-2018
TICKER |
HYDR RX |
Currency |
RUB |
|
|
Target price |
0.70 |
Upside |
32% |
|
|
Recommendation |
Overweight |
MCap, bln |
226 |
|
|
Share price |
0.53 |
52-week high |
0.85 |
|
|
52-week low |
0.52 |
|
|
Source: Bloomberg, Gazprombank estimates
|
SHAREHOLDERS |
|
|
|
|
|
|
|
Russian Federation |
60.6% |
|
|
|
|
|
|
VTB Bank |
|
13.3% |
|
Avitrans |
6.0% |
|
|
|
|
|
|
Quasi-treasury |
|
0.9% |
|
Free-float |
|
19.2% |
|
|
|
|
Source: company data
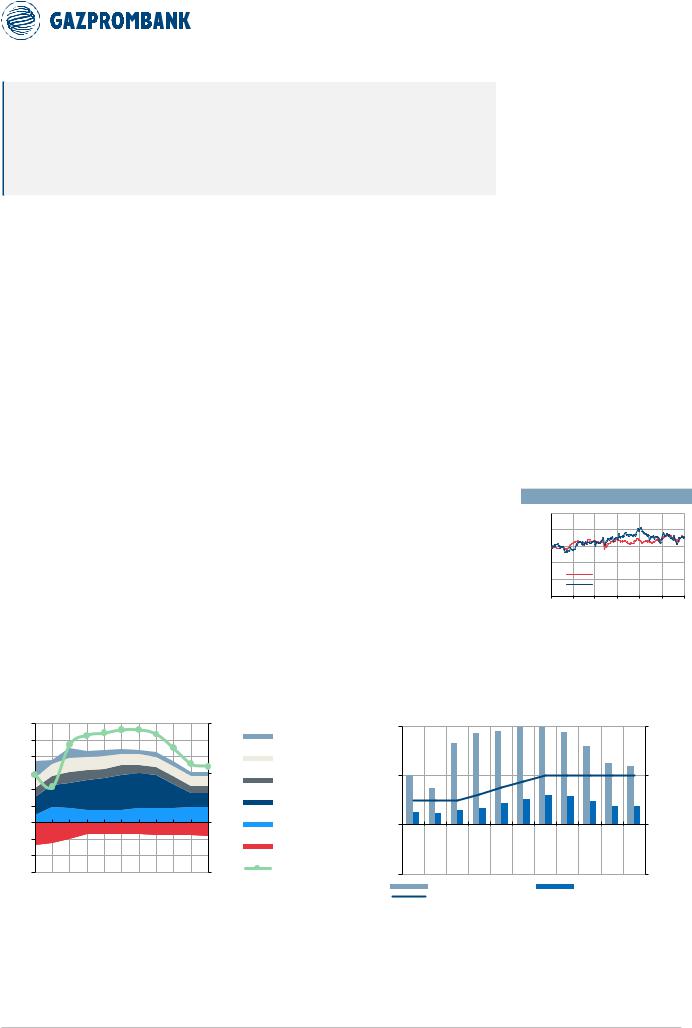
12M PRICE PERFORMANCE
140% |
|
|
|
|
|
120% |
|
|
|
|
|
100% |
|
|
|
|
|
80% |
|
|
|
|
|
60% |
|
MOEX INDEX |
|
|
|
|
HYDR |
|
|
|
|
|
|
|
|
|
|
40% |
Jan-18 |
Mar-18 |
May-18 |
Jul-18 |
|
Nov-17 |
Sep-18 |
||||
Source: Bloomberg
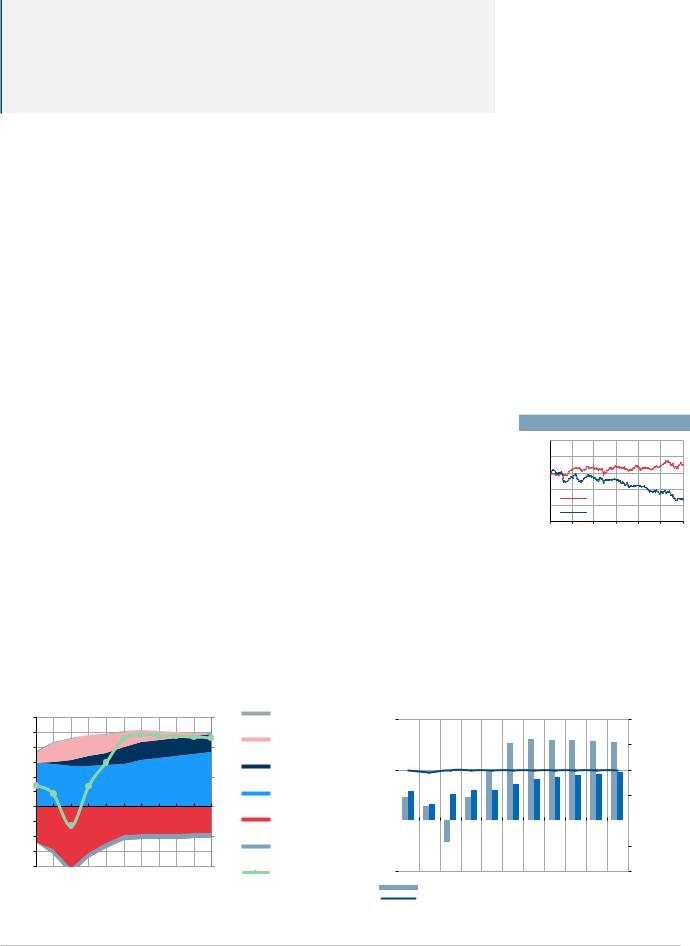
Chart 43. RusHydro: FCF profile |
Chart 44. RusHydro: FCFY and DY profile |
EBITDA (lhs), capex (lhs), FCFY (rhs)-for RusHydro hydro generation |
FCFY (lhs), DY (lhs) and dividend payout vs IFRS net profit (rhs) |
150 |
EBITDA, Capex |
|
|
|
|
|
|
30% |
|||
125 |
|
|
|
|
FCFY (line) |
||||||
RUB bln |
|
|
|
|
|
||||||
|
|
|
|
|
|
|
|
||||
100 |
|
|
|
|
|
|
|
|
|
|
20% |
75 |
|
|
|
|
|
|
|
|
|
|
|
50 |
|
|
|
|
|
|
|
|
|
|
10% |
25 |
|
|
|
|
|
|
|
|
|
|
|
0 |
|
|
|
|
|
|
|
|
|
|
0% |
-25 |
|
|
|
|
|
|
|
|
|
|
|
-50 |
|
|
|
|
|
|
|
|
|
|
-10% |
-75 |
|
|
|
|
|
|
|
|
|
|
|
-100 |
|
|
|
|
|
|
|
|
|
|
-20% |
|
2016 |
2017 |
2018E |
2019E |
2020E |
2021E |
2022E |
2023E |
2024E |
2025E |
2026E |
RETAIL |
30% |
|
|
||
SUBSIDIES |
|
|
(FAR EAST) |
|
|
NEW |
15% |
|
GENERATION |
||
|
||
HYDRO |
|
|
GENERATION: |
|
|
OLD |
0% |
|
CAPEX |
||
UES OF EAST |
|
|
(W/O |
|
|
SUBSIDIES) |
-15% |
|
FCFY |
|
FCFY and DY |
|
|
|
|
|
|
Dividend |
|
100% |
||||
|
|
|
|
|
|
|
|
|||||||
|
|
|
|
|
|
|
|
|
|
|||||
|
(columns) |
|
|
|
|
|
|
|
payout (line) |
|
75% |
|||
|
|
|
|
|
|
|
|
|
|
|
|
|
||
|
|
|
|
|
|
|
|
|
|
|
|
|
50% |
|
|
|
|
|
|
|
|
|
|
|
|
|
|
25% |
|
|
|
|
|
|
|
|
|
|
|
|
|
|
|
0% |
|
2016 |
2017 |
2018E |
2019E |
2020E |
2021E |
2022E |
2023E |
2024E |
2025E |
2026E |
|
|
|
|
|
-25% |
||||||||||||
|
|
|
|
|||||||||||
|
|
|
|
|
|
|
|
|
|
|
|
|
-50% |
|
|
|
FCF YIELD (LHS) |
|
|
|
|
DIVIDEND YIELD (LHS) |
|||||||
|
|
|
|
|
|
|||||||||
|
|
|
|
|
|
|||||||||
|
|
DIVIDEND PAYOUT (RHS) |
|
|
|
|
|
|
|
|
||||
Source: company data, Gazprombank estimates |
Source: company data, Gazprombank estimates |
32

vk.com/id446425943
NOVEMBER 23, 2018 RUSSIA > EQUITY RESEARCH > UTILITIES
Table 5. RusHydro forecast (IFRS-based) and valuation, RUB bln or RUB per share
P&L |
2013 |
2014 |
2015 |
2016 |
2017 |
2018E |
2019E |
2020E |
2021E |
2022E |
2023E |
2024E |
2025E |
2026E |
TV'2027 |
Hydro generation (& new Far East units) |
108.8 |
108.5 |
107.1 |
114.9 |
120.5 |
128.3 |
135.5 |
147.9 |
155.9 |
160.8 |
165.1 |
169.4 |
173.6 |
177.9 |
|
UES of East (w/o subsidies) |
139.6 |
150.3 |
162.7 |
175.5 |
168.5 |
162.9 |
164.7 |
166.4 |
168.2 |
170.0 |
171.3 |
172.5 |
173.8 |
175.0 |
|
Subsidies (for Far East) |
13.2 |
12.4 |
14.3 |
17.3 |
32.7 |
35.0 |
35.0 |
30.0 |
25.0 |
20.0 |
15.0 |
10.0 |
5.0 |
0.0 |
|
Retail |
79.2 |
82.2 |
87.0 |
88.7 |
61.8 |
60.4 |
61.0 |
61.7 |
62.3 |
63.0 |
63.5 |
64.0 |
64.5 |
65.0 |
|
Other & Eliminations |
(13.9) |
(11.4) |
(9.2) |
(5.0) |
(2.8) |
(3.0) |
(3.0) |
(3.0) |
(3.0) |
(3.0) |
(3.0) |
(3.0) |
(3.0) |
(3.0) |
|
Revenue |
326.9 |
342.0 |
361.8 |
391.3 |
380.9 |
383.6 |
393.3 |
403.1 |
408.5 |
410.8 |
411.8 |
412.9 |
413.9 |
414.9 |
|
Hydro generation (& new Far East units) |
63.1 |
57.3 |
59.4 |
73.2 |
74.0 |
77.8 |
84.3 |
89.7 |
100.5 |
107.6 |
111.0 |
114.3 |
117.7 |
121.1 |
|
UES of East (w/o subsidies) |
3.8 |
3.0 |
(1.5) |
6.6 |
(9.4) |
(8.5) |
(8.5) |
(8.5) |
(8.5) |
(8.5) |
(8.5) |
(8.5) |
(8.5) |
(8.5) |
|
Subsidies (for Far East) |
13.2 |
12.4 |
14.3 |
17.3 |
32.7 |
35.0 |
35.0 |
30.0 |
25.0 |
20.0 |
15.0 |
10.0 |
5.0 |
0.0 |
|
Retail |
0.7 |
1.1 |
2.9 |
2.9 |
1.6 |
1.3 |
1.4 |
1.4 |
1.4 |
1.4 |
1.4 |
1.4 |
1.4 |
1.4 |
|
Other & Eliminations |
(1.5) |
(4.3) |
1.2 |
5.2 |
2.3 |
(1.0) |
(0.8) |
(0.5) |
(0.3) |
0.0 |
0.0 |
0.0 |
0.0 |
0.0 |
|
EBITDA |
79.3 |
69.6 |
76.3 |
105.2 |
101.2 |
104.7 |
111.4 |
112.1 |
118.2 |
120.5 |
118.9 |
117.2 |
115.6 |
114.0 |
|
Hydro generation (& new Far East units) |
(11.4) |
(12.2) |
(12.5) |
(13.6) |
(14.7) |
(16.7) |
(16.7) |
(17.0) |
(17.3) |
(17.4) |
(17.6) |
(17.6) |
(17.6) |
(17.6) |
|
UES of East |
(5.2) |
(7.3) |
(7.6) |
(7.7) |
(8.0) |
(8.6) |
(8.7) |
(8.8) |
(8.9) |
(9.0) |
(9.0) |
(9.0) |
(9.0) |
(9.0) |
|
Retail |
(0.7) |
(0.7) |
(0.8) |
(0.8) |
(0.2) |
(0.3) |
(0.3) |
(0.3) |
(0.3) |
(0.3) |
(0.3) |
(0.3) |
(0.3) |
(0.3) |
|
Other & Eliminations |
(1.0) |
(1.2) |
(1.5) |
(2.0) |
(2.2) |
(2.0) |
(2.0) |
(2.0) |
(2.0) |
(2.0) |
(2.0) |
(2.0) |
(2.0) |
(2.0) |
|
Depreciation |
(18.2) |
(21.3) |
(22.5) |
(24.1) |
(25.0) |
(27.5) |
(27.6) |
(28.0) |
(28.4) |
(28.7) |
(28.9) |
(28.9) |
(28.9) |
(28.9) |
|
EBIT |
61.1 |
48.3 |
53.8 |
81.1 |
76.2 |
77.2 |
83.8 |
84.1 |
89.7 |
91.7 |
90.0 |
88.3 |
86.8 |
85.2 |
|
Finance (costs) / income |
(0.1) |
(1.3) |
2.6 |
0.9 |
1.3 |
(2.0) |
(2.3) |
(2.8) |
(2.9) |
(0.9) |
(0.3) |
0.2 |
0.7 |
1.2 |
|
One-offs (non-cash): operational |
(35.7) |
(14.0) |
(18.7) |
(26.8) |
(28.0) |
(28.0) |
(26.5) |
(25.0) |
(20.0) |
(15.0) |
(11.3) |
(7.5) |
(3.8) |
0.0 |
|
One-offs (non-cash): financial |
(0.2) |
(1.8) |
0.0 |
0.0 |
(13.9) |
(11.0) |
(5.5) |
0.0 |
0.0 |
0.0 |
0.0 |
0.0 |
0.0 |
0.0 |
|
EBT |
25.2 |
31.2 |
37.7 |
55.1 |
35.5 |
36.2 |
49.6 |
56.2 |
66.9 |
75.9 |
78.5 |
81.1 |
83.8 |
86.4 |
|
Income tax |
(4.2) |
(6.2) |
(10.5) |
(15.4) |
(13.1) |
(9.9) |
(11.6) |
(11.8) |
(14.0) |
(15.9) |
(16.5) |
(17.0) |
(17.6) |
(18.1) |
|
Net profit (before minorities) |
21.0 |
24.1 |
27.2 |
39.8 |
22.5 |
37.3 |
43.5 |
44.4 |
52.8 |
59.9 |
62.0 |
64.1 |
66.2 |
68.2 |
|
Minority |
(1.2) |
1.5 |
4.4 |
0.5 |
1.6 |
(1.9) |
(2.1) |
(2.0) |
(2.2) |
(2.4) |
(2.3) |
(2.2) |
(2.2) |
(2.0) |
|
|
|
|
|
|
|
|
|
|
|
|
|
|
|
|
|
Net profit (reported) |
19.8 |
25.6 |
31.5 |
40.2 |
24.0 |
35.4 |
41.4 |
42.4 |
50.6 |
57.5 |
59.7 |
61.8 |
64.0 |
66.2 |
|
Net profit (adj.) |
50.2 |
36.2 |
44.9 |
70.0 |
61.5 |
59.4 |
64.4 |
64.2 |
68.6 |
71.8 |
70.9 |
70.0 |
69.1 |
68.2 |
|
|
|
|
|
|
|
|
|
|
|
|
|
|
|
|
|
Leverage, RUB bln |
|
|
|
|
|
|
|
|
|
|
|
|
|
|
TV'2027 |
Net (Debt) / Cash (year end) |
(117.3) |
(142.6) |
(149.4) |
(132.4) |
(99.4) |
(87.4) |
(89.4) |
(76.0) |
(44.5) |
(14.3) |
12.2 |
37.0 |
60.1 |
81.4 |
(228.1) |
Net Debt or (Cash) / EBITDA (year end) |
1.5 |
2.0 |
2.0 |
1.3 |
1.0 |
0.8 |
0.8 |
0.7 |
0.4 |
0.1 |
(0.1) |
(0.3) |
(0.5) |
(0.7) |
2.0 |
Net Debt or (Cash) incl. VTB forward / EBITDA |
1.9 |
2.5 |
2.3 |
1.5 |
1.3 |
1.1 |
1.1 |
0.9 |
0.6 |
0.4 |
0.1 |
(0.1) |
(0.3) |
(0.5) |
|
Multiples |
|
|
|
|
|
|
|
|
|
|
|
|
|
|
|
FCF Yield |
3% |
-10% |
-10% |
7% |
4% |
-6% |
7% |
15% |
23% |
24% |
24% |
24% |
23% |
23% |
|
DY |
2% |
3% |
6% |
9% |
5% |
8% |
9% |
9% |
11% |
12% |
13% |
13% |
14% |
14% |
|
EV/EBITDA (incl. VTB forward) |
1.8 |
1.9 |
5.3 |
3.8 |
3.7 |
3.4 |
3.1 |
3.1 |
2.7 |
2.4 |
2.2 |
2.0 |
1.8 |
1.7 |
|
PE (adj) |
4.6 |
6.4 |
5.2 |
3.3 |
3.8 |
3.9 |
3.6 |
3.6 |
3.4 |
3.2 |
3.3 |
3.3 |
3.3 |
3.4 |
|
Dividend, RUB/s |
|
|
|
|
|
|
|
|
|
|
|
|
|
|
TV'2027 |
DPS: regular |
0.012 |
0.01 |
0.03 |
0.05 |
0.03 |
0.04 |
0.05 |
0.05 |
0.06 |
0.07 |
0.07 |
0.07 |
0.07 |
0.08 |
0.61 |
DPS: special (leverage optimization) |
|
|
|
|
|
|
|
|
|
|
|
|
|
|
0.68 |
DPS: special (non-core assets sale) |
|
|
|
|
|
|
|
|
|
|
|
|
|
|
0.00 |
DPS: total |
0.01 |
0.01 |
0.03 |
0.05 |
0.03 |
0.04 |
0.05 |
0.05 |
0.06 |
0.07 |
0.07 |
0.07 |
0.07 |
0.08 |
1.29 |
Dividend / Net profit |
26% |
24% |
48% |
49% |
48% |
50% |
50% |
50% |
50% |
50% |
50% |
50% |
50% |
50% |
|
Dividend / FCF |
69% |
neg |
neg |
122% |
118% |
neg |
131% |
62% |
48% |
51% |
54% |
56% |
59% |
62% |
|
Cash flow, RUB bln |
|
|
|
|
|
|
|
|
|
|
|
|
|
|
TV'2027 |
EBITDA |
79.3 |
69.6 |
76.3 |
105.2 |
101.2 |
104.7 |
111.4 |
112.1 |
118.2 |
120.5 |
118.9 |
117.2 |
115.6 |
114.0 |
|
Tax |
(4.2) |
(6.2) |
(10.5) |
(15.4) |
(13.1) |
(9.9) |
(11.6) |
(11.8) |
(14.0) |
(15.9) |
(16.5) |
(17.0) |
(17.6) |
(18.1) |
|
Working capital (change) |
0.0 |
(1.2) |
0.0 |
0.0 |
(7.8) |
0.0 |
(0.4) |
(0.4) |
(0.2) |
(0.1) |
(0.0) |
(0.0) |
(0.0) |
(0.0) |
|
Capex |
(61.6) |
(78.6) |
(79.2) |
(61.0) |
(71.7) |
(104.8) |
(79.5) |
(61.5) |
(47.6) |
(47.0) |
(46.5) |
(46.0) |
(45.5) |
(45.0) |
|
FCF (to EV) |
13.4 |
(16.4) |
(13.5) |
28.9 |
8.7 |
(10.0) |
20.0 |
38.4 |
56.3 |
57.5 |
55.9 |
54.1 |
52.5 |
50.9 |
444.9 |
Interest CF |
(6.0) |
(6.8) |
(10.5) |
(12.7) |
0.9 |
(5.0) |
(4.3) |
(4.2) |
(3.5) |
(2.0) |
(0.6) |
0.5 |
1.5 |
2.4 |
|
FCF (to Equity) |
7.4 |
(23.3) |
(24.0) |
16.2 |
9.6 |
(15.0) |
15.7 |
34.1 |
52.8 |
55.5 |
55.3 |
54.6 |
54.0 |
53.3 |
|
Discounting parameters |
|
|
|
|
|
|
|
|
|
|
|
|
|
|
TV'2027 |
Period for discounting, years |
DCF |
|
|
|
|
(1.4) |
(0.4) |
0.6 |
1.6 |
2.6 |
3.6 |
4.6 |
5.6 |
6.6 |
7.6 |
|
DDM |
|
|
|
|
(0.4) |
0.6 |
1.6 |
2.6 |
3.6 |
4.6 |
5.6 |
6.6 |
7.6 |
8.6 |
Discounting factor |
DCF |
|
|
|
|
|
1.03 |
0.93 |
0.82 |
0.72 |
0.64 |
0.56 |
0.49 |
0.44 |
0.38 |
|
DDM |
|
|
|
|
1.03 |
0.92 |
0.79 |
0.68 |
0.59 |
0.51 |
0.44 |
0.38 |
0.33 |
0.28 |
DCF, RUB bln |
|
|
|
|
|
|
|
|
|
|
|
|
|
|
|
DCF |
|
|
|
|
|
|
20.5 |
35.6 |
46.0 |
41.4 |
35.5 |
30.3 |
25.9 |
22.1 |
170.7 |
|
|
|
|
|
|
|
|
|
|
|
|
|
|
|
|
PT (DCF), RUB/s |
|
|
PT (w-average, rounded), RUB/s |
|
|
|
|
|
Valuation parameters |
DDM |
DCF |
Other |
|||
Fair EV of core assets, RUB bln |
428 |
|
PT |
|
RUB/s |
Weight |
|
Comment |
|
|
CoE |
|
15.8% |
|
|
Non-core assets |
1 |
|
DDM |
|
0.68 |
70% |
|
|
|
|
WACC |
|
|
13.4% |
|
Forward contract with VTB |
(30) |
|
DCF |
|
0.72 |
30% |
|
|
|
|
TG (Dividends) |
|
3.5% |
|
|
Net (debt) / Cash (discounted), end 2018 |
(87) |
|
Result (rounded) |
0.70 |
100% |
|
|
|
|
TG (FCF) |
|
|
2.0% |
0.0% |
|
Equity, RUB bln |
312 |
|
|
|
|
|
|
|
|
|
|
|
|
|
|
# of shares: current (bln) |
426 |
|
|
|
|
|
|
|
|
|
|
|
|
|
|
# of shares: new (bln) |
13 |
|
|
|
|
|
|
|
|
|
|
|
|
|
|
# of shares: (quasi)-treasury (bln) |
(4) |
|
|
|
|
|
|
|
|
|
|
|
|
|
|
# of shares: effective, total |
436 |
|
|
|
|
|
|
|
|
|
|
|
|
|
|
PT (DCF), RUB |
0.72 |
|
|
|
|
|
|
|
|
|
|
|
|
|
|
Source: company data, Gazprombank estimates
33
vk.com/id446425943
NOVEMBER 23, 2018 |
RUSSIA > EQUITY RESEARCH > UTILITIES |
|
|
INITIATION OF COVERAGE
Inter RAO
RU
SSI
Strong FCFY and balance sheet should eventually translate into solid dividends
Inter RAO’s strong FCFY and balance sheet alongside a partly streamlined ownership structure (after the buyback of RusHydro's stake and partial buyback of FSK's stake) should eventually lead to an increased dividend payout and solid DY.
Operations
Russia’s largest thermal generator (electrical capacity ~33.5 GW) with exposure to other sectors (electricity retail in Russia, electricity export, utilities outside Russia).
Positives
Capacity additions under CSA completed in 2018.
FCFY-to-CoE premium from 2017 until 2026.
Strong balance sheet with major net cash position.
Partial streamlining of ownership structure (via the buyback of RusHydro’s stake and partial buyback of FSK’s stake) should additionally stimulate an increased dividend payout, as the majority of dividends would remain within the Inter RAO/RNG perimiter.
Negatives
Modest historical dividend payout (25% of IFRS net income) implied modest historical DY.
Unclear timing of potential increase in dividend payout.
Risks of additional capex (on top of “modernization” program) M&A
Hypothetical deviation of strategic priorities of principal shareholder (RNG, ~28%) from those of minority owners.
Valuation (2018-2026)
FCFY-to-CoE premium: 2018-26.
Note: Share prices as of closure 20-Nov-2018
TICKER |
IRAO RX |
Currency |
RUB |
|
|
Target price |
5.40 |
Upside |
42% |
|
|
Recommendation |
Overweight |
MCap, bln |
397 |
|
|
Share price |
3.8 |
52-week high |
4.4 |
|
|
52-week low |
3.2 |
|
|
Source: Bloomberg, Gazprombank estimates
|
SHAREHOLDERS |
|
|
|
|
|
|
|
|
||
|
|
Rosneftegaz (RNG) |
27.6% |
|
|
|
|
|
|
|
|
|
|
Inter RAO Capital |
|
29.4% |
|
|
|
Federal Grid |
9.2% |
|
|
|
|
Company |
|
||
|
|
|
|
||
|
|
Free-float |
|
33.7% |
|
|
|
|
|
|
|
Source: company data
12M PRICE PERFORMANCE
140% |
|
|
|
|
|
120% |
|
|
|
|
|
100% |
|
|
|
|
|
80% |
|
|
|
|
|
60% |
|
MOEX INDEX |
|
||
|
IRAO |
|
|
|
|
|
|
|
|
|
|
40% |
Jan-18 |
Mar-18 |
May-18 |
Jul-18 |
|
Nov-17 |
Sep-18 |
||||
Source: Bloomberg
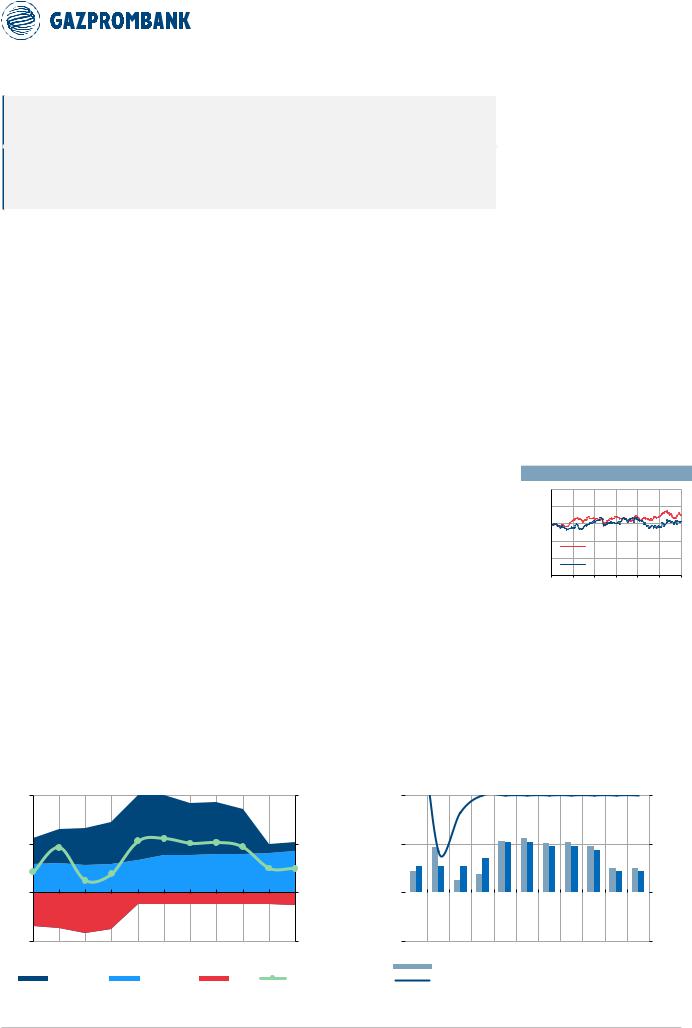
Chart 45. Inter RAO: FCF profile |
Chart 46. Inter RAO: FCFY and DY vs. IFRS net profile |
EBITDA (lhs), capex (lhs), FCFY (rhs) – for Inter RAO Power Generation |
FCFY (lhs), DY (lhs) and dividend payout (rhs) |
150 |
EBITDA, Capex |
|
|
|
|
|
FCFY |
30% |
|
30% |
|
|
|
|
|
|
|
|
|
|
|
100% |
||
|
|
|
|
|
|
|
|
FCFY and DY |
|
|
|
|
|
|
Dividend |
|||||||||
|
|
|
|
|
|
|
INT'L AND |
|
|
|
|
|
|
|
|
|||||||||
125 |
RUB bln |
|
|
|
|
|
|
(line) |
|
|
|
|
|
|
|
|
|
|||||||
|
|
|
|
|
|
|
|
(columns) |
|
|
|
|
|
|
|
payout (line) |
|
|||||||
|
|
|
|
|
|
|
ELIMNATIONS |
|
|
|
|
|
|
|
|
|
||||||||
|
|
|
|
|
|
|
|
|
|
|
|
|
|
|
|
|
|
|
|
|||||
|
|
|
|
|
|
|
|
|
|
|
|
|
|
|
|
|
|
|
|
|
|
|
|
|
100 |
|
|
|
|
|
|
|
|
|
|
RUSSIA |
|
|
|
|
|
|
|
|
|
|
|
|
|
75 |
|
|
|
|
|
|
|
|
|
15% |
RETAIL |
15% |
|
|
|
|
|
|
|
|
|
|
|
50% |
|
|
|
|
|
|
|
|
|
CO- |
|
|
|
|
|
|
|
|
|
|
|
||||
|
|
|
|
|
|
|
|
|
|
|
|
|
|
|
|
|
|
|
|
|
|
|
|
|
50 |
|
|
|
|
|
|
|
|
|
|
GENERATION |
|
|
|
|
|
|
|
|
|
|
|
|
|
25 |
|
|
|
|
|
|
|
|
|
|
INTERRAO- |
|
|
|
|
|
|
|
|
|
|
|
|
|
|
|
|
|
|
|
|
|
|
|
EG: NEW |
|
|
|
|
|
|
|
|
|
|
|
|
|
|
|
|
|
|
|
|
|
|
|
|
|
|
|
|
|
|
|
|
|
|
|
|
|
|
|
0 |
|
|
|
|
|
|
|
|
|
0% |
INTERRAO- |
0% |
2016 |
2017 |
2018E |
2019E |
2020E |
2021E |
2022E |
2023E |
2024E |
2025E |
2026E |
0% |
-25 |
|
|
|
|
|
|
|
|
|
|
EG: OLD |
|
|
|||||||||||
|
|
|
|
|
|
|
|
|
|
|
|
|
|
|
|
|
|
|
|
|
|
|
||
|
|
|
|
|
|
|
|
|
|
CAPEX |
|
|
|
|
|
|
|
|
|
|
|
|
|
|
|
|
|
|
|
|
|
|
|
|
|
|
|
|
|
|
|
|
|
|
|
|
|
|
|
-50 |
|
|
|
|
|
|
|
|
|
|
|
|
|
|
|
|
|
|
|
|
|
|
|
|
-75 |
2016 2017 2018E |
2019E |
2020E |
2021E |
2022E |
2023E |
2024E |
2025E |
2026E |
-15% |
FCFY |
-15% |
|
|
|
|
|
|
|
|
|
|
|
-50% |
|
|
DIVIDEND PAYOUT (RHS) |
|
|
|
|
|
|||||||||||||||||
|
|
|
|
|
|
|
|
|
|
|
||||||||||||||
|
|
|
|
|
|
|
|
|
|
|
|
|
|
FCF YIELD (LHS) |
|
|
|
|
DIVIDEND YIELD (LHS) |
|||||
Source: company data, Gazprombank estimates |
Source: company data, Gazprombank estimates |
34

vk.com/id446425943
NOVEMBER 23, 2018 RUSSIA > EQUITY RESEARCH > UTILITIES
Table 6. Inter RAO forecast (IFRS-based) and valuation, RUB bln or RUB per share
P&L |
2013 |
2014 |
2015 |
2016 |
2017 |
2018E |
2019E |
2020E |
2021E |
2022E |
2023E |
2024E |
2025E |
2026E |
|
InterRAO-EG |
138.6 |
147.6 |
149.1 |
156.6 |
165.7 |
174.7 |
174.7 |
180.1 |
188.1 |
193.3 |
192.8 |
183.0 |
170.7 |
173.4 |
|
Co-generation |
67.8 |
76.6 |
79.3 |
83.6 |
84.9 |
89.0 |
88.0 |
87.0 |
86.0 |
85.0 |
83.8 |
82.5 |
81.3 |
80.0 |
|
Russia retail |
404.3 |
450.9 |
511.1 |
564.0 |
628.6 |
657.0 |
662.7 |
668.5 |
674.2 |
680.0 |
685.0 |
690.0 |
695.0 |
700.0 |
|
Trading |
47.8 |
56.7 |
80.5 |
81.0 |
58.6 |
71.1 |
70.9 |
70.6 |
70.3 |
70.0 |
68.8 |
67.5 |
66.3 |
65.0 |
|
Int'l assets |
34.7 |
43.2 |
52.9 |
32.1 |
26.8 |
26.6 |
28.7 |
30.8 |
32.9 |
35.0 |
36.3 |
37.5 |
38.8 |
40.0 |
|
Other & Eliminations |
(31.3) |
(33.9) |
(40.9) |
(49.1) |
(47.6) |
(36.5) |
(39.6) |
(42.8) |
(46.0) |
(49.1) |
(49.1) |
(49.1) |
(49.1) |
(49.1) |
|
Revenue |
662.0 |
741.1 |
832.0 |
868.2 |
917.0 |
981.9 |
985.3 |
994.1 |
1,005.5 |
1,014.2 |
1,017.4 |
1,011.4 |
1,002.9 |
1,009.3 |
|
InterRAO-EG |
23.7 |
29.1 |
36.1 |
53.6 |
56.7 |
60.8 |
60.8 |
66.3 |
72.3 |
74.7 |
71.4 |
58.9 |
44.1 |
44.5 |
|
Co-generation |
6.9 |
10.5 |
9.7 |
13.7 |
13.5 |
16.2 |
15.4 |
14.6 |
13.8 |
13.0 |
12.5 |
12.0 |
11.5 |
11.0 |
|
Russia retail |
7.1 |
9.4 |
13.9 |
15.1 |
17.8 |
21.8 |
20.3 |
18.9 |
17.4 |
16.0 |
15.8 |
15.5 |
15.3 |
15.0 |
|
Trading |
2.9 |
4.6 |
9.6 |
10.2 |
7.4 |
9.7 |
8.8 |
7.8 |
6.9 |
6.0 |
5.9 |
5.8 |
5.6 |
5.5 |
|
Int'l assets |
5.0 |
6.4 |
7.3 |
10.8 |
6.1 |
7.9 |
7.4 |
7.0 |
6.5 |
6.0 |
6.1 |
6.3 |
6.4 |
6.5 |
|
Other & Eliminations |
(6.0) |
(4.5) |
(4.3) |
(10.6) |
(7.3) |
(3.1) |
(3.6) |
(4.1) |
(4.5) |
(5.0) |
(5.1) |
(5.3) |
(5.4) |
(5.5) |
|
EBITDA |
39.7 |
55.4 |
72.3 |
92.8 |
94.2 |
113.2 |
109.1 |
110.5 |
112.4 |
110.7 |
106.5 |
93.1 |
77.5 |
77.0 |
|
InterRAO-EG |
(13.3) |
(10.5) |
(11.7) |
(11.7) |
(11.0) |
(13.5) |
(13.5) |
(13.5) |
(13.5) |
(13.5) |
(13.5) |
(13.5) |
(13.5) |
(13.5) |
|
Co-generation |
(6.1) |
(6.1) |
(5.1) |
(5.1) |
(5.1) |
(5.8) |
(5.8) |
(5.9) |
(5.9) |
(6.0) |
(6.0) |
(6.0) |
(6.0) |
(6.0) |
|
Russia retail |
(1.2) |
(1.3) |
(2.2) |
(2.2) |
(1.7) |
(2.4) |
(2.4) |
(2.4) |
(2.5) |
(2.5) |
(2.5) |
(2.5) |
(2.5) |
(2.5) |
|
Trading |
(0.1) |
(0.1) |
(0.1) |
(0.2) |
(0.2) |
(0.1) |
(0.1) |
(0.1) |
(0.1) |
(0.1) |
(0.1) |
(0.1) |
(0.1) |
(0.1) |
|
Int'l assets |
(2.2) |
(2.1) |
(3.1) |
(2.6) |
(2.0) |
(3.8) |
(3.6) |
(3.4) |
(3.2) |
(3.0) |
(3.0) |
(3.0) |
(3.0) |
(3.0) |
|
Other & Eliminations |
(0.9) |
(1.1) |
(1.4) |
(1.1) |
(1.1) |
(1.1) |
(1.1) |
(1.1) |
(1.1) |
(1.1) |
(1.1) |
(1.1) |
(1.1) |
(1.1) |
|
Depreciation |
(23.7) |
(21.2) |
(23.6) |
(22.9) |
(21.0) |
(26.6) |
(26.5) |
(26.4) |
(26.3) |
(26.2) |
(26.2) |
(26.2) |
(26.2) |
(26.2) |
|
EBIT |
15.9 |
34.2 |
48.7 |
69.9 |
73.2 |
86.6 |
82.6 |
84.0 |
86.1 |
84.5 |
80.3 |
66.9 |
51.3 |
50.8 |
|
Finance (costs) / income |
(1.5) |
(4.7) |
(3.2) |
(0.8) |
6.2 |
5.9 |
5.5 |
7.4 |
8.6 |
9.1 |
8.9 |
8.0 |
6.5 |
4.6 |
|
One-offs (non-cash): operational |
(31.1) |
(9.9) |
(23.4) |
(0.6) |
(14.4) |
(5.0) |
(4.5) |
(4.0) |
(3.5) |
(3.0) |
(2.3) |
(1.5) |
(0.8) |
0.0 |
|
One-offs (non-cash): financial |
(10.4) |
(2.6) |
2.1 |
(3.6) |
(1.0) |
0.0 |
0.0 |
0.0 |
0.0 |
0.0 |
0.0 |
0.0 |
0.0 |
0.0 |
|
EBT |
(27.1) |
17.0 |
24.2 |
64.9 |
64.0 |
87.5 |
83.6 |
87.4 |
91.1 |
90.6 |
86.9 |
73.4 |
57.0 |
55.4 |
|
Income tax |
3.1 |
(7.2) |
(0.4) |
(3.6) |
(9.5) |
(18.4) |
(17.5) |
(18.4) |
(19.1) |
(19.0) |
(18.3) |
(15.4) |
(12.0) |
(11.6) |
|
Net profit (pre-minorities) |
(24.0) |
9.8 |
23.8 |
61.3 |
54.4 |
69.1 |
66.0 |
69.1 |
72.0 |
71.6 |
68.7 |
58.0 |
45.1 |
43.7 |
|
Minority |
1.0 |
(1.9) |
(1.2) |
(0.6) |
(0.6) |
(0.7) |
(0.7) |
(0.7) |
(0.7) |
(0.7) |
(0.7) |
(0.6) |
(0.5) |
(0.4) |
|
Net profit (reported) |
(23.1) |
7.8 |
22.6 |
60.8 |
53.9 |
68.4 |
65.4 |
68.4 |
71.3 |
70.9 |
68.0 |
57.4 |
44.6 |
43.3 |
|
Net profit (adj.) |
14.0 |
26.7 |
35.8 |
58.9 |
64.8 |
73.1 |
69.6 |
72.2 |
74.8 |
73.9 |
70.4 |
59.2 |
45.7 |
43.7 |
|
|
|
|
|
|
|
|
|
|
|
|
|
|
|
|
|
Net Debt (RUB bln) |
|
|
|
|
|
|
|
|
|
|
|
|
|
|
TV'2027 |
Net (Debt) / Cash, year end, RUB bln |
(12.8) |
(31.5) |
(11.9) |
78.4 |
97.0 |
122.0 |
184.5 |
244.9 |
302.4 |
354.1 |
399.0 |
433.7 |
459.5 |
489.2 |
(150.1) |
Net Debt or (Cash) / EBITDA (year end) |
0.3 |
0.6 |
0.2 |
(0.8) |
(1.0) |
(1.1) |
(1.7) |
(2.2) |
(2.7) |
(3.2) |
(3.7) |
(4.7) |
(5.9) |
(6.4) |
2.0 |
Multiples |
|
|
|
|
|
|
|
|
|
|
|
|
|
|
|
FCF Yield |
-2% |
-1% |
13% |
15% |
11% |
25% |
28% |
29% |
30% |
30% |
28% |
24% |
19% |
18% |
|
Dividend yield |
0.0% |
0.0% |
0.5% |
3.9% |
3.4% |
4.3% |
5.1% |
6.5% |
7.8% |
8.9% |
8.6% |
7.2% |
5.6% |
5.4% |
|
EV/EBITDA (adj) |
7.4 |
5.4 |
4.2 |
2.8 |
2.3 |
1.8 |
1.6 |
1.2 |
0.9 |
0.5 |
0.3 |
0.0 |
(0.3) |
(0.5) |
|
PE (adj) |
20.0 |
10.5 |
7.8 |
4.7 |
4.3 |
3.8 |
4.0 |
3.9 |
3.7 |
3.8 |
4.0 |
4.7 |
6.1 |
6.4 |
|
Dividend |
|
|
|
|
|
|
|
|
|
|
|
|
|
|
|
DPS: regular |
|
0.00 |
0.02 |
0.15 |
0.13 |
0.16 |
0.20 |
0.25 |
0.30 |
0.34 |
0.33 |
0.27 |
0.21 |
0.21 |
1.45 |
DPS: special (leverage optimization) |
|
|
|
|
|
|
|
|
|
|
|
|
|
|
8.61 |
DPS: special (sale non-core assets) |
|
|
|
|
|
|
|
|
|
|
|
|
|
|
- |
DPS, RUB/s: total |
|
|
0.02 |
0.15 |
0.13 |
0.16 |
0.20 |
0.25 |
0.30 |
0.34 |
0.33 |
0.27 |
0.21 |
0.21 |
10.06 |
Dividend / Net profit |
0% |
1% |
8% |
25% |
25% |
25% |
31% |
38% |
44% |
50% |
50% |
50% |
50% |
50% |
|
Dividend / FCF |
neg |
neg |
4% |
26% |
30% |
17% |
18% |
23% |
27% |
30% |
30% |
30% |
30% |
31% |
|
Cash flow, RUB bln |
|
|
|
|
|
|
|
|
|
|
|
|
|
|
|
EBITDA |
39.7 |
55.4 |
72.3 |
92.8 |
94.2 |
113.2 |
109.1 |
110.5 |
112.4 |
110.7 |
106.5 |
93.1 |
77.5 |
77.0 |
|
Tax |
- |
(7.2) |
(0.4) |
(3.6) |
(9.5) |
(18.4) |
(17.5) |
(18.4) |
(19.1) |
(19.0) |
(18.3) |
(15.4) |
(12.0) |
(11.6) |
|
Working capital change |
0.0 |
(15.2) |
(4.4) |
(8.6) |
(23.9) |
(2.7) |
0.0 |
0.0 |
0.0 |
0.0 |
0.0 |
0.0 |
0.0 |
0.0 |
|
Capex |
(41.0) |
(36.0) |
(28.8) |
(34.7) |
(31.5) |
(25.0) |
(17.0) |
(17.3) |
(17.7) |
(18.0) |
(18.5) |
(19.0) |
(19.5) |
(20.0) |
|
FCF (to EV) |
(1.3) |
(3.0) |
38.8 |
45.8 |
29.3 |
67.2 |
74.6 |
74.8 |
75.6 |
73.7 |
69.7 |
58.7 |
46.0 |
45.3 |
396.7 |
Interest (CF) |
(3.1) |
(1.2) |
(3.8) |
(3.7) |
2.1 |
2.4 |
3.2 |
5.1 |
7.0 |
9.1 |
8.9 |
8.0 |
6.5 |
4.6 |
- |
FCF ( to Equity) |
(4.4) |
(4.2) |
35.0 |
42.1 |
31.4 |
69.6 |
77.8 |
79.8 |
82.6 |
82.8 |
78.6 |
66.7 |
52.5 |
49.9 |
|
Discounting parameters |
|
|
|
|
|
|
|
|
|
|
|
|
|
|
TV'2020 |
Period for discounting, years |
DCF |
|
|
|
|
(1.4) |
(0.4) |
0.6 |
1.6 |
2.6 |
3.6 |
4.6 |
5.6 |
6.6 |
7.6 |
|
DDM |
|
|
|
|
(0.4) |
0.6 |
1.6 |
2.6 |
3.6 |
4.6 |
5.6 |
6.6 |
7.6 |
8.6 |
Discounting factor |
DCF |
|
|
|
|
|
1.03 |
0.93 |
0.82 |
0.72 |
0.63 |
0.56 |
0.49 |
0.43 |
0.38 |
|
DDM |
|
|
|
|
1.03 |
0.91 |
0.79 |
0.68 |
0.59 |
0.51 |
0.44 |
0.38 |
0.33 |
0.28 |
DCF, RUB bln |
|
|
|
|
|
|
|
|
|
|
|
|
|
|
TV'2020 |
DCF: total |
|
|
|
|
|
|
76.5 |
69.3 |
61.7 |
53.0 |
44.3 |
32.8 |
22.7 |
19.7 |
152.1 |
|
|
|
|
|
|
|
|
|
|
|
|
|
|
||
TP (DCF), RUB/s |
|
|
|
TP (w-average, rounded), RUB/s |
|
|
Valuation parameters |
DDM |
DCF |
Other |
|
|
|||
Fair EV of core assets, RUB bln |
|
532 |
|
TP |
|
RUB/s |
Weight |
|
CoE |
|
15.8% |
|
|
|
|
Non-core assets |
|
- |
|
DDM |
|
4.2 |
70% |
|
WACC |
|
|
13.4% |
|
|
|
Net (debt) / Cash (discounted), end 2018 |
|
82 |
|
DCF |
|
8.4 |
30% |
|
TG (Dividends) |
1.5% |
|
|
|
|
|
Equity, RUB bln |
|
614 |
|
Result (rounded) |
|
5.4 |
100% |
|
TG (FCF) |
|
|
2.0% |
0.0% |
|
|
# of shares: current |
|
104 |
|
|
|
|
|
|
|
|
|
|
|
|
|
# of shares: new |
|
- |
|
|
|
|
|
|
|
|
|
|
|
|
|
# of shares: (quasi)-treasury |
|
(31) |
|
|
|
|
|
|
|
|
|
|
|
|
|
# of shares: effective, total |
|
73 |
|
|
|
|
|
|
|
|
|
|
|
|
|
TP (DCF), RUB/s |
|
8.4 |
|
|
|
|
|
|
|
|
|
|
|
|
|
Source: company data, Gazprombank estimates
35
vk.com/id446425943
NOVEMBER 23, 2018 |
RUSSIA > EQUITY RESEARCH > UTILITIES |
|
|
INITIATION OF COVERAGE
Unipro
RU
SSI
FCFY-to-CoE premium to start in 2020, but should not last beyond 2024 due to expiration of CSAs
The planned re-launch of a new unit at Beryozov TPP (2H19) should trigger a hike in FCFY and DY in 2020, which, however, should run off after 2024 with the expiration of CSAs for Beryozov (2024) and other new units (2020-21).
Operations
One of Russia’s most efficient inter-regional thermal gencos (electrical capacity ~11.2 GW) currently focused on recovery of the damaged new unit at Beryozov TPP (0.8 GW), which is planned to be re-started in 2H19.
Positives
Approaching FCFY-to-CoE premium (2020) on the back of the planned re-launch of the new unit at Beryozov TPP (0.8 GW, 2H19).
Potentially strong dividend payout (>80% of FCF) after the re-launch of the new unit at Beryozov TPP. Specific dividend approach is to be revealed in 2019.
Solid dividends even prior to the re-launch of new unit at Beryozov TPP (annual DPS during 2018-2019 = RUB 0.22 per share p.a., with DY=~8%).
Limited corporate governance risks due to control by a Uniper.
Negatives
Limited period of FCFY-to-CoE premium (2020-21) due to expiration of CSAs for new units at Shatura TPP (Sep. 2020), Yaiva TPP (Dec. 2020), Surgut TPP-2-7 (July 2021), Surgut TPP-2-8 (Aug. 2021) and Beryozov TPP (Oct. 2024).
Risks of delays or cost over-runs in the re-launch of new unit at Beryozov TPP.
Ambitious short-term valuations: EV/EBITDA'18 > 6.0x.
Valuation (2018-2026)
Note: Share prices as of closure 20-Nov-2018
TICKER |
UPRO RX |
Currency |
RUB |
|
|
Target price |
2.90 |
Upside |
5% |
|
|
Recommendation |
Neutral |
MCap, bln |
173 |
|
|
Share price |
2.8 |
52-week high |
2.9 |
|
|
52-week low |
2.5 |
|
|
Source: Bloomberg, Gazprombank estimates
|
SHAREHOLDERS |
|
|
|
|
|
|
|
Uniper |
83.7% |
|
|
|
|
|
|
Free-float |
|
16.3% |
|
|
|
|
Source: company data
12M PRICE PERFORMANCE
140% |
|
|
|
|
|
120% |
|
|
|
|
|
100% |
|
|
|
|
|
80% |
|
MOEX INDEX |
|
|
|
|
|
|
|
||
60% |
|
UPRO |
|
|
|
|
|
|
|
|
|
40% |
Jan-18 |
Mar-18 |
May-18 |
Jul-18 |
|
Nov-17 |
Sep-18 |
||||
Source: Bloomberg
FCFY-to-CoE premium: 2020-23. FCFY to decline in 2022 driven by the start of CSA expirations.
DY-to-CoD premium: 2019-24.
Chart 47. Unipro: FCF profile |
Chart 48. Unipro: FCFY and DY profile |
EBITDA (lhs), capex (lhs), FCFY (rhs) |
FCFY (lhs), DY (lhs) and dividend payout vs IFRS net profit (rhs) |
40 |
EBITDA, Capex |
|
|
|
|
|
|
|
30% |
30% |
|
|
|
|
|
|
|
|
FCFY |
|
|||
|
RUB bln |
|
|
|
|
|
|
|
|
(line) |
|
20 |
|
|
|
|
|
|
|
|
|
15% |
15% |
0 |
|
|
|
|
|
|
|
|
|
0% |
0% |
-20 |
|
|
|
|
|
|
|
|
|
-15% |
-15% |
2016 |
2017 |
2018E |
2019E |
2020E |
2021E |
2022E |
2023E |
2024E |
2025E |
2026E |
|
|
EBITDA ("NEW") |
EBITDA ("OLD") |
|
CAPEX |
|
FCFY |
|
||||
|
FCFY and DY |
|
|
|
|
|
|
|
Dividend |
|
100% |
|||
|
|
|
|
|
|
|
|
|
||||||
|
|
|
|
|
|
|
|
|
|
|||||
|
(columns) |
|
|
|
|
|
|
|
|
payout (line) |
|
|
||
|
|
|
|
|
|
|
|
|
|
|
|
|
|
50% |
|
|
|
|
|
|
|
|
|
|
|
|
|
|
0% |
|
2016 |
2017 |
2018E |
2019E |
2020E |
2021E |
2022E |
2023E |
2024E |
2025E |
2026E |
|
||
|
|
|
||||||||||||
|
|
|
|
|
|
|
|
|
|
|
|
|
|
-50% |
|
|
|
|
|
|
|
|
|
|
|
|
|
||
|
|
FCF YIELD (LHS) |
|
|
|
|
|
DIVIDEND YIELD (LHS) |
||||||
|
|
|
|
|
|
|
||||||||
|
|
|
|
|
|
|
||||||||
|
|
DIVIDEND PAYOUT (RHS) |
|
|
|
|
|
|
|
|
||||
Source: company data, Gazprombank estimates |
Source: company data, Gazprombank estimates |
36

vk.com/id446425943
NOVEMBER 23, 2018 RUSSIA > EQUITY RESEARCH > UTILITIES
Table 7. Unipro forecast (IFRS-based) and valuation, RUB bln or RUB per share
P&L (IFRS), RUB bln: Unipro |
2013 |
2014 |
2015 |
2016 |
2017 |
2018E |
2019E |
2020E |
2021E |
2022E |
2023E |
2024E |
2025E |
2026E |
TV'2027 |
Revenue electricity: old |
56.4 |
55.7 |
54.4 |
54.8 |
51.0 |
48.7 |
49.7 |
51.0 |
53.8 |
55.1 |
56.3 |
57.4 |
58.5 |
60.6 |
|
Revenue electicity: new |
19.2 |
18.4 |
18.0 |
19.0 |
21.9 |
23.1 |
27.1 |
39.6 |
38.3 |
35.3 |
36.2 |
33.5 |
19.3 |
19.9 |
|
Revenue electricity |
75.6 |
74.1 |
72.4 |
73.9 |
72.9 |
71.9 |
76.8 |
90.6 |
92.1 |
90.4 |
92.5 |
90.9 |
77.8 |
80.5 |
|
Heat revenue |
1.1 |
1.2 |
1.2 |
1.3 |
1.3 |
1.4 |
1.4 |
1.4 |
1.4 |
1.4 |
1.4 |
1.4 |
1.4 |
1.4 |
|
Revenue other (incl. reselling) |
2.1 |
2.4 |
3.1 |
2.9 |
2.4 |
2.1 |
1.6 |
1.2 |
0.9 |
0.7 |
0.6 |
0.5 |
0.4 |
0.3 |
|
Revenue (before subsidies) |
78.8 |
77.7 |
76.7 |
78.0 |
76.5 |
75.3 |
79.7 |
93.2 |
94.5 |
92.6 |
94.5 |
92.8 |
79.6 |
82.2 |
|
Subsidies |
0.0 |
0.0 |
0.0 |
0.0 |
0.0 |
0.0 |
0.0 |
0.0 |
0.0 |
0.0 |
0.0 |
0.0 |
0.0 |
0.0 |
|
Revenue |
78.8 |
77.7 |
76.7 |
78.0 |
76.5 |
75.3 |
79.7 |
93.2 |
94.5 |
92.6 |
94.5 |
92.8 |
79.6 |
82.2 |
|
Fuel costs electricity, old |
(31.0) |
(31.9) |
(29.9) |
(31.9) |
(28.1) |
(27.8) |
(28.3) |
(28.8) |
(29.4) |
(30.0) |
(30.6) |
(31.2) |
(31.6) |
(32.8) |
|
Fuel costs heat, old |
(0.7) |
(0.7) |
(0.7) |
(0.7) |
(0.6) |
(0.6) |
(0.6) |
(0.6) |
(0.7) |
(0.7) |
(0.7) |
(0.7) |
(0.7) |
(0.7) |
|
Fuel costs, new |
(4.8) |
(5.0) |
(4.9) |
(5.4) |
(4.9) |
(5.0) |
(5.8) |
(7.1) |
(7.4) |
(7.8) |
(8.1) |
(8.5) |
(8.8) |
(9.1) |
|
Fuel costs,old and new |
(36.5) |
(37.6) |
(35.5) |
(37.9) |
(33.6) |
(33.4) |
(34.8) |
(36.5) |
(37.5) |
(38.5) |
(39.4) |
(40.3) |
(41.1) |
(42.7) |
|
Purchased power & Re-selling |
(1.0) |
(1.2) |
(2.0) |
(1.9) |
(1.3) |
(1.4) |
(1.1) |
(0.9) |
(0.8) |
(0.6) |
(0.5) |
(0.4) |
(0.4) |
(0.3) |
|
Heat transportation |
0.0 |
0.0 |
0.0 |
0.0 |
0.0 |
0.0 |
0.0 |
0.0 |
0.0 |
0.0 |
0.0 |
0.0 |
0.0 |
0.0 |
|
Water payment |
0.0 |
0.0 |
0.0 |
0.0 |
0.0 |
0.0 |
0.0 |
0.0 |
0.0 |
0.0 |
0.0 |
0.0 |
0.0 |
0.0 |
|
Gross profit |
41.3 |
38.9 |
39.2 |
38.2 |
41.6 |
40.5 |
43.8 |
55.8 |
56.2 |
53.5 |
54.5 |
52.1 |
38.1 |
39.3 |
|
Non-fuel Opex: Old plants |
(9.2) |
(10.0) |
(13.7) |
(12.0) |
(11.6) |
(10.7) |
(10.6) |
(9.8) |
(10.2) |
(10.6) |
(10.9) |
(11.2) |
(11.5) |
(11.6) |
|
Non-fuel Opex: new plants |
(2.4) |
(2.5) |
(2.6) |
(2.8) |
(2.9) |
(3.1) |
(4.1) |
(5.9) |
(6.2) |
(6.4) |
(6.6) |
(6.8) |
(6.9) |
(7.4) |
|
Cost of subsidies |
0.0 |
0.0 |
0.0 |
0.0 |
0.0 |
0.0 |
0.0 |
0.0 |
0.0 |
0.0 |
0.0 |
0.0 |
0.0 |
0.0 |
|
Non-fuel Opex |
(11.6) |
(12.5) |
(16.3) |
(14.8) |
(14.5) |
(13.8) |
(14.7) |
(15.7) |
(16.4) |
(16.9) |
(17.5) |
(18.0) |
(18.4) |
(19.0) |
|
EBITDA, old plants |
16.6 |
14.3 |
11.3 |
11.5 |
12.0 |
11.0 |
11.5 |
13.2 |
15.0 |
15.2 |
15.5 |
15.8 |
16.1 |
16.9 |
|
EBITDA, new plants |
12.0 |
10.9 |
10.5 |
10.9 |
14.0 |
15.0 |
17.1 |
26.6 |
24.7 |
21.2 |
21.5 |
18.3 |
3.6 |
3.4 |
|
EBITDA, reselling / other |
1.0 |
1.1 |
1.1 |
1.0 |
1.1 |
0.7 |
0.4 |
0.3 |
0.2 |
0.1 |
0.1 |
0.1 |
0.0 |
0.0 |
|
EBITDA |
29.7 |
26.4 |
22.9 |
23.4 |
27.1 |
26.7 |
29.1 |
40.1 |
39.9 |
36.5 |
37.0 |
34.1 |
19.7 |
20.3 |
|
Depreciation: Old plants |
(8.1) |
(5.1) |
(5.6) |
(4.6) |
(3.5) |
(3.1) |
(3.1) |
(3.1) |
(3.1) |
(3.1) |
(3.1) |
(3.1) |
(3.1) |
(3.1) |
|
Depreciation: New plants |
(1.9) |
(1.9) |
(1.9) |
(2.0) |
(2.4) |
(2.9) |
(3.3) |
(3.5) |
(3.5) |
(3.5) |
(3.5) |
(3.5) |
(3.5) |
(3.5) |
|
Depreciation |
(9.9) |
(6.9) |
(7.5) |
(6.6) |
(6.0) |
(6.0) |
(6.5) |
(6.7) |
(6.7) |
(6.7) |
(6.7) |
(6.7) |
(6.7) |
(6.7) |
|
EBIT |
19.7 |
19.5 |
15.4 |
16.8 |
21.2 |
20.7 |
22.6 |
33.5 |
33.2 |
29.8 |
30.4 |
27.4 |
13.1 |
13.6 |
|
Finance (costs) / income |
2.1 |
1.9 |
0.7 |
0.4 |
0.9 |
0.3 |
0.8 |
0.5 |
1.2 |
1.4 |
1.3 |
1.4 |
1.4 |
0.6 |
|
One-offs (cash) |
0.0 |
0.0 |
2.8 |
5.7 |
20.4 |
0.0 |
0.0 |
0.0 |
0.0 |
0.0 |
0.0 |
0.0 |
0.0 |
0.0 |
|
One-offs (non-cash): operational |
(4.0) |
(0.4) |
(0.9) |
(15.2) |
(0.4) |
(0.3) |
(0.2) |
(0.1) |
(0.0) |
(0.0) |
(0.0) |
(0.0) |
(0.0) |
(0.0) |
|
One-offs (non-cash): financial |
0.0 |
0.0 |
0.0 |
0.0 |
0.0 |
0.0 |
0.0 |
0.0 |
0.0 |
0.0 |
0.0 |
0.0 |
0.0 |
0.0 |
|
EBT |
17.8 |
20.9 |
18.0 |
7.6 |
42.1 |
20.7 |
23.3 |
33.8 |
34.4 |
31.2 |
31.6 |
28.9 |
14.4 |
14.2 |
|
Income tax |
(3.4) |
(4.1) |
(4.3) |
(2.4) |
(8.5) |
(4.3) |
(4.9) |
(7.1) |
(7.2) |
(6.6) |
(6.6) |
(6.1) |
(3.0) |
(3.0) |
|
Net profit (pre-minorities) |
14.4 |
16.9 |
13.8 |
5.2 |
33.6 |
16.3 |
18.4 |
26.7 |
27.2 |
24.6 |
25.0 |
22.8 |
11.4 |
11.2 |
|
Minority |
(0.2) |
(0.0) |
0.0 |
0.0 |
0.0 |
0.0 |
0.0 |
0.0 |
0.0 |
0.0 |
0.0 |
0.0 |
0.0 |
0.0 |
|
Net profit (reported) |
14.2 |
16.8 |
13.8 |
5.2 |
33.6 |
16.3 |
18.4 |
26.7 |
27.2 |
24.6 |
25.0 |
22.8 |
11.4 |
11.2 |
|
Net profit (adj) |
17.7 |
17.2 |
12.8 |
13.5 |
17.5 |
16.6 |
18.5 |
26.8 |
27.2 |
24.7 |
25.0 |
22.8 |
11.4 |
11.2 |
|
Leverage, RUB bn |
|
|
|
|
|
|
|
|
|
|
|
|
|
|
TV'2027 |
Net (Debt) / Cash (year end) |
27 |
14 |
10 |
3 |
7 |
10 |
6 |
15 |
17 |
16 |
18 |
17 |
7 |
8 |
(41) |
Net Debt or (Cash) / EBITDA (year end) |
(0.9) |
(0.5) |
(0.4) |
(0.1) |
(0.2) |
(0.4) |
(0.2) |
(0.4) |
(0.4) |
(0.4) |
(0.5) |
(0.5) |
(0.3) |
(0.4) |
2.0 |
Multiples |
|
|
` |
|
|
|
|
|
|
|
|
|
|
|
|
FCF Yield |
7% |
3% |
6% |
7% |
14% |
4% |
6% |
16% |
17% |
15% |
15% |
14% |
8% |
7% |
|
|
|||||||||||||||
DY |
14% |
10% |
7% |
8% |
8% |
8% |
11% |
15% |
16% |
14% |
14% |
13% |
7% |
6% |
|
EV/EBITDA |
5.2 |
6.0 |
7.2 |
7.2 |
6.3 |
6.3 |
5.8 |
4.1 |
4.1 |
4.4 |
4.4 |
4.7 |
8.4 |
8.3 |
|
PE (adj) |
9.8 |
10.1 |
13.6 |
12.8 |
9.9 |
10.4 |
9.4 |
6.5 |
6.4 |
7.0 |
6.9 |
7.6 |
15.2 |
15.4 |
|
Dividend, RUB / s |
|
|
|
|
|
|
|
|
|
|
|
|
|
|
TV'2027 |
DPS: regular |
0.38 |
0.28 |
0.20 |
0.23 |
0.22 |
0.22 |
0.29 |
0.43 |
0.43 |
0.39 |
0.40 |
0.36 |
0.18 |
0.18 |
1.70 |
DPS: special (leverage optimization) |
|
|
|
|
|
|
|
|
|
|
|
|
|
|
0.77 |
DPS: special (non-core assets sale) |
|
|
|
|
|
|
|
|
|
|
|
|
|
|
- |
DPS: total |
0.38 |
0.28 |
0.20 |
0.23 |
0.22 |
0.22 |
0.29 |
0.43 |
0.43 |
0.39 |
0.40 |
0.36 |
0.18 |
0.18 |
2.47 |
Dividend / Net profit (nominal) |
168% |
104% |
90% |
277% |
42% |
86% |
101% |
100% |
100% |
100% |
100% |
100% |
100% |
100% |
|
Dividend / Net profit (adj) |
135% |
102% |
97% |
106% |
80% |
84% |
100% |
100% |
100% |
100% |
100% |
100% |
100% |
100% |
|
Dividend / FCF |
188% |
300% |
117% |
127% |
58% |
222% |
187% |
97% |
94% |
93% |
93% |
93% |
87% |
87% |
|
Cash Flow, RUB bn |
|
|
|
|
|
|
|
|
|
|
|
|
|
|
TV'2027 |
NOPAT: old plants |
6.9 |
7.5 |
4.5 |
5.4 |
6.7 |
6.2 |
6.6 |
8.0 |
9.4 |
9.5 |
9.8 |
10.0 |
10.3 |
10.9 |
|
NOPAT: new |
8.2 |
7.3 |
6.8 |
7.0 |
9.2 |
9.6 |
10.9 |
18.2 |
16.7 |
13.9 |
14.2 |
11.6 |
0.0 |
(0.1) |
|
NOPAT: reselling / other |
0.8 |
0.9 |
0.9 |
0.8 |
0.9 |
0.5 |
0.3 |
0.2 |
0.1 |
0.1 |
0.1 |
0.0 |
0.0 |
0.0 |
|
NOPAT |
16.0 |
15.7 |
12.2 |
13.2 |
16.7 |
16.4 |
17.9 |
26.4 |
26.2 |
23.6 |
24.0 |
21.7 |
10.3 |
10.8 |
|
CapEx: Maintenance |
0.0 |
0.0 |
(3.5) |
(4.1) |
(4.5) |
(4.5) |
(4.6) |
(4.6) |
(4.7) |
(4.8) |
(4.8) |
(4.9) |
(4.9) |
(5.0) |
|
CapEx: New |
(15.2) |
(17.7) |
(8.7) |
(9.6) |
(10.2) |
(12.0) |
(10.4) |
0.0 |
0.0 |
0.0 |
0.0 |
0.0 |
0.0 |
0.0 |
|
CapEx |
(15.2) |
(17.7) |
(12.2) |
(13.7) |
(14.7) |
(16.5) |
(15.0) |
(4.6) |
(4.7) |
(4.8) |
(4.8) |
(4.9) |
(4.9) |
(5.0) |
|
Working Capital Red./ (Incr.) |
0.0 |
0.0 |
0.0 |
0.0 |
0.0 |
0.0 |
(0.1) |
(1.2) |
(0.1) |
0.0 |
0.0 |
0.0 |
0.0 |
0.0 |
|
FCF; old plants |
15.0 |
12.6 |
6.7 |
6.0 |
5.7 |
4.9 |
5.1 |
5.3 |
7.7 |
7.9 |
8.1 |
8.3 |
8.5 |
9.0 |
99.7 |
FCF; new plants |
(5.1) |
(8.6) |
(0.0) |
(0.6) |
1.4 |
0.5 |
3.8 |
21.8 |
20.2 |
17.5 |
17.7 |
15.2 |
3.6 |
3.4 |
37.7 |
FCF: reselling / other |
0.8 |
0.9 |
0.9 |
0.8 |
0.9 |
0.5 |
0.3 |
0.2 |
0.1 |
0.1 |
0.1 |
0.0 |
0.0 |
0.0 |
0.2 |
FCF: cash one-offs |
0.0 |
0.0 |
2.2 |
4.5 |
16.2 |
0.0 |
0.0 |
0.0 |
0.0 |
0.0 |
0.0 |
0.0 |
0.0 |
0.0 |
|
FCF (to EV) |
10.7 |
4.9 |
9.7 |
10.7 |
24.1 |
5.9 |
9.3 |
27.3 |
28.1 |
25.5 |
25.8 |
23.5 |
12.0 |
12.4 |
137.6 |
Interest (CF) |
2.0 |
0.9 |
0.9 |
0.6 |
0.2 |
0.4 |
0.6 |
0.3 |
0.9 |
1.0 |
1.0 |
1.1 |
1.0 |
0.4 |
|
FCF (to Equity) |
12.7 |
5.8 |
10.6 |
11.3 |
24.3 |
6.3 |
9.9 |
27.7 |
29.0 |
26.5 |
26.8 |
24.5 |
13.1 |
12.8 |
|
Discounting parameters |
|
|
|
|
|
|
|
|
|
|
|
|
|
|
|
Period for discounting, years |
DCF |
|
|
|
|
(1.4) |
(0.4) |
0.6 |
1.6 |
2.6 |
3.6 |
4.6 |
5.6 |
6.6 |
0.6 |
|
DDM |
|
|
|
|
(0.4) |
0.6 |
1.6 |
2.6 |
3.6 |
4.6 |
5.6 |
6.6 |
7.6 |
1.6 |
Discounting factor |
DCF |
|
|
|
|
|
1.02 |
0.93 |
0.83 |
0.74 |
0.65 |
0.58 |
0.52 |
0.46 |
0.41 |
|
DDM |
|
|
|
|
1.03 |
0.92 |
0.80 |
0.70 |
0.61 |
0.54 |
0.47 |
0.41 |
0.36 |
0.31 |
DCF |
|
|
|
|
|
|
|
|
|
|
|
|
|
|
|
DCF: Old plants |
|
|
|
|
|
|
5.2 |
4.9 |
6.4 |
5.8 |
5.3 |
4.8 |
4.4 |
4.1 |
40.6 |
DCF: New plants |
|
|
|
|
|
|
3.9 |
20.3 |
16.7 |
12.8 |
11.6 |
8.8 |
1.8 |
1.6 |
15.4 |
DCF: Reselling / other |
|
|
|
|
|
|
0.4 |
0.2 |
0.1 |
0.1 |
0.0 |
0.0 |
0.0 |
0.0 |
0.1 |
DCF: total |
|
|
|
|
|
|
9.5 |
25.4 |
23.2 |
18.7 |
16.9 |
13.6 |
6.2 |
5.7 |
56.1 |
|
|
|
|
|
|
|
|
|
|
|
|
|
|
|
|
TP (DCF), RUB bln or RUB/s |
|
|
TP (w-average, rounded), RUB/s |
|
|
|
|
Valuation parameters |
|
DDM |
DCF |
Other |
|||
EV, RUB bln |
175 |
|
TP |
|
RUB/s |
Weight |
|
|
|
CoE |
|
|
14.5% |
|
|
Non-core assets |
- |
|
DDM |
|
2.70 |
40% |
|
DDM is a floor for PT |
WACC |
|
|
|
12.5% |
|
|
Net (debt) / Cash (discounted), end 2018 |
7 |
|
DCF |
|
2.90 |
60% |
|
|
|
TG (Dividends) |
|
|
4.0% |
|
|
Equity, RUB bln |
182 |
|
Result (rounded) |
|
2.90 |
100% |
|
|
|
TG (FCF): "old" assets |
|
|
3.5% |
0.0% |
|
# of shares: current |
63 |
|
|
|
|
|
|
|
|
TG (FCF): "new" assets |
|
|
3.5% |
|
|
# of shares: Ord: New |
- |
|
|
|
|
|
|
|
|
|
|
|
|
|
|
# of shares: Ord |
63 |
|
|
|
|
|
|
|
|
|
|
|
|
|
|
# of shares: Ord: treasury |
- |
|
|
|
|
|
|
|
|
|
|
|
|
|
|
# of shares: Pref |
- |
|
|
|
|
|
|
|
|
|
|
|
|
|
|
# of shares: effective, total |
63 |
|
|
|
|
|
|
|
|
|
|
|
|
|
|
TP (DCF), RUB |
2.89 |
|
|
|
|
|
|
|
|
|
|
|
|
|
|
Source: company data, Gazprombank estimates
37
vk.com/id446425943
NOVEMBER 23, 2018 |
RUSSIA > EQUITY RESEARCH > UTILITIES |
|
|
INITIATION OF COVERAGE
Enel Russia
RU
SSI
Solid FCFY-to-CoE premium unlikely to resume in medium term due to CSA expiration and wind capacity investments
Medium-term FCFY should be undermined by expiration of all thermal CSAs (after 2020) coupled with investments in new wind capacity, even though they are to be supported by CSA-like arrangements.
Operations
A foreign-controlled thermal inter-regional generator (electrical capacity ~9.4 GW) that plans to launch two wind-powered units in 2020-21 and is trying to divest its main coal-fired asset (Reftinsk TPP, ~3.8 GW).
Positives
FCFY-to-CoE premium achieved in 2017 on the back of "7-10 years" uplift to CSAs.
Solid dividend payout (65% of adjusted IFRS net income) to be applied to results of 2018-20.
Two wind-power projects ("wind parks", +0.3 GW, 2020-21) received regulatory financial support via a mechanism similar to CSA with 15 years duration.
Limited corporate governance risks due to control by Enel group.
Negatives
Approaching expiration of current thermal CSAs (Nevynomyssk TPP (Dec. 2020), Sredneural TPP (Dec. 2020)), triggering a substantial decline in EBITDA in 2021.
FCF to descend into negative territory in 2020-21 on the back of investments in windbased generating capacity even despite CSA-like support for new wind units.
Uncertain outcome of the intended sale of Reftinsk TPP; uncertain approach to use of proceeds if the sale materializes.
Valuation (2018-2026)
DY-to-CoD premium: 2018-20, 2025-26.
Note: Share prices as of closure 20-Nov-2018
TICKER |
ENRU RX |
Currency |
RUB |
|
|
Target price |
1.05 |
Upside |
-8% |
|
|
Recommendation |
Underweight |
MCap, bln |
40 |
|
|
Share price |
1.1 |
52-week high |
1.7 |
|
|
52-week low |
1.0 |
|
|
Source: Bloomberg, Gazprombank estimates
|
SHAREHOLDERS |
|
|
|
|
||
|
|
|
|
|
|||
|
|
Enel S.p.A |
56.4% |
|
|||
|
|
|
|
|
|
|
|
|
|
PFR Partners |
|
|
|
19.0% |
|
|
|
Fund |
|
|
|
|
|
|
|
|
|
|
|
|
|
|
|
Prosperity Capital |
8.2% |
|
|||
|
|
Management |
|
||||
|
|
|
|
|
|||
|
|
Free-float |
|
|
16.4% |
|
|
|
|
|
|
|
|
|
|
Source: company data
12M PRICE PERFORMANCE
140% |
|
|
|
|
|
120% |
|
|
|
|
|
100% |
|
|
|
|
|
80% |
|
MOEX INDEX |
|
|
|
|
|
|
|
||
60% |
|
ENRU |
|
|
|
40% |
Jan-18 |
Mar-18 |
May-18 |
Jul-18 |
Sep-18 |
Nov-17 |
|||||
Source: Bloomberg
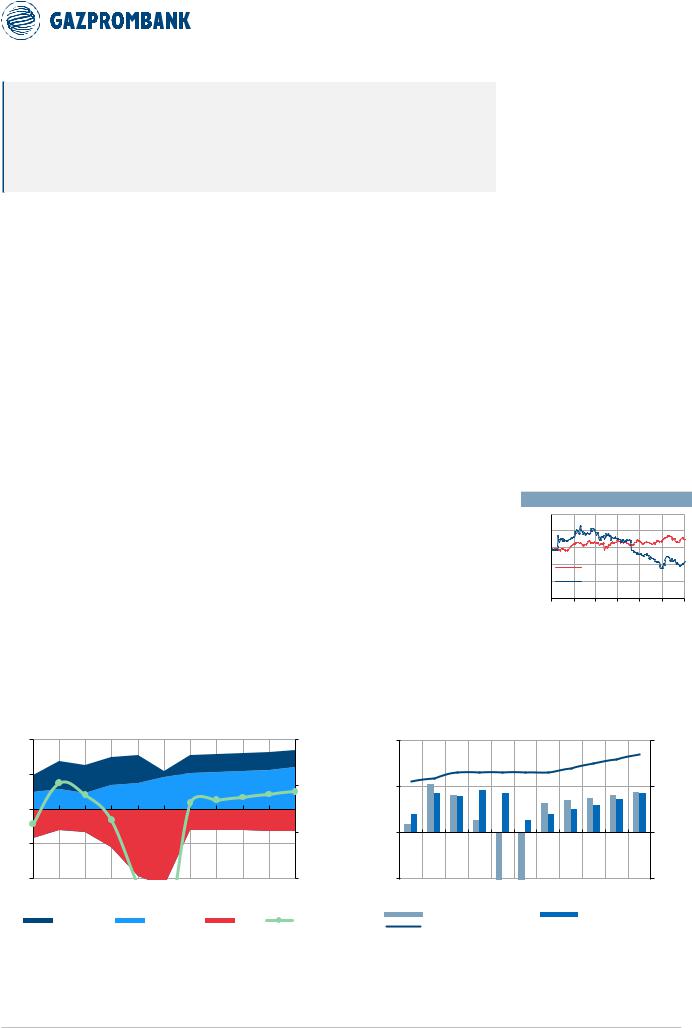
Chart 49. Enel Russia: FCF profile |
Chart 50. Enel Russia: FCFY and DY profile |
EBITDA (lhs), capex (lhs), FCFY (rhs) |
FCFY (lhs), DY (lhs) and dividend payout vs. adjusted IFRS net profit (rhs) |
20 |
EBITDA, Capex |
|
|
|
|
|
|
FCFY (line) |
30% |
30% |
|||
|
|
|
|
|
|
|
|
|
|||||
|
RUB bln |
|
|
|
|
|
|
|
|
|
|
|
|
10 |
|
|
|
|
|
|
|
|
|
|
|
|
|
|
|
|
|
|
|
|
|
|
|
|
|
15% |
15% |
0 |
|
|
|
|
|
|
|
|
|
|
|
|
|
|
|
|
|
|
|
|
|
|
|
|
|
0% |
0% |
-10 |
|
|
|
|
|
|
|
|
|
|
|
|
|
-20 |
|
|
|
|
|
|
|
|
|
|
|
-15% |
-15% |
|
2016 |
2017 |
2018E |
2019E |
2020E |
2021E |
2022E |
2023E |
2024E |
2025E |
2026E |
|
|
|
|
EBITDA ("NEW") |
|
EBITDA ("OLD") |
|
CAPEX |
|
FCFY |
|
||||
FCFY and DY (columns)
2016 |
2017 |
2018E |
2019E |
2020E |
2021E |
2022E |
2023E |
FCF YIELD (LHS)
DIVIDEND PAYOUT (RHS)
Dividend payout |
100% |
||
|
|||
|
|
(line) |
|
|
|
|
50% |
|
|
|
0% |
2024E |
2025E |
2026E |
-50% |
|
|||
DIVIDEND YIELD (LHS)
Source: company data, Gazprombank estimates |
Source: company data, Gazprombank estimates |
38

vk.com/id446425943
NOVEMBER 23, 2018 RUSSIA > EQUITY RESEARCH > UTILITIES
Table 8. Enel Russia forecast (IFRS-based) and valuation, RUB bln or RUB per share
P&L (IFRS), RUB bln: Enel Russia |
2013 |
2014 |
2015 |
2016 |
2017 |
2018E |
2019E |
2020E |
2021E |
2022E |
2023E |
2024E |
2025E |
2026E |
TV'2027 |
Revenue electricity: old |
50.7 |
54.1 |
51.2 |
51.5 |
51.3 |
50.7 |
51.2 |
52.2 |
54.4 |
55.3 |
56.1 |
56.9 |
57.7 |
59.4 |
|
Revenue electicity: new |
9.1 |
9.5 |
9.5 |
10.0 |
13.4 |
13.6 |
14.0 |
14.2 |
8.7 |
13.3 |
13.6 |
13.9 |
14.2 |
14.5 |
|
Revenue electricity |
59.8 |
63.6 |
60.7 |
61.5 |
64.7 |
64.3 |
65.2 |
66.4 |
63.0 |
68.6 |
69.8 |
70.9 |
71.9 |
73.8 |
|
Heat revenue |
4.2 |
3.8 |
3.6 |
0.3 |
0.3 |
0.3 |
2.7 |
2.8 |
3.0 |
3.1 |
3.2 |
3.3 |
3.4 |
3.5 |
|
Revenue other (incl. reselling) |
5.7 |
6.9 |
6.7 |
10.4 |
9.4 |
8.7 |
7.6 |
6.7 |
5.9 |
5.3 |
4.7 |
4.3 |
3.9 |
3.5 |
|
Revenue (before subsidies) |
69.7 |
74.4 |
71.0 |
72.2 |
74.4 |
73.3 |
75.4 |
75.9 |
71.9 |
76.9 |
77.7 |
78.4 |
79.1 |
80.9 |
|
Subsidies |
0.0 |
0.0 |
0.0 |
0.0 |
0.0 |
0.0 |
0.0 |
0.0 |
0.0 |
0.0 |
0.0 |
0.0 |
0.0 |
0.0 |
|
Revenue |
69.7 |
74.4 |
71.0 |
72.2 |
74.4 |
73.3 |
75.4 |
75.9 |
71.9 |
76.9 |
77.7 |
78.4 |
79.1 |
80.9 |
|
Fuel costs electricity, old |
(30.5) |
(32.0) |
(34.2) |
(32.3) |
(31.5) |
(31.2) |
(31.3) |
(31.3) |
(31.6) |
(31.8) |
(32.0) |
(32.2) |
(32.3) |
(33.0) |
|
Fuel costs heat, old |
(2.9) |
(3.0) |
(3.3) |
(3.1) |
(3.1) |
(3.1) |
(3.1) |
(3.1) |
(3.2) |
(3.2) |
(3.3) |
(3.3) |
(3.3) |
(3.4) |
|
Fuel costs, new |
(3.5) |
(3.7) |
(4.1) |
(4.0) |
(4.0) |
(4.1) |
(4.2) |
(4.3) |
(4.4) |
(4.6) |
(4.7) |
(4.9) |
(5.0) |
(5.1) |
|
Fuel costs,old and new |
(36.9) |
(38.8) |
(41.5) |
(39.4) |
(38.5) |
(38.3) |
(38.5) |
(38.7) |
(39.1) |
(39.6) |
(40.0) |
(40.3) |
(40.6) |
(41.6) |
|
Purchased power & Re-selling |
(5.7) |
(6.5) |
(6.2) |
(6.4) |
(5.5) |
(5.5) |
(5.2) |
(4.9) |
(4.6) |
(4.3) |
(4.0) |
(3.7) |
(3.4) |
(3.2) |
|
Heat transportation |
0.0 |
0.0 |
0.0 |
0.0 |
0.0 |
0.0 |
0.0 |
0.0 |
0.0 |
0.0 |
0.0 |
0.0 |
0.0 |
0.0 |
|
Water payment |
0.0 |
0.0 |
0.0 |
0.0 |
0.0 |
0.0 |
0.0 |
0.0 |
0.0 |
0.0 |
0.0 |
0.0 |
0.0 |
0.0 |
|
Gross profit |
27.1 |
29.2 |
23.2 |
26.4 |
30.3 |
29.4 |
31.7 |
32.2 |
28.2 |
33.1 |
33.7 |
34.4 |
35.1 |
36.1 |
|
Non-fuel Opex: Old plants |
(9.1) |
(9.7) |
(12.1) |
(11.5) |
(11.3) |
(12.1) |
(12.7) |
(13.2) |
(13.5) |
(13.1) |
(13.5) |
(13.9) |
(14.2) |
(14.5) |
|
Non-fuel Opex: new plants |
(1.2) |
(1.3) |
(1.3) |
(1.4) |
(1.5) |
(1.6) |
(1.6) |
(1.7) |
(2.3) |
(3.6) |
(3.7) |
(3.9) |
(3.9) |
(4.2) |
|
Cost of subsidies |
0.0 |
0.0 |
0.0 |
0.0 |
0.0 |
0.0 |
0.0 |
0.0 |
0.0 |
0.0 |
0.0 |
0.0 |
0.0 |
0.0 |
|
Non-fuel Opex |
(10.3) |
(11.0) |
(13.4) |
(12.9) |
(12.8) |
(13.7) |
(14.3) |
(14.9) |
(15.8) |
(16.7) |
(17.2) |
(17.7) |
(18.1) |
(18.7) |
|
EBITDA, old plants |
12.4 |
13.1 |
5.2 |
4.9 |
5.8 |
4.7 |
6.9 |
7.3 |
9.1 |
10.3 |
10.6 |
10.9 |
11.3 |
11.9 |
|
EBITDA, new plants |
4.4 |
4.6 |
4.1 |
4.7 |
8.0 |
8.0 |
8.2 |
8.2 |
1.9 |
5.1 |
5.2 |
5.2 |
5.2 |
5.1 |
|
EBITDA, reselling / other |
0.0 |
0.5 |
0.5 |
4.0 |
3.8 |
3.1 |
2.3 |
1.7 |
1.3 |
1.0 |
0.8 |
0.6 |
0.4 |
0.3 |
|
EBITDA |
16.8 |
18.2 |
9.8 |
13.5 |
17.6 |
15.8 |
17.4 |
17.3 |
12.3 |
16.4 |
16.5 |
16.7 |
17.0 |
17.4 |
|
Depreciation: Old plants |
(5.4) |
(4.8) |
(4.2) |
(1.5) |
(1.9) |
(2.3) |
(2.3) |
(2.3) |
(2.3) |
(2.3) |
(2.3) |
(2.3) |
(2.3) |
(2.3) |
|
Depreciation: New plants |
(1.6) |
(1.6) |
(1.6) |
(1.6) |
(1.6) |
(1.6) |
(1.8) |
(2.1) |
(2.7) |
(3.1) |
(3.1) |
(3.1) |
(3.1) |
(3.1) |
|
Depreciation |
(7.0) |
(6.4) |
(5.8) |
(3.1) |
(3.5) |
(4.0) |
(4.1) |
(4.5) |
(5.1) |
(5.4) |
(5.4) |
(5.4) |
(5.4) |
(5.4) |
|
EBIT |
9.9 |
11.8 |
4.0 |
10.4 |
14.1 |
11.8 |
13.3 |
12.8 |
7.3 |
11.0 |
11.1 |
11.3 |
11.6 |
12.0 |
|
Finance (costs) / income |
(3.2) |
(2.7) |
(5.8) |
(4.8) |
(3.0) |
(2.7) |
(2.4) |
(2.7) |
(4.1) |
(6.1) |
(5.6) |
(5.1) |
(4.7) |
(4.3) |
|
One-offs (cash) |
0.0 |
0.0 |
0.0 |
0.0 |
0.0 |
0.0 |
0.0 |
0.0 |
0.0 |
0.0 |
0.0 |
0.0 |
0.0 |
0.0 |
|
One-offs (non-cash): operational |
0.0 |
(2.0) |
(58.7) |
(0.1) |
(0.1) |
(0.2) |
(0.1) |
(0.1) |
(0.0) |
(0.0) |
(0.0) |
(0.0) |
(0.0) |
(0.0) |
|
One-offs (non-cash): financial |
0.0 |
0.0 |
0.0 |
0.0 |
0.0 |
0.0 |
0.0 |
0.0 |
0.0 |
0.0 |
0.0 |
0.0 |
0.0 |
0.0 |
|
EBT |
6.7 |
7.1 |
(60.5) |
5.5 |
10.9 |
8.9 |
10.7 |
10.1 |
3.1 |
4.9 |
5.5 |
6.2 |
6.9 |
7.7 |
|
Income tax |
(1.7) |
(1.5) |
11.9 |
(1.1) |
(2.4) |
(1.9) |
(2.3) |
(2.1) |
(0.7) |
(1.0) |
(1.2) |
(1.3) |
(1.4) |
(1.6) |
|
Net profit (pre-minorities) |
4.9 |
5.6 |
(48.6) |
4.4 |
8.5 |
7.0 |
8.5 |
8.0 |
2.5 |
3.8 |
4.4 |
4.9 |
5.4 |
6.1 |
|
Minority |
0.0 |
0.0 |
0.0 |
0.0 |
0.0 |
0.0 |
0.0 |
0.0 |
0.0 |
0.0 |
0.0 |
0.0 |
0.0 |
0.0 |
|
Net profit (reported) |
4.9 |
5.6 |
(48.6) |
4.4 |
8.5 |
7.0 |
8.5 |
8.0 |
2.5 |
3.8 |
4.4 |
4.9 |
5.4 |
6.1 |
|
Net profit (adj) |
4.9 |
7.1 |
(1.4) |
4.4 |
8.7 |
7.2 |
8.5 |
8.0 |
2.5 |
3.8 |
4.4 |
4.9 |
5.4 |
6.1 |
|
Leverage, RUB bn |
|
|
|
|
|
|
|
|
|
|
|
|
|
|
TV'2027 |
Net (Debt) / Cash (year end) |
(19) |
(21) |
(25) |
(20) |
(18) |
(20) |
(22) |
(34) |
(52) |
(49) |
(46) |
(43) |
(41) |
(39) |
(35) |
Net Debt or (Cash) / EBITDA (year end) |
1.1 |
1.2 |
2.5 |
1.5 |
1.0 |
1.3 |
1.3 |
2.0 |
4.3 |
3.0 |
2.8 |
2.6 |
2.4 |
2.3 |
2.0 |
Multiples |
|
|
` |
|
|
|
|
|
|
|
|
|
|
|
|
FCF Yield |
11% |
11% |
-2% |
3% |
16% |
12% |
4% |
-17% |
-35% |
10% |
11% |
11% |
12% |
13% |
|
|
|||||||||||||||
DY |
5% |
7% |
0% |
6% |
13% |
12% |
14% |
13% |
4% |
6% |
8% |
9% |
11% |
13% |
|
EV/EBITDA |
3.5 |
3.3 |
6.4 |
4.6 |
3.4 |
3.7 |
3.5 |
4.0 |
6.8 |
5.5 |
5.3 |
5.1 |
4.9 |
4.6 |
|
PE (adj) |
8.2 |
5.6 |
neg |
9.1 |
4.6 |
5.6 |
4.7 |
5.0 |
16.1 |
10.5 |
9.2 |
8.2 |
7.4 |
6.6 |
|
Dividend, RUB / s |
|
|
|
|
|
|
|
|
|
|
|
|
|
|
TV'2027 |
DPS: regular |
0.06 |
0.08 |
0.00 |
0.07 |
0.14 |
0.13 |
0.16 |
0.15 |
0.05 |
0.07 |
0.09 |
0.10 |
0.12 |
0.15 |
1.36 |
DPS: special (leverage optimization) |
|
|
|
|
|
|
|
|
|
|
|
|
|
|
(0.13) |
DPS: special (non-core assets sale) |
|
|
|
|
|
|
|
|
|
|
|
|
|
|
- |
DPS: total |
0.06 |
0.08 |
0.00 |
0.07 |
0.14 |
0.13 |
0.16 |
0.15 |
0.05 |
0.07 |
0.09 |
0.10 |
0.12 |
0.15 |
1.23 |
Dividend / Net profit (nominal) |
40% |
51% |
0% |
55% |
60% |
66% |
66% |
65% |
66% |
65% |
70% |
75% |
80% |
85% |
|
Dividend / Net profit (adj) |
40% |
40% |
0% |
55% |
59% |
65% |
65% |
65% |
65% |
65% |
70% |
75% |
80% |
85% |
|
Dividend / FCF |
46% |
65% |
neg |
235% |
82% |
95% |
338% |
neg |
neg |
65% |
72% |
80% |
88% |
98% |
|
Cash Flow, RUB bn |
|
|
|
|
|
|
|
|
|
|
|
|
|
|
TV'2027 |
NOPAT: old plants |
5.2 |
6.5 |
0.8 |
2.7 |
3.0 |
1.8 |
3.6 |
3.9 |
5.3 |
6.3 |
6.5 |
6.8 |
7.0 |
7.6 |
|
NOPAT: new |
2.1 |
2.4 |
2.0 |
2.4 |
5.0 |
5.0 |
5.1 |
4.8 |
(0.8) |
1.6 |
1.7 |
1.7 |
1.7 |
1.6 |
|
NOPAT: reselling / other |
0.0 |
0.4 |
0.4 |
3.1 |
3.0 |
2.5 |
1.8 |
1.4 |
1.0 |
0.8 |
0.6 |
0.5 |
0.4 |
0.3 |
|
NOPAT |
7.3 |
9.3 |
3.2 |
8.2 |
11.1 |
9.3 |
10.5 |
10.1 |
5.6 |
8.7 |
8.8 |
8.9 |
9.1 |
9.5 |
|
CapEx: Maintenance |
0.0 |
0.0 |
(3.2) |
(3.4) |
(5.5) |
(5.7) |
(5.8) |
(5.9) |
(5.9) |
(6.0) |
(6.1) |
(6.3) |
(6.4) |
(6.5) |
|
CapEx: New |
(8.6) |
(10.5) |
(4.9) |
(5.1) |
(0.7) |
(1.1) |
(5.4) |
(13.7) |
(16.3) |
0.0 |
0.0 |
0.0 |
0.0 |
0.0 |
|
CapEx |
(8.6) |
(10.5) |
(8.1) |
(8.5) |
(6.2) |
(6.8) |
(11.2) |
(19.5) |
(22.2) |
(6.0) |
(6.1) |
(6.3) |
(6.4) |
(6.5) |
|
Working Capital Red./ (Incr.) |
0.0 |
0.0 |
(1.1) |
0.0 |
0.0 |
0.0 |
(0.1) |
(0.1) |
0.0 |
(0.1) |
(0.1) |
(0.1) |
(0.1) |
(0.2) |
|
FCF; old plants |
10.5 |
11.4 |
0.7 |
0.8 |
(0.6) |
(1.5) |
0.0 |
0.4 |
1.8 |
2.5 |
2.6 |
2.8 |
2.9 |
3.2 |
43.4 |
FCF; new plants |
(4.9) |
(6.5) |
(1.3) |
(1.1) |
5.9 |
5.5 |
1.4 |
(6.7) |
(14.4) |
4.7 |
4.7 |
4.8 |
4.8 |
4.7 |
54.0 |
FCF: reselling / other |
0.0 |
0.4 |
0.4 |
3.1 |
3.0 |
2.5 |
1.8 |
1.4 |
1.0 |
0.8 |
0.6 |
0.5 |
0.4 |
0.3 |
2.2 |
FCF: cash one-offs |
0.0 |
0.0 |
0.0 |
0.0 |
0.0 |
0.0 |
0.0 |
0.0 |
0.0 |
0.0 |
0.0 |
0.0 |
0.0 |
0.0 |
|
FCF (to EV) |
5.7 |
5.2 |
(0.2) |
2.8 |
8.4 |
6.4 |
3.3 |
(5.0) |
(11.6) |
8.0 |
8.0 |
8.0 |
8.1 |
8.2 |
99.5 |
Interest (CF) |
(1.4) |
(0.8) |
(0.7) |
(1.8) |
(2.1) |
(1.5) |
(1.6) |
(1.8) |
(2.7) |
(4.1) |
(3.7) |
(3.4) |
(3.1) |
(2.9) |
|
FCF (to Equity) |
4.3 |
4.4 |
(0.9) |
1.0 |
6.3 |
4.9 |
1.6 |
(6.7) |
(14.3) |
3.9 |
4.2 |
4.6 |
4.9 |
5.3 |
|
Discounting parameters |
|
|
|
|
|
|
|
|
|
|
|
|
|
|
|
Period for discounting, years |
DCF |
|
|
|
|
(1.4) |
(0.4) |
0.6 |
1.6 |
2.6 |
3.6 |
4.6 |
5.6 |
6.6 |
0.6 |
|
DDM |
|
|
|
|
(0.4) |
0.6 |
1.6 |
2.6 |
3.6 |
4.6 |
5.6 |
6.6 |
7.6 |
1.6 |
Discounting factor |
DCF |
|
|
|
|
|
1.02 |
0.93 |
0.83 |
0.73 |
0.65 |
0.58 |
0.51 |
0.45 |
0.40 |
|
DDM |
|
|
|
|
1.03 |
0.92 |
0.80 |
0.70 |
0.61 |
0.53 |
0.46 |
0.40 |
0.35 |
0.31 |
DCF |
|
|
|
|
|
|
|
|
|
|
|
|
|
|
|
DCF: Old plants |
|
|
|
|
|
|
0.0 |
0.4 |
1.5 |
1.8 |
1.7 |
1.6 |
1.5 |
1.5 |
17.5 |
DCF: New plants |
|
|
|
|
|
|
1.5 |
(6.3) |
(11.8) |
3.4 |
3.1 |
2.7 |
2.4 |
2.1 |
21.8 |
DCF: Reselling / other |
|
|
|
|
|
|
1.9 |
1.3 |
0.9 |
0.6 |
0.4 |
0.3 |
0.2 |
0.1 |
0.9 |
DCF: total |
|
|
|
|
|
|
3.3 |
(4.6) |
(9.5) |
5.8 |
5.2 |
4.6 |
4.1 |
3.7 |
40.1 |
|
|
|
|
|
|
|
|
|
|
|
|
|
|
|
|
TP (DCF), RUB bln or RUB/s |
|
|
TP (w-average, rounded), RUB/s |
|
|
|
|
Valuation parameters |
|
DDM |
DCF |
Other |
|||
EV, RUB bln |
53 |
|
TP |
|
RUB/s |
Weight |
|
|
|
CoE |
|
|
14.8% |
|
|
Non-core assets |
- |
|
DDM |
|
1.05 |
100% |
|
DDM is a floor for PT |
WACC |
|
|
|
12.7% |
|
|
Net (debt) / Cash (discounted), end 2018 |
(20) |
|
DCF |
|
0.94 |
0% |
|
|
|
TG (Dividends) |
|
|
4.0% |
|
|
Equity, RUB bln |
33 |
|
Result (rounded) |
|
1.05 |
100% |
|
|
|
TG (FCF): "old" assets |
|
|
3.5% |
0.0% |
|
# of shares: current |
35 |
|
|
|
|
|
|
|
|
TG (FCF): "new" assets |
|
|
4.0% |
|
|
# of shares: Ord: New |
- |
|
|
|
|
|
|
|
|
|
|
|
|
|
|
# of shares: Ord |
35 |
|
|
|
|
|
|
|
|
|
|
|
|
|
|
# of shares: Ord: treasury |
- |
|
|
|
|
|
|
|
|
|
|
|
|
|
|
# of shares: Pref |
- |
|
|
|
|
|
|
|
|
|
|
|
|
|
|
# of shares: effective, total |
35 |
|
|
|
|
|
|
|
|
|
|
|
|
|
|
TP (DCF), RUB |
0.93 |
|
|
|
|
|
|
|
|
|
|
|
|
|
|
Source: company data, Gazprombank estimates
39
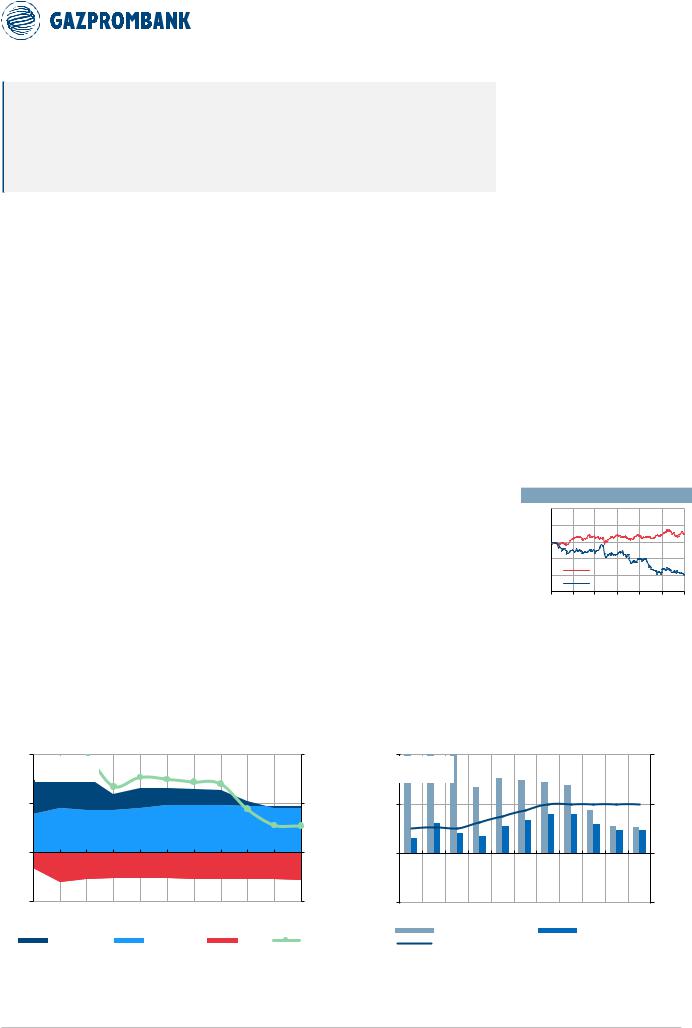
vk.com/id446425943
NOVEMBER 23, 2018 |
RUSSIA > EQUITY RESEARCH > UTILITIES |
|
|
INITIATION OF COVERAGE
Mosenergo
RU
SSI
FCFY is declining with the start of CSA expirations, but FCFY- to-CoE premium sustainable until 2023
Although CSA expirations started earlier than the industry average (CSA for three new units to expire during 2018), Mosenergo's FCFY should show a premium to CoE until 2023.
Operations
Mosenergo is the key generator of electrical and heat energy for the needs of Moscow city and region, with ~13 GW of mainly co-generating electrical capacity.
Positives
FCFY-to-CoE premium in 2018-23.
Note: Share prices as of closure 20-Nov-2018
TICKER |
MSNG RX |
Currency |
RUB |
|
|
Target price |
2.40 |
Upside |
40% |
|
|
Recommendation |
Overweight |
MCap, bln |
68 |
|
|
Share price |
1.7 |
52-week high |
3.1 |
|
|
52-week low |
1.7 |
|
|
Source: Bloomberg, Gazprombank estimates
Strong balance sheet with no net debt.
Potential increase in dividend payout (from ~25% of 2017 IFRS net income) on the back of positive FCF and a strong balance sheet.
Presence of the Moscow Government (~26%) as a blocking shareholder, which reduces corporate governance risks.
|
SHAREHOLDERS |
|
|
|
|
|
|
|
|
||
|
|
Gazprom |
53.5% |
|
|
|
|
Energoholding |
|
||
|
|
|
|
||
|
|
Moscow (City |
|
|
|
|
|
Property |
|
26.5% |
|
|
|
Department) |
|
|
|
|
|
Free-float |
20.1% |
|
|
|
|
|
|
|
|
Source: company data
Potential beneficiary of the change in heat regulation ("althernative boiler shop").
Negatives
Modest historical dividend payout, e.g. ~25% of 2017 IFRS net income paid as dividends.
FCF and EBITDA to decline in 2019 due to the start of expiration of thermal CSAs: CHP- 27-3 (Jun. 2018), CHP-21 (Jun. 2018), CHP-27-4 (Dec. 2018).
More pressure on EBITDA, FCF with CSA expiration for new units CHP-26 (Nov. 2020), CHP-9 (June 2022), CHP-16 (Dec. 2023), CHP-12 (Dec. 2023), CHP-20 (Nov. 2024).
Valuation (2018-2026)
FCFY-to-CoE premium: 2018-23.
DY-to-CoD premium: 2021-23.
12M PRICE PERFORMANCE
140% |
|
|
|
|
|
120% |
|
|
|
|
|
100% |
|
|
|
|
|
80% |
|
|
|
|
|
60% |
|
MOEX INDEX |
|
|
|
|
MSNG |
|
|
|
|
|
|
|
|
|
|
40% |
Jan-18 |
Mar-18 |
May-18 |
Jul-18 |
|
Nov-17 |
Sep-18 |
||||
Source: Bloomberg
Chart 51. Mosenergo: FCF profile |
Chart 52. Mosenergo: FCFY and DY profile |
EBITDA (lhs), capex (lhs), FCFY (rhs) |
FCFY (lhs), DY (lhs) and dividend payout vs IFRS net profit (rhs) |
50 |
EBITDA, Capex |
|
|
|
|
|
|
FCFY |
30% |
30% |
|
|
|
|
|
|
|
|
|
|
|||
|
RUB bln |
|
|
|
|
|
|
|
(line) |
|
|
25 |
|
|
|
|
|
|
|
|
|
15% |
15% |
0 |
|
|
|
|
|
|
|
|
|
0% |
0% |
-25 |
|
|
|
|
|
|
|
|
|
-15% |
-15% |
2016 |
2017 |
2018E |
2019E |
2020E |
2021E |
2022E |
2023E |
2024E |
2025E |
2026E |
|
|
EBITDA ("NEW") |
|
|
EBITDA ("OLD") |
|
CAPEX |
|
FCFY |
|
||
FCFY and DY (columns)
2016 |
2017 |
2018E |
2019E |
2020E |
2021E |
2022E |
FCF YIELD (LHS)
DIVIDEND PAYOUT (RHS)
|
|
|
100% |
|
|
Dividend |
|
|
|
payout (line) |
|
|
|
|
50% |
|
|
|
0% |
2023E |
2024E |
2025E |
2026E |
|
|
|
-50% |
|
DIVIDEND YIELD (LHS) |
||
Source: company data, Gazprombank estimates |
Source: company data, Gazprombank estimates |
40