

GS Americas Energy. Oil Gas - E P. 2019 Outlook_watermark
.pdfvk.com/id446425943
Goldman Sachs
Americas Energy: Oil & Gas - E&P
Exhibit 10: Upstream CROCI has fallen relative to oil prices over the past 15 years; however, improvement in 2018 appears to have offset some of the 2012-14 degradation, and we expect continued improvement in 2019-20
Average annual WTI oil price, $/bbl vs. weighted average CROCI (%)
Weighted average CROCI, %
21%
19%
17%
15%
13%
11%
9%
7%
5%
$0
1991-2003 saw little change |
Consistent rise in oil prices |
|
|
|
|||
in costs/assets; returns |
during the 2000’s offset cost |
|
|
|
|||
linked to oil prices |
inflation, drove strong |
|
|
|
|||
|
|
|
|
returns |
|
|
|
|
|
2000 |
|
|
|
|
|
|
|
2001 2003 |
2005 |
2006 |
|
|
2008 |
|
|
|
|
|
|
||
|
|
|
2007 |
|
|
|
|
1996 |
2004 |
|
|
|
|||
|
|
|
|
||||
1997 |
2002 |
|
|
|
|
|
|
1992 |
1991 |
|
|
|
2011 |
||
1993 |
|
1999 |
|
2009 |
2010 |
2012 |
2013 |
1994 |
1995 |
|
2019E |
|
|
2014 |
|
|
|
|
|
|
|
|
|
1998 |
|
|
2020E |
2018E |
|
Acreage boom + gas to liquids |
|
|
|
|
|
|
|
||
|
|
|
2015 |
|
|
transition post 2008 deflates |
|
|
|
|
|
|
|
returns |
|
Ample shale growth, |
2017 |
|
|
|
|
||
|
|
|
|
|
|||
cost deflation further |
2016 |
|
|
|
|
||
pushes down returns |
|
|
|
|
|
||
|
$20 |
$40 |
$60 |
$80 |
|
$100 |
|
Average annual WTI oil price, $/bbl
Source: Company data, Goldman Sachs Global Investment Research
Exhibit 11: We have seen a surge of E&Ps that have corporate level returns and debt-adjusted per share production growth in management incentives to more than 50% from 10% of our coverage
Companies with corporate returns, production per debt-adjusted share growth in short and long-term management incentives
Source: Company data, Goldman Sachs Global Investment Research
17 December 2018 |
11 |

vk.com/id446425943
Goldman Sachs
Americas Energy: Oil & Gas - E&P
Exhibit 12: Until recently, the shale oil era has been characterized by E&Ps significantly outspending cash flow; in 2018 we have seen an inflection and expect greater focus on spending within or below cash flows to continue as the shale life cycle matures; in a scenario of $54.50/bbl WTI in 2019 we would expect the FCF surplus to narrow to near $3 bn
Historical reinvestment rate (capex/cash flow) and expectations at our base case
30 |
|
|
|
|
|
|
|
|
|
|
|
|
|
|
|
|
|
|
|
175% |
20 |
|
|
|
|
|
|
|
|
|
|
|
|
|
|
|
|
|
|
|
150% |
10 |
|
|
|
|
|
|
|
|
|
|
|
|
|
|
|
|
|
|
|
125% |
0 |
|
|
|
|
|
|
|
|
|
|
|
|
|
|
|
|
|
|
|
100% |
(10) |
|
|
|
|
|
|
|
|
|
|
|
|
|
|
|
|
|
|
|
75% |
Funding gapbn)($, |
|
|
|
|
|
|
|
|
|
|
|
|
|
E&Ps transition from historical |
(%)Reinvestmentrate |
|||||
|
|
|
|
|
|
|
|
|
|
|
|
|
outspend of the early shale era to |
|||||||
|
|
|
|
|
|
|
|
|
|
|
|
|
|
|
||||||
(20) |
|
|
|
|
|
|
|
|
|
|
|
|
|
|
spending within cash flows |
|
50% |
|||
(30) |
|
|
|
|
|
|
|
|
|
|
|
|
|
|
|
|
|
|
|
25% |
(40) |
|
|
|
|
|
|
|
|
|
|
|
|
|
|
|
|
|
|
|
0% |
2000 |
2001 |
2002 |
2003 |
2004 |
2005 |
2006 |
2007 |
2008 |
2009 |
2010 |
2011 |
2012 |
2013 |
2014 |
2015 |
2016 |
2017 |
2018E |
2019E |
2020E |
|
|
|
|
|
|
|
Historical funding gap |
|
Reinvestment rate |
|
|
|
|
|
|
|||||
Source: Company data, Goldman Sachs Global Investment Research
17 December 2018 |
12 |

vk.com/id446425943
Goldman Sachs
Americas Energy: Oil & Gas - E&P
Road to Shale Tail: Shale growth potential remains robust, but focus on maturity rising
Much higher than expected US oil growth likely to keep focus on robust shale
growth potential. US oil production growth of 1.6 million bpd in 2018 was much higher than our forecast and Street expectations due to both greater onshore and offshore growth. We continue to believe shale growth potential remains robust and see our expectations for 1.2 million bpd of total US oil growth (and another 0.4 million bpd of US NGLs growth) as having more upside risk than downside risk, largely from uncovered producers. Among the shale plays, we see the greatest growth continuing to come from the Permian Basin, and how producers respond to easing bottlenecks in late 2019 will be key to Street 2020 outlook. We believe enhancements in productivity gains (including in older shale plays like the Bakken) and cost efficiency gains have helped extend inventory without pushing supply cost meaningfully higher.
However, initial data shows a deceleration in shale productivity gains in 2018, and over time we believe opportunities for shale productivity gains will become more concentrated. Data for wells drilled through June where 90-day oil rates are available suggest deceleration in shale productivity gains. This has driven Street concerns that (in the Delaware Basin and Eagle Ford Shale in particular) excessively tight spacing will lead to down yoy productivity gains in the years to come. We continue to base case 3%-10% shale productivity gains through 2020, with some declines in productivity in the 2020s. Companies continue to highlight process-driven cost efficiency gains (more favorable cycle times). On a company-specific basis, we see shale productivity and efficiency gains becoming more concentrated to those that can apply scale and technology (data analytics that optimize drilling, completion). This will likely be disproportionately seen by those with contiguous acreage positions.
Can continued shale improvements/discoveries offset depletion in maturing plays? Exploration has been modest so far, but companies are increasingly active and optimistic in US onshore exploratory potential. At present, the focus for most E&Ps is on the Big 3 oil shale plays (Permian, Bakken and Eagle Ford), with more selective interest in the DJ Basin and SCOOP/STACK. Beyond these areas, there has been little new shale exploration. The exception is the Powder River Basin in Wyoming, where EOG/CHK/DVN/APC have each disclosed resource/inventory announcements or favorable commentary. At present, we do not believe the PRB is large enough to offset depletion from the Big 3 plays in the coming years due to more limited acreage. However, further data on the PRB and exploration elsewhere will be key. We note that multiple E&Ps — such as EOG, MRO, APA, NBL, CHK — are pursuing US onshore oil exploration in disclosed or undisclosed acreage.
17 December 2018 |
13 |
vk.com/id446425943
Goldman Sachs
Americas Energy: Oil & Gas - E&P
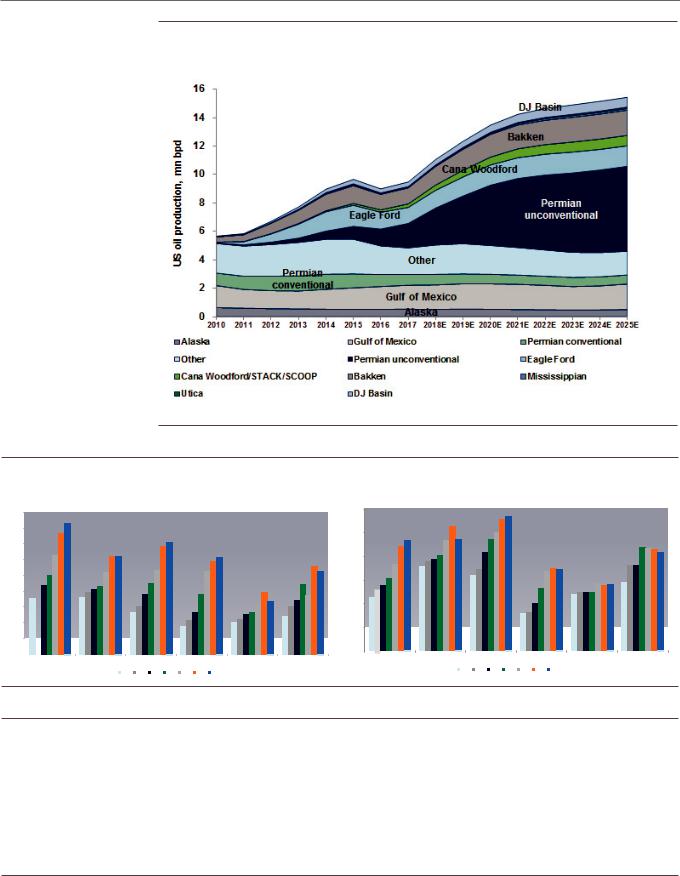
Exhibit 13: We expect US oil production will continue to grow (+1.2 mn bpd in 2019), though we see deceleration in growth in the 2020s
US oil production by play (million bpd)
Source: EIA, IHS, Company data, Goldman Sachs Global Investment Research
Exhibit 14: Productivity data for 2018 thus far would indicate a slowdown in improvements across most key US oil shale plays
3-month oil IP rates unadjusted (RHS) and adjusted (LHS) for 1K foot of lateral in key US oil shale play annually
3-month oil IP rates, bpd
900 |
|
827 |
|
|
|
|
|
|
|
|
|
|
||
|
|
|
|
|
|
|
|
|
|
|
|
|||
800 |
|
766 |
|
|
|
|
|
|
|
|
|
|
||
|
|
|
|
|
|
|
|
710 |
|
|
|
|
|
|
700 |
|
|
|
|
|
|
682 |
|
|
|
|
|
|
|
|
|
|
|
|
|
|
|
|
|
|
|
|
|
|
|
|
627 |
617622 |
|
|
|
|
|
611 |
|
|
|
||
600 |
|
|
|
|
|
|
|
|
|
|
587 |
|
|
557 |
|
|
|
|
|
|
|
|
|
|
|
|
|
||
|
|
|
|
|
|
|
528 |
|
|
|
526 |
|
|
|
|
|
502 |
520 |
|
|
|
|
|
|
522 |
||||
500 |
|
|
|
|
|
|
|
|
|
|
|
|||
|
|
|
|
|
|
451 |
|
|
|
|
|
|
439 |
|
|
|
434 |
413433 |
|
|
|
|
|
|
|
||||
|
|
|
|
|
|
|
|
394 |
||||||
400 |
|
403 |
390 |
380 |
|
|
378 |
372 |
||||||
|
|
353 |
|
|
360 |
|
|
|
|
|
|
324 |
334 |
339 |
|
|
|
|
|
|
303 |
|
|
|
|
|
|||
300 |
|
|
|
|
|
|
|
|
|
|
|
|
306 |
|
|
|
|
|
|
262 |
|
|
|
268 |
|
251267 |
|
|
|
|
|
|
|
|
|
|
|
|
|
|
237 |
|||
|
|
|
|
|
|
|
|
|
211 |
|
201219 |
|
||
200 |
|
|
|
|
|
|
|
|
|
|
|
|||
|
|
|
|
|
|
|
|
179 |
|
|
|
|
|
|
100 |
|
|
|
|
|
|
|
|
|
|
|
|
|
|
0 |
|
2.0 |
2.2 |
2.41.60.71.00.4 |
1.72.32.61.70.91.20.5 |
0.81.01.31.31.11.60.6 |
0.40.81.41.41.31.80.6 |
0.50.81.21.10.71.10.5 |
0.10.20.30.20.10.10.1 |
|||||
|
|
|
|
Bakken |
Eagle Ford |
Delaware Basin |
|
Midland Basin |
Wattenberg/ |
|
Powder River Basin |
|||
|
|
|
|
|
|
|
|
|
|
|
|
DJ Basin |
|
|
|
|
|
|
|
2012 |
2013 |
2014 |
2015 |
2016 |
2017 |
2018 |
|
|
|
3-month oil IP rates per 1K lateral ft, bpd
120 |
|
|
|
111114 |
|
|
|
|
|
|
|
|
|
|
|
|
|
|
|
|
105 |
|
|
|
|
|
100 |
|
|
|
100 |
|
|
|
|
94 |
93 |
95 |
94 |
|
|
|
|
|
|
|
|
|
|
||||
|
88 |
|
83 |
|
|
|
87 87 86 |
83 |
|
|
80 |
|
|
|
|
||
80 |
73 |
75 77 |
|
|
|
|
72 72 |
|
|
71 |
69 |
67 |
70 |
68 |
|
||
|
|
|
|
|
||||
|
61 |
|
64 |
|
|
|
|
|
60 |
|
|
|
|
57 55 56 |
58 |
|
|
55 |
|
|
53 |
|
|
|||
|
50 |
|
|
|
48 49 50 50 |
|
|
|
|
|
|
|
|
|
|
||
|
45 |
|
|
41 |
|
|
|
|
40 |
|
|
|
|
|
|
|
|
|
|
|
32 33 |
|
|
|
|
|
|
|
|
|
|
|
|
|
|
20 |
|
|
|
|
|
|
|
|
2.02.22.41.60.71.00.4 |
1.72.32.61.70.91.20.5 |
0.81.01.31.31.11.50.6 |
0.40.81.41.41.31.80.6 |
0.50.81.10.90.60.90.2 |
0.10.20.30.20.10.10.1 |
|||||
0 |
|
|
|
|
|
|
|
|
|
|
Bakken |
Eagle Ford |
Delaware Basin |
|
Midland Basin |
Wattenberg/ |
Powder River Basin |
||||
|
|
|||||||||
|
|
|
|
|
|
|
|
|
DJ Basin |
|
|
|
2012 |
2013 |
2014 |
2015 |
2016 |
2017 |
2018 |
|
|
Source: IHS, Goldman Sachs Global Investment Research
Exhibit 15: We have generally not seen a pickup in decline rates in key US oil shale basins as overall yoy rise in 365-day rates is not materially different from 90-day rates
Yoy productivity gains by basin (based on average sequential monthly oil production)
|
|
2016 vs. 2015 |
|
|
|
2017 vs. 2016 |
|
|
|
2018 vs. 2017 |
|
|||
|
90-day |
180-day |
270-day |
365-day |
|
90-day |
180-day |
270-day |
365-day |
|
90-day |
180-day |
270-day |
365-day |
Delaware |
18% |
20% |
21% |
21% |
29% |
26% |
26% |
26% |
9% |
7% |
NA |
NA |
||
Midland |
38% |
41% |
42% |
43% |
11% |
10% |
10% |
10% |
6% |
7% |
NA |
NA |
||
Bakken |
29% |
29% |
28% |
26% |
26% |
28% |
29% |
28% |
10% |
10% |
10% |
NA |
||
Eagle Ford |
13% |
12% |
11% |
11% |
20% |
20% |
18% |
18% |
13% |
14% |
NA |
NA |
||
DJ Basin |
21% |
21% |
20% |
18% |
17% |
25% |
27% |
28% |
-14% |
-10% |
NA |
NA |
||
Average |
24% |
24% |
24% |
24% |
|
21% |
22% |
22% |
22% |
|
5% |
6% |
10% |
NA |
Source: IHS, Goldman Sachs Global Investment Research
17 December 2018 |
14 |

vk.com/id446425943
Goldman Sachs
Americas Energy: Oil & Gas - E&P
Exhibit 16: What to own when on the Road to Shale Tail? Path to FCF is a secular theme; stick with shale scale for now; over time focus on producers with unique technology, resource life and/or lower shale exposure
Companies that stand out currently for what we believe will be important on the Road to Shale Tail; we are Buy rated on OXY/EOG/PXD/CXO/FANG/BRY, Neutral rated on HES/APA, Sell rated on MUR
Source: Goldman Sachs Global Investment Research
17 December 2018 |
15 |

vk.com/id446425943
Goldman Sachs
Americas Energy: Oil & Gas - E&P
Key indicator 1: Meeting/beating guidance
Execution crucial to outperformance. During 2018, our view that execution is now a prerequisite to outperformance was on display, especially during 2Q18 earnings when nearly any E&P that raised capex saw its shares fall. At the crux of our outlook for E&P equities is the notion that delivering capital efficient growth can give investors greater confidence in a firm’s ability to generate FCF. Missing guidance, weakens investor confidence in E&P capital efficiency; thus, we believe E&Ps need to meet (if not beat) production/capex guidance expectations in order to outperform relative to peers.
Which E&Ps look well positioned from a 2019 guidance standpoint? We highlight
CXO and COG for now. While many E&Ps have not yet released 2019 guidance, based on companies that have announced 2019 guidance, we expect capex +3% vs. 2018 levels (vs. guidance of 5%, the difference is mainly that we assume greater capex in 2018) and total production +10% (vs. guidance of +9%). We note that production is in part driven by 2018 E&P budget raises as many producers highlighted ongoing efficiencies that accelerated planned 2019 activity/capital into 2018. We highlight CXO and COG where we are above 2019 guidance estimates for production to a greater degree than capex.
Exhibit 17: We are 1%/1% vs company guidance for 2019 production/capex respectively for those E&Ps that have provided 2019 capex or production guidance — we are most favorable on production vs. capex for CXO and COG
2019 company guidance vs. GS vs. Bloomberg consensus for production/capex; Note: GS estimates may be adjusted to align with company guidance disclosures, while consensus estimates are not
|
|
|
|
|
|
|
|
|
|
2019 |
|
|
|
|
|
|
|
|
|
|
|
Capex ($mn) |
|
|
Total production (MBOE/d) |
|
GS vs Guidance |
|
Consensus vs Guidance |
||||
|
|
Ticker |
|
Guidance |
Consensus |
GS |
|
Guidance |
Consensus |
GS |
|
Capex |
Production |
|
Capex |
Production |
International/diversified E&Ps |
|
|
midpoint |
|
midpoint |
|
|
|||||||||
|
|
|
|
|
|
|
|
|
|
|
|
|
|
|
|
|
Occidental Petroleum |
OXY |
$5,150 |
$5,190 |
$5,315 |
|
NA |
732 |
727 |
3% |
NA |
1% |
NA |
||||
Anadarko Petroleum |
APC |
$4,500 |
$5,252 |
$4,669 |
726 |
735 |
749 |
4% |
3% |
17% |
1% |
|||||
Apache Corp. |
APA* |
$3,000 |
$3,212 |
$3,031 |
425 |
NA |
453 |
1% |
7% |
7% |
NA |
|||||
Hess Corp |
HES |
$2,900 |
$2,817 |
$3,153 |
275 |
280 |
288 |
9% |
5% |
-3% |
2% |
|||||
Oily - Permian-focused E&Ps |
|
|
|
|
|
|
|
|
|
|
|
|
|
|
|
|
Concho Resources |
CXO* |
$3,500 |
$3,481 |
$3,513 |
337 |
347 |
348 |
0% |
3% |
-1% |
3% |
|||||
Oily - Bakken-focused E&Ps |
|
|
|
|
|
|
|
|
|
|
|
|
|
|
|
|
Continental Resources |
CLR |
$2,650 |
$3,059 |
$3,160 |
347 |
349 |
347 |
19% |
0% |
15% |
1% |
|||||
Oily - Other E&Ps |
|
|
|
|
|
|
|
|
|
|
|
|
|
|
|
|
Berry Petroleum Corp. |
BRY |
$245 |
$240 |
$245 |
31 |
31 |
32 |
0% |
3% |
-2% |
2% |
|||||
Denbury Resources, Inc. |
DNR* |
$1,050 |
$802 |
$535 |
96 |
88 |
60 |
-49% |
-37% |
-24% |
-8% |
|||||
Extraction Oil & Gas Inc. |
XOG * |
$675 |
$754 |
$699 |
|
NA |
89 |
93 |
4% |
NA |
12% |
NA |
||||
North America diversified E&Ps |
|
|
|
|
|
|
|
|
|
|
|
|
|
|
|
|
Devon Energy |
DVN |
$2,550 |
$2,709 |
$2,605 |
568 |
555 |
572 |
2% |
1% |
6% |
-2% |
|||||
PDC Energy |
PDCE |
$1,000 |
$1,014 |
$1,027 |
143 |
143 |
141 |
3% |
-1% |
1% |
0% |
|||||
WPX Energy, Inc. |
WPX |
$1,550 |
$1,514 |
$1,544 |
165 |
165 |
158 |
0% |
-4% |
-2% |
0% |
|||||
Gassy - Marcellus/Utica focused E&Ps |
|
|
|
|
|
|
|
|
|
|
|
|
|
|||
Cabot Oil & Gas Corp. |
COG |
$825 |
$859 |
$822 |
414 |
426 |
430 |
0% |
4% |
4% |
3% |
|||||
CNX Resources Corp. |
CNX |
$1,430 |
$1,356 |
$1,286 |
259 |
258 |
258 |
-10% |
0% |
-5% |
0% |
|||||
Southwestern Energy |
SWN* |
NA |
$1,270 |
$1,210 |
352 |
359 |
357 |
|
NA |
1% |
|
NA |
2% |
|||
Range Resources |
RRC |
NA |
$1,058 |
$1,047 |
412 |
411 |
412 |
|
NA |
0% |
|
NA |
0% |
|||
Antero Resources |
AR* |
$1,350 |
$2,065 |
$1,396 |
541 |
543 |
547 |
3% |
1% |
53% |
0% |
|||||
EQT Corporation |
EQT* |
$2,100 |
$2,424 |
$1,965 |
680 |
701 |
697 |
-6% |
2% |
15% |
3% |
|||||
*APA production guidance/GS estimates are adjusted to exclude Egyptian tax barrels/non controlling interest *CXO capex only includes E&D capex
*DNR estimates include the proposed acquisition of PVAC; GS estimates do not *XOG capex guidance only includes D&C capex
*SWN production guidance assumes growth ranges announced with Fayetteville sale
*AR guidance and GS estimates based on long-term consolidated D&C capex expectations *For EQT, GS and guidance estimates do not include capex associated with EQM/EQGP
Source: Company data, Goldman Sachs Global Investment Research
17 December 2018 |
16 |

vk.com/id446425943
Goldman Sachs
Americas Energy: Oil & Gas - E&P
Key indicator 2: Beating consensus estimates (production, capex, EBITDA)
Street focus on execution, which we believe will continue in 2019, puts continued pressure for Energy companies — particularly large bellwethers — to beat consensus expectations for increased capital to come back into the sector. We look at this in three ways: (1) which companies will have higher production and/or lower capex than consensus; (2) which companies are we above consensus on EBITDA when we use consensus commodity price deck; and (3) which companies are we above consensus EBITDA at a strip price deck. The setup vs. strip is quite negative at present, as consensus estimates reflect oil prices meaningfully above strip. As a result, we only see upside to consensus 2019 EBITDA for select gassy E&Ps — overall at strip prices we could see 15% average negative revisions for FY19 EBITDA. However, we believe much of this negative Street revision risk is already reflected in stock prices (QTD XOP: -33% vs 2019 NYMEX WTI oil futures: -27%). Overall, we see the greatest risk/reward vs. consensus for COG among gassy E&Ps and PXD/MUR among others; we have the greatest concerns on DNR, ECR, AMR and LPI.
17 December 2018 |
17 |

vk.com/id446425943
Goldman Sachs
Americas Energy: Oil & Gas - E&P
Exhibit 18: COG among gassy E&Ps and PXD/MUR among others have most favorable combination of potential consensus EBITDA revisions using consensus commodity prices/strip prices vs. peers; DNR, ECR, AMR and LPI appear least favorable
2019E EBITDA ($ mn), GS vs. GS (consensus price deck) vs. GS (strip) vs. consensus; strip case does not adjust for impact of potentially lower capex; our estimates for ECA, CHK and XEC do not assume proposed acquisitions
|
|
|
|
|
|
|
2019E EBITDA |
|
|
|
|
Company |
|
Ticker |
|
GS (base |
GS |
GS (strip |
|
Consensus |
|
GS @ consensus |
GS @ strip price |
|
|
(consensus |
|
|
price deck vs. |
deck vs. |
|||||
|
|
case) |
price deck) |
|
|
||||||
|
|
|
|
price deck) |
|
|
|
consensus |
consensus |
||
|
|
|
|
|
|
|
|
|
|||
International/diversified E&Ps |
|
|
|
|
|
|
|
|
|
|
|
Occidental Petroleum |
OXY |
$10,479 |
$11,250 |
$8,857 |
$10,580 |
6% |
(16%) |
||||
Anadarko Petroleum |
APC |
$8,735 |
$9,410 |
$7,164 |
$8,819 |
7% |
(19%) |
||||
Apache Corp. |
APA |
$5,279 |
$5,706 |
$4,137 |
$5,001 |
14% |
(17%) |
||||
Marathon Oil |
MRO |
$4,113 |
$4,436 |
$3,335 |
$3,988 |
11% |
(16%) |
||||
Hess Corp |
HES |
$3,100 |
$3,269 |
$2,578 |
$2,940 |
11% |
(12%) |
||||
Noble Energy |
NBL |
$3,064 |
$3,234 |
$2,689 |
$3,404 |
(5%) |
(21%) |
||||
Murphy Oil |
MUR |
$2,453 |
$2,649 |
$2,010 |
$2,201 |
20% |
(9%) |
||||
Oily - Permian-focused E&Ps |
|
|
|
|
|
|
|
|
|
|
|
Pioneer Natural Resources |
PXD |
$4,665 |
$4,870 |
$3,983 |
$4,245 |
15% |
(6%) |
||||
Concho Resources |
CXO |
$3,639 |
$3,850 |
$3,173 |
$3,871 |
(1%) |
(18%) |
||||
Diamondback Energy |
FANG |
$3,213 |
$3,434 |
$2,542 |
$3,616 |
(5%) |
(30%) |
||||
Jagged Peak Energy |
JAG |
$507 |
$523 |
$469 |
$532 |
(2%) |
(12%) |
||||
Laredo Petroleum |
LPI |
$536 |
$577 |
$446 |
$641 |
(10%) |
(30%) |
||||
Parsley Energy |
PE |
$1,690 |
$1,831 |
$1,344 |
$1,703 |
7% |
(21%) |
||||
Resolute Energy |
REN |
$320 |
$343 |
$252 |
$377 |
(9%) |
(33%) |
||||
Oily - Bakken-focused E&Ps |
|
|
|
|
|
|
|
|
|
|
|
Continental Resources |
CLR |
$4,369 |
$4,625 |
$3,658 |
$4,209 |
10% |
(13%) |
||||
Whiting Petroleum Corp. |
WLL |
$1,473 |
$1,612 |
$1,147 |
$1,473 |
9% |
(22%) |
||||
Oasis Petroleum, Inc. |
OAS |
$1,323 |
$1,421 |
$1,142 |
$1,290 |
10% |
(12%) |
||||
Oily - Other E&Ps |
|
|
|
|
|
|
|
|
|
|
|
Alta Mesa Resources Inc. |
AMR |
$458 |
$488 |
$369 |
$552 |
(12%) |
(33%) |
||||
Berry Petroleum Corp. |
BRY |
$359 |
$328 |
$309 |
$378 |
(13%) |
(18%) |
||||
Denbury Resources, Inc. |
DNR |
$692 |
$752 |
$556 |
$1,022 |
(26%) |
(46%) |
||||
EP Energy |
EPE |
$885 |
$957 |
$759 |
$918 |
4% |
(17%) |
||||
Extraction Oil & Gas Inc. |
XOG |
$832 |
$897 |
$655 |
$866 |
3% |
(24%) |
||||
California Resources |
CRC |
$1,271 |
$1,380 |
$1,091 |
$1,467 |
(6%) |
(26%) |
||||
North America diversified E&Ps |
|
|
|
|
|
|
|
|
|
|
|
EOG Resources |
EOG |
$10,159 |
$10,919 |
$8,330 |
$9,644 |
13% |
(14%) |
||||
Devon Energy |
DVN |
$3,266 |
$3,387 |
$2,992 |
$3,371 |
0% |
(11%) |
||||
Chesapeake Energy |
CHK |
$2,273 |
$2,450 |
$2,420 |
$2,707 |
(10%) |
(11%) |
||||
Carrizo Oil & Gas |
CRZO |
$843 |
$917 |
$645 |
$958 |
(4%) |
(33%) |
||||
Encana Corp. |
ECA |
$3,062 |
$3,273 |
$2,983 |
$3,669 |
(11%) |
(19%) |
||||
Cimarex Energy |
XEC |
$1,632 |
$1,795 |
$1,280 |
$1,881 |
(5%) |
(32%) |
||||
Newfield Exploration |
NFX |
$1,754 |
$1,871 |
$1,437 |
$1,841 |
2% |
(22%) |
||||
QEP Resources |
QEP |
$1,090 |
$1,171 |
$802 |
$823 |
42% |
(3%) |
||||
PDC Energy |
PDCE |
$1,104 |
$1,183 |
$984 |
$1,156 |
2% |
(15%) |
||||
WPX Energy, Inc. |
WPX |
$1,710 |
$1,812 |
$1,495 |
$1,689 |
7% |
(11%) |
||||
Gassy - Marcellus/Utica focused E&Ps |
|
|
|
|
|
|
|
|
|||
Cabot Oil & Gas Corp. |
COG |
$1,717 |
$1,853 |
$2,005 |
$1,569 |
18% |
28% |
||||
CNX Resources |
CNX |
$931 |
$961 |
$944 |
$1,123 |
(14%) |
(16%) |
||||
Southwestern Energy |
SWN |
$1,206 |
$1,290 |
$1,182 |
$1,154 |
12% |
2% |
||||
Range Resources |
RRC |
$1,378 |
$1,487 |
$1,256 |
$1,383 |
8% |
(9%) |
||||
Eclipse Resources |
ECR |
$233 |
$255 |
$203 |
$343 |
(26%) |
(41%) |
||||
Gulfport Energy Corp. |
GPOR |
$1,015 |
$1,043 |
$979 |
$957 |
9% |
2% |
||||
Antero Resources |
AR |
$2,558 |
$2,668 |
$2,235 |
$2,511 |
6% |
(11%) |
||||
EQT Corporation |
EQT |
$2,561 |
$2,690 |
$2,799 |
$2,722 |
(1%) |
3% |
||||
Notes
For APA, we assume Egypt is fully consolidated as reported; we believe consensus estimates vary on this treatment
For MRO, we include an adjustment to EBITDA for equity income
For NBL, we include an adjustment to EBITDA for other income
Brent — Consensus $74.13, Strip $60.32, GS $70.00; WTI — Consensus $67.63, Strip $52.06, GS $64.50; Henry Hub — Consensus $3.10, Strip $3.28, GS $2.96
Source: Bloomberg, Factset, Goldman Sachs Global Investment Research
17 December 2018 |
18 |

vk.com/id446425943
Goldman Sachs
Americas Energy: Oil & Gas - E&P
Exhibit 19: Even at lower oil prices in 2019-20, we see Permian stocks like PXD, PE and FANG favorably valued vs. historical multiples; DNR, CNX unfavorable when comparing $54.50 scenario 2020 EV/EBITDA vs. historical multiple
2019E/2020E EV/EBITDA at WTI oil price of $64.50, $54.50, $44.50; capex and production adjusted based on price environment in sensitivity
|
|
|
|
|
|
2019E EV/EBITDA at WTI of |
|
2020E EV/EBITDA at WTI of |
||||
|
|
|
|
Historical |
|
$64.50 |
$54.50 |
$44.50 |
|
$64.50 |
$54.50 |
$44.50 |
|
|
|
|
EV/EBITDA |
|
|
||||||
|
International/diversified E&Ps |
|
|
|
|
|
|
|
|
|||
|
|
|
|
|
|
|
|
|
|
|||
|
|
Occidental Petroleum |
7.8x |
5.3 |
6.5 |
8.7 |
5.5 |
7.0 |
10.3 |
|||
|
|
Anadarko Petroleum |
7.4x |
4.9 |
5.9 |
7.8 |
4.4 |
5.5 |
8.7 |
|||
|
|
Apache Corp. |
6.1x |
4.0 |
4.9 |
6.6 |
3.7 |
4.8 |
6.7 |
|||
|
|
Hess Corp. |
7.7x |
6.8 |
8.0 |
9.3 |
6.1 |
8.2 |
12.5 |
|||
|
|
Marathon Oil |
5.8x |
4.3 |
5.4 |
7.4 |
3.5 |
4.8 |
7.7 |
|||
|
|
Noble Energy |
7.4x |
5.9 |
7.0 |
8.4 |
4.0 |
5.0 |
6.6 |
|||
|
|
Murphy Oil |
4.6x |
3.1 |
3.8 |
5.3 |
2.9 |
4.1 |
6.2 |
|||
|
Int’l/Diversified Avg |
6.7x |
4.9x |
5.9x |
7.6x |
|
4.3x |
5.6x |
8.4x |
|||
|
Permian-focused oily E&Ps |
|
|
|
|
|
|
|
|
|
||
|
|
Pioneer Natural Resources |
10.9x |
5.3 |
6.2 |
7.4 |
4.3 |
5.5 |
7.6 |
|||
|
|
Concho Resources |
9.5x |
7.9 |
8.4 |
9.7 |
5.2 |
5.9 |
7.9 |
|||
|
|
Diamondback Energy |
10.5x |
6.9 |
7.4 |
9.2 |
3.9 |
5.5 |
8.0 |
|||
|
|
Jagged Peak Energy, Inc. |
NA |
5.2 |
5.9 |
6.3 |
3.4 |
5.2 |
6.9 |
|||
|
|
Laredo Petroleum Holdings |
7.6x |
3.6 |
4.3 |
5.0 |
2.8 |
3.8 |
5.8 |
|||
|
|
Parsley Energy |
9.5x |
4.5 |
5.3 |
6.4 |
3.1 |
3.8 |
5.0 |
|||
|
|
Resolute Energy Corp. |
8.9x |
4.6 |
6.1 |
7.8 |
3.0 |
5.6 |
9.0 |
|||
|
|
Permian Avg |
9.5x |
5.4x |
6.2x |
7.4x |
|
3.7x |
5.0x |
7.2x |
||
|
Bakken-focused oily E&Ps |
|
8.8x |
5.2 |
6.1 |
7.6 |
4.2 |
5.3 |
7.1 |
|||
|
|
Continental Resources |
|
|||||||||
|
|
Whiting Petroleum Corp. |
5.4x |
3.7 |
4.6 |
6.5 |
3.0 |
4.3 |
7.2 |
|||
|
|
Oasis Petroleum, Inc. |
6.0x |
3.6 |
4.3 |
5.1 |
2.8 |
3.8 |
5.4 |
|||
|
|
Bakken Avg |
6.7x |
4.2x |
5.0x |
6.4x |
|
3.3x |
4.5x |
6.5x |
||
|
Other |
oily E&Ps |
|
|
|
|
|
|
|
|
|
|
|
|
Alta Mesa Resources Inc. |
|
NA |
3.0 |
3.6 |
4.3 |
2.3 |
2.9 |
4.4 |
||
|
|
Berry Petroleum |
|
NA |
3.4 |
4.0 |
4.5 |
2.9 |
4.1 |
6.3 |
||
|
|
California Resources |
|
NA |
5.5 |
6.6 |
8.9 |
5.3 |
7.2 |
11.6 |
||
|
|
Denbury Resources, Inc. |
|
7.5x |
5.0 |
6.0 |
7.1 |
4.7 |
6.2 |
8.8 |
||
|
|
EP Energy |
5.8x |
5.1 |
6.3 |
7.3 |
4.9 |
6.8 |
9.7 |
|||
|
|
Extraction Oil & Gas Inc. |
NA |
2.7 |
3.4 |
4.0 |
1.9 |
2.6 |
3.7 |
|||
|
|
Other oily Avg |
6.6x |
4.1x |
5.0x |
6.0x |
|
3.7x |
4.9x |
7.4x |
||
|
|
|
|
|
|
|
|
|
|
|
|
|
|
Total oily Avg |
8.2x |
4.7x |
5.5x |
6.7x |
|
3.6x |
4.9x |
7.1x |
|||
|
North America diversified E&Ps |
|
|
|
|
|
|
|
|
|
||
|
|
EOG Resources |
9.6x |
6.2 |
7.4 |
9.5 |
4.9 |
6.0 |
8.0 |
|||
|
|
Devon Energy |
7.5x |
4.8 |
5.2 |
5.3 |
4.1 |
5.1 |
7.1 |
|||
|
|
Chesapeake Energy |
6.7x |
4.1 |
4.5 |
5.0 |
3.6 |
4.1 |
4.7 |
|||
|
|
Encana Corp. |
6.4x |
3.0 |
3.1 |
3.5 |
2.3 |
2.7 |
3.9 |
|||
|
|
Cimarex Energy |
9.2x |
4.6 |
5.7 |
7.0 |
3.5 |
4.8 |
6.6 |
|||
|
|
Newfield Exploration |
6.4x |
3.0 |
3.8 |
5.1 |
2.2 |
3.5 |
6.5 |
|||
|
|
Carrizo Oil & Gas |
5.7x |
3.5 |
4.3 |
5.2 |
2.7 |
3.8 |
6.5 |
|||
|
|
WPX Energy, Inc. |
6.4x |
4.4 |
5.0 |
6.3 |
3.3 |
4.4 |
6.2 |
|||
|
|
PDC Energy |
5.6x |
3.1 |
3.4 |
3.9 |
2.4 |
2.9 |
3.5 |
|||
|
|
QEP Resources |
5.4x |
3.8 |
4.3 |
5.1 |
2.8 |
3.7 |
5.0 |
|||
|
North America diversified E&Ps Avg |
6.9x |
4.0x |
4.7x |
5.6x |
|
3.2x |
4.1x |
5.8x |
|||
|
Marcellus/Utica-focused gassy E&Ps |
|
|
|
|
|
|
|
|
|
||
|
|
Antero Resources |
8.8x |
4.0 |
4.3 |
4.8 |
3.9 |
4.4 |
5.1 |
|||
|
|
EQT Corporation |
8.7x |
3.9 |
3.9 |
3.9 |
4.3 |
4.3 |
4.4 |
|||
|
|
Cabot Oil & Gas Corporation |
10.5x |
6.9 |
6.4 |
6.4 |
6.7 |
6.3 |
6.3 |
|||
|
|
Southwestern Energy |
6.6x |
3.6 |
3.6 |
3.8 |
3.8 |
4.0 |
4.4 |
|||
|
|
Range Resources |
9.7x |
5.2 |
5.5 |
6.4 |
4.4 |
5.0 |
6.1 |
|||
|
|
Gulfport Energy Corp. |
6.6x |
3.5 |
3.4 |
3.5 |
3.4 |
3.4 |
3.8 |
|||
|
|
Eclipse Resources |
6.0x |
3.9 |
5.3 |
6.0 |
3.6 |
5.9 |
7.3 |
|||
|
|
CNX Resources |
7.0x |
6.4 |
6.1 |
6.2 |
6.1 |
5.8 |
5.9 |
|||
|
Total gassy Avg |
8.0x |
4.7x |
4.8x |
5.1x |
|
4.5x |
4.9x |
5.4x |
|||
|
|
|
|
|
|
|
|
|
|
|
|
|
|
E&P Avg |
7.5x |
4.6x |
5.2x |
6.3x |
|
3.8x |
4.8x |
6.7x |
|||
Source: Company data, Goldman Sachs Global Investment Research
17 December 2018 |
19 |

vk.com/id446425943
Goldman Sachs
Americas Energy: Oil & Gas - E&P
Key indicator 3: Corporate returns/FCF
Pressure rising for market-competitive corporate returns and FCF, particularly if
Street oil price expectations may remain rangebound in 2019. In 2018, E&Ps transitioned towards greater focus on shareholder returns/capital discipline (i.e., returns on and of capital), and in 2019 we expect that corporate returns and FCF will improve relative to oil prices. However, if there is limited optimism regarding upside to commodity prices, then the Street’s bar for corporate returns/FCF is likely to rise. E&Ps’ ability to compete with sectors outside of energy on company-specific metrics becomes increasingly relevant to attract generalist PMs. In particular, we believe investors will be focused on a combination of:
1.FCF (or clear path to FCF generation); and
2.E&Ps that either possess top-tier corporate returns at present or can demonstrate strong incremental corporate returns over the next several years that will ultimately result in above-peer absolute returns longer-term.
As seen in Exhibit 20, we highlight COG/EOG/FANG/BRY as E&Ps which demonstrate favorable FCF/returns metrics.
The setup: Sector specialists remain skeptical on E&P fiscal discipline. For most of the past decade, E&Ps have outspent cash flows by c. 20% while only delivering corporate returns in the high single digits to low-teens (i.e., at to below cost of capital levels). Valuation methodologies historically used to value the group (EV/EBITDA, EV/DACF and NAV) generally rewarded E&Ps that increased spending to deliver volume growth (so long as reinvestment opportunities exceeded the cost of capital and payback periods were relatively short). Thus, historical E&P decisions to prioritize volume growth (vs spending within cash flow/returning greater levels of capital to shareholders) were, generally speaking, an outcome of E&Ps acting to maximize perceived shareholder value.
Calls for FCF are likely to increase, including for SMIDs. As noted above, over the past few years investors have increased their focus on improving E&P corporate returns
– in part through companies ramping the return of capital to shareholders. While aggregate FCF inflected in 2018, we note that only half of our SMID E&P coverage is currently FCF neutral or has guided to achieving FCF neutrality by YE18. As such, we expect investor focus on fiscal restraint to continue. Importantly, we believe investors underappreciate that the asset bases of shale E&Ps are also maturing to the point which should support FCF growth, though it is incumbent on producers — including SMIDs — to shift strategies to provide greater visibility on FCF. This secular shift is due to our expectation that drilling capital needs should grow at levels below cash flow growth given declining lease retention obligations and rig counts at near optimal development levels (based on company guidance for long-term rig to leasehold ratios).
Will FCF yields gain broad relevance in valuation? Based on discussions, while some investors remain cautious on pivoting to a FCF yield valuation methodology (consistent with more mature industrial businesses — similar to how we view shale’s
17 December 2018 |
20 |