

GS Americas Energy. Oil Gas - E P. 2019 Outlook_watermark
.pdfvk.com/id446425943
Goldman Sachs
Americas Energy: Oil & Gas - E&P
Natural gas macro: Favorable outlook for winter, though surplus remains longer-term
We expect $2.75/MMBtu Henry Hub gas price longer-term, with 2019 prices at $3.09/MMBtu, helped by colder winter weather. We continue to see gas storage levels normalizing over the course of 2019 aided by strong zero-cost gas (associated gas from oil wells) and robust “gas-by-choice” growth. Among exposed gassy E&Ps, we prefer EQT (Buy) for underappreciated 2019 production execution and strong high-single digit FCF yield longer-term.
2019 outlook: Wide deficit in gas storage levels vs. the 5-year average heading into the 2018/9 winter along with colder than expected November weather has pushed gas storage at levels seen only once in the past 16 years and natural gas prices/strip in 4Q18/1Q19 at ~$3.55/$3.73 per MMBtu much above our $2.75/MMBtu long-term gas price outlook. Despite the substantial deficit in inventory, we expect strong production growth from associated gas/Appalachia/Haynesville above our demand expectations to drive storage back towards normal levels over the course of 2019. Confidence in more meaningful easing of supply growth or greater export/domestic demand are key to become more positive beyond more favorable weather-driven demand.
Medium/longer term: We see $2.75/MMBtu gas as Appalachian growth and “no-cost” associated gas production growth picks up in 2019 and as “gas-by-choice” growth – including in Appalachia – needs to slow in next decade.
nStrong “no-cost” gas growth. As shale oil wells get gassier over time, we see meaningful “zero cost” gas production growth even as oil production growth decelerates in the next decade. Looking into the first half of the next decade, we see potential for greater associated gas growth relative to oil growth which should drive strong “zero-cost” gas production. This crowds out “gas-by-choice” growth – while we see Appalachian growth CAGR of 14% in 2019-20 (3.7 Bcf/d per year), we see this CAGR slowing to 4% in 2021-25 (1.4 Bcf/d per year).
nLegacy plays outside Appalachia are moving down the cost curve. This limits upside to gas prices as technology has been applied in areas like the Haynesville Shale. We also continue to assume modest productivity gains in Appalachia. One of the key risks to our view is greater than expected supply from the Haynesville as rig count remains high (currently around 47 rigs).
nLNG/Mexico export growth may slow even as domestic demand growth stays relatively strong in the next decade. We continue to see strong domestic demand growth next decade helped by nuclear plant retirements and industrial activity.
However, in our base case we see international demand for US gas – LNG and Mexico – decelerating as a result of well supplied international markets and Mexico achieving near full LNG import displacement towards the end of this decade.
17 December 2018 |
51 |
vk.com/id446425943
Goldman Sachs
Americas Energy: Oil & Gas - E&P
Exhibit 57: We assume lower 2019 gas price vs. consensus/strip, |
Exhibit 58: Winter weather has resulted in a sharp decline in |
though our 2020/21 forecasts are above strip but below consensus |
storage levels and an increase in prices vs. 5-year average |
GS estimates vs consensus vs strip prices for natural gas, $/MMBtu |
Cumulative net HDD in Oct-Dec in 2018 vs. 2017 and 10-year average |
Henry Hub Natural Gas Prices ($MMBtu)
$4.00
$3.50
$3.00
$2.50
$2.00
$1.50
|
|
|
|
|
|
1,800 |
|
|
|
|
|
|
|
|
|
|
|
|
|
|
|
|
|
|
1,600 |
|
|
|
|
|
|
|
|
|
|
|
|
$3.11 |
$3.09 |
$3.12 |
|
$3.15 |
|
1,400 |
|
|
|
|
|
|
|
|
|
|
|
|
|
|
|
|
|
|
|
|
|
|
|
|
|
|
|
||||
$2.96 |
|
$2.75 |
|
$2.75 |
HDD |
1,200 |
|
|
|
|
|
|
|
|
|
|
|
|
|
|
$2.71 |
1,000 |
|
|
|
|
|
|
|
|
|
|
|
|
|||
|
|
|
|
$2.62 |
net |
|
|
|
|
|
|
|
|
|
|
|
|
|
|
|
|
|
|
|
|
|
|
|
|
|
|
|
|
|
|
|
|
|
|
|
|
|
Cumulative |
800 |
|
|
|
|
|
|
|
|
|
|
|
|
|
|
|
|
|
600 |
|
|
|
|
|
|
|
|
|
|
|
|
|
|
|
|
|
|
|
|
|
|
|
|
|
|
|
|
|
|
|
|
|
|
|
|
|
|
400 |
|
|
|
|
|
|
|
|
|
|
|
|
|
|
|
|
|
|
200 |
|
|
|
|
|
|
|
|
|
|
|
|
2019E |
|
2020E |
|
2021E |
|
0 |
|
|
|
|
|
|
|
|
|
|
|
|
|
GS |
Consensus |
Strip |
|
|
|
|
|
|
|
|
|
|
|
|
|
|
|
|
|
|
|
|
|
|
|
|
|
|
|
|
|
|
|
|||
|
|
|
|
|
|
-200 |
|
10/15 |
10/22 |
10/29 |
|
11/12 |
11/19 |
11/26 |
|
12/10 |
12/17 |
12/24 |
|
|
|
|
|
|
10/1 |
10/8 |
11/5 |
12/3 |
|||||||||
|
|
|
|
|
|
|
|
|
2018 |
|
2017 |
|
10-year average |
|
|
|
||
Source: FactSet, Goldman Sachs Global Investment Research |
Source: National Weather Service Climate Prediction Service |
Exhibit 59: Recent concerns on near-term deficit heading into winter 2018/19 have resulted in a spike in natural gas prices, though longer-term surplus should keep natural gas prices closer to our $2.75 forecast
Weekly natural gas storage (in Bcf) above (below) the five-year average
|
1,000 |
|
|
|
|
|
|
|
|
|
|
|
|
|
|
|
|
$16 |
|
|
Gas storage vs. 5-yr avg, Bcf |
800 |
|
|
|
|
|
|
|
|
|
|
|
|
|
|
|
|
$14 |
|
price, gas month front Hub Henry |
600 |
|
|
|
|
|
|
|
|
|
|
|
|
|
|
|
|
|
|||
|
|
|
|
|
|
|
|
|
|
|
|
|
|
|
|
$12 |
|
|||
400 |
|
|
|
|
|
|
|
|
|
|
|
|
|
|
|
|
|
|||
|
|
|
|
|
|
|
|
|
|
|
|
|
|
|
|
$10 |
|
|||
200 |
|
|
|
|
|
|
|
|
|
|
|
|
|
|
|
|
$/MMBtu |
|||
|
|
|
|
|
|
|
|
|
|
|
|
|
|
|
|
|
||||
0 |
|
|
|
|
|
|
|
|
|
|
|
|
|
|
|
|
$8 |
|||
(200) |
|
|
|
|
|
|
|
|
|
|
|
|
|
|
|
|
$6 |
|||
(400) |
|
|
|
|
|
|
|
|
|
|
|
|
|
|
|
|
||||
|
|
|
|
|
|
|
|
|
|
|
|
|
|
|
|
$4 |
||||
(600) |
|
|
|
|
|
|
|
|
|
|
|
|
|
|
|
|
||||
|
|
|
|
|
|
|
|
|
|
|
|
|
|
|
|
$2 |
||||
(800) |
|
|
|
|
|
|
|
|
|
|
|
|
|
|
|
|
||||
|
(1,000) |
Jan-03 |
|
|
Jan-06 |
Jan-07 |
|
|
Jan-10 |
Jan-11 |
|
|
Jan-14 |
|
|
Jan-17 |
Jan-18 |
$0 |
|
|
|
Jan-02 |
Jan-04 |
Jan-05 |
Jan-08 |
Jan-09 |
Jan-12 |
Jan-13 |
Jan-15 |
Jan-16 |
Jan-19 |
|
|
Bcf (lt axis) |
|
$/MMBtu (rt axis) |
|
Source: EIA, Goldman Sachs Global Investment Research
17 December 2018 |
52 |

vk.com/id446425943
Goldman Sachs
Americas Energy: Oil & Gas - E&P
Exhibit 60: Natural gas supply-demand summary
Bcf/d, unless noted
Dry production Disruptions Lease/plant/pipeline fuel
Marketed domestic supply yoy change
Canada net imports LNG imports (exports) Mexico/other net exports
Net imports yoy change
Residential/commercial demand Industrial demand
Gas-fired power demand (pre-C2G subst.) Vehicle
Marketed demand (bef. coal-gas substitution) yoy change
Weather impact (incl hydro) Coal-to-gas substitution Misc demand (supply)
Weather, price, miscellaneous demand yoy change
Marketed demand (reported) yoy change
Build (draw in storage) Actual weather
Actual weather, before C2G subst. Weather-normal, before C2G
2011 |
2012 |
2013 |
2014 |
2015 |
2016 |
2017 |
2018E |
2019E |
2020E |
2021E |
2022E |
2023E |
2024E |
2025E |
62.8 |
65.7 |
66.3 |
70.9 |
74.2 |
72.7 |
74.8 |
83.1 |
90.2 |
94.6 |
97.2 |
98.8 |
100.6 |
102.4 |
104.4 |
(0.0) |
(0.1) |
0.0 |
0.0 |
0.0 |
0.0 |
0.0 |
0.0 |
0.0 |
0.0 |
0.0 |
0.0 |
0.0 |
0.0 |
0.0 |
(5.5) |
(5.8) |
(6.3) |
(6.1) |
(6.2) |
(6.1) |
(6.3) |
(7.0) |
(7.6) |
(8.0) |
(8.2) |
(8.3) |
(8.5) |
(8.6) |
(8.8) |
57.2 |
59.9 |
60.0 |
64.9 |
68.0 |
66.6 |
68.5 |
76.1 |
82.6 |
86.6 |
89.0 |
90.5 |
92.1 |
93.8 |
95.6 |
4.2 |
2.6 |
0.1 |
4.9 |
3.1 |
(1.4) |
1.9 |
7.6 |
6.5 |
4.1 |
2.3 |
1.5 |
1.6 |
1.7 |
1.8 |
6.0 |
5.4 |
5.1 |
5.1 |
5.3 |
5.9 |
5.6 |
5.6 |
5.7 |
6.1 |
6.0 |
6.0 |
6.0 |
6.0 |
6.0 |
1.0 |
0.5 |
0.3 |
0.2 |
0.3 |
(0.3) |
(1.7) |
(2.8) |
(4.9) |
(7.6) |
(8.5) |
(8.7) |
(9.0) |
(9.0) |
(9.0) |
(1.6) |
(1.8) |
(1.8) |
(2.0) |
(3.0) |
(3.8) |
(4.2) |
(4.6) |
(5.5) |
(6.0) |
(6.3) |
(6.5) |
(6.7) |
(6.9) |
(7.1) |
5.4 |
4.2 |
3.6 |
3.2 |
2.6 |
1.8 |
(0.3) |
(1.8) |
(4.7) |
(7.5) |
(8.8) |
(9.2) |
(9.7) |
(9.9) |
(10.1) |
(1.8) |
(1.2) |
(0.6) |
(0.4) |
(0.7) |
(0.7) |
(2.2) |
(1.5) |
(3.0) |
(2.8) |
(1.2) |
(0.5) |
(0.5) |
(0.2) |
(0.2) |
21.5 |
21.5 |
21.4 |
21.5 |
21.6 |
21.6 |
21.9 |
22.3 |
22.7 |
22.9 |
22.9 |
23.0 |
23.1 |
23.3 |
23.4 |
19.2 |
19.7 |
20.3 |
20.9 |
20.6 |
21.1 |
21.8 |
22.8 |
23.4 |
24.1 |
24.7 |
25.4 |
26.1 |
26.8 |
27.6 |
18.0 |
19.2 |
19.1 |
21.3 |
22.3 |
22.8 |
24.4 |
25.7 |
26.6 |
27.1 |
27.6 |
28.3 |
29.3 |
30.4 |
31.6 |
0.1 |
0.1 |
0.1 |
0.1 |
0.1 |
0.1 |
0.1 |
0.1 |
0.1 |
0.2 |
0.2 |
0.2 |
0.2 |
0.3 |
0.3 |
58.7 |
60.5 |
61.0 |
63.9 |
64.7 |
65.6 |
68.3 |
70.9 |
72.9 |
74.2 |
75.4 |
77.0 |
78.8 |
80.8 |
82.8 |
1.5 |
1.8 |
0.5 |
2.9 |
0.8 |
0.9 |
2.7 |
2.7 |
2.0 |
1.3 |
1.3 |
1.5 |
1.8 |
2.0 |
2.0 |
(0.3) |
(2.6) |
1.1 |
2.2 |
0.0 |
(0.4) |
(2.0) |
1.6 |
0.0 |
0.0 |
0.0 |
0.0 |
0.0 |
0.0 |
0.0 |
3.1 |
6.1 |
3.3 |
0.7 |
3.8 |
3.8 |
1.7 |
2.5 |
2.9 |
3.4 |
3.4 |
3.4 |
3.3 |
3.3 |
2.8 |
0.1 |
0.2 |
(0.3) |
0.6 |
0.6 |
0.5 |
0.9 |
0.7 |
0.7 |
0.7 |
0.8 |
0.8 |
0.7 |
0.5 |
0.5 |
2.9 |
3.6 |
4.0 |
3.5 |
4.4 |
3.8 |
0.6 |
4.7 |
3.6 |
4.0 |
4.1 |
4.1 |
4.0 |
3.9 |
3.2 |
0.1 |
0.7 |
0.4 |
(0.5) |
0.9 |
(0.6) |
(3.2) |
4.1 |
(1.1) |
0.4 |
0.1 |
(0.0) |
(0.1) |
(0.1) |
(0.7) |
61.7 |
64.1 |
65.0 |
67.4 |
69.1 |
69.4 |
68.9 |
75.7 |
76.5 |
78.2 |
79.6 |
81.1 |
82.8 |
84.7 |
86.1 |
1.5 |
2.5 |
0.9 |
2.4 |
1.7 |
0.3 |
(0.5) |
6.8 |
0.8 |
1.7 |
1.4 |
1.5 |
1.7 |
1.9 |
1.4 |
1.0 |
(0.1) |
(1.4) |
0.7 |
1.4 |
(1.0) |
(0.7) |
(1.4) |
1.3 |
0.9 |
0.7 |
0.2 |
(0.4) |
(0.8) |
(0.6) |
4.0 |
6.0 |
1.8 |
1.4 |
5.2 |
2.8 |
1.0 |
1.2 |
4.3 |
4.3 |
4.0 |
3.5 |
2.9 |
2.5 |
2.2 |
3.8 |
3.3 |
2.9 |
3.6 |
5.3 |
2.3 |
(1.0) |
2.7 |
4.3 |
4.3 |
4.0 |
3.5 |
2.9 |
2.5 |
2.2 |
Storage, 10/31 (Tcf) |
3.8 |
3.9 |
3.8 |
3.6 |
3.9 |
4.0 |
3.8 |
3.2 |
3.6 |
3.9 |
4.2 |
4.2 |
4.1 |
3.8 |
3.6 |
|
|
|
|
|
|
|
|
|
|
|
|
|
|
|
|
Henry Hub gas price ($/MMBtu) |
$4.09 |
$2.80 |
$3.67 |
$4.38 |
$2.67 |
$2.43 |
$3.07 |
$3.02 |
$2.96 |
$2.75 |
$2.75 |
$2.75 |
$2.75 |
$2.75 |
$2.75 |
Source: EIA, Goldman Sachs Global Investment Research
17 December 2018 |
53 |
vk.com/id446425943
Goldman Sachs
Americas Energy: Oil & Gas - E&P
Where will we see bottlenecks grow/ease in 2019?
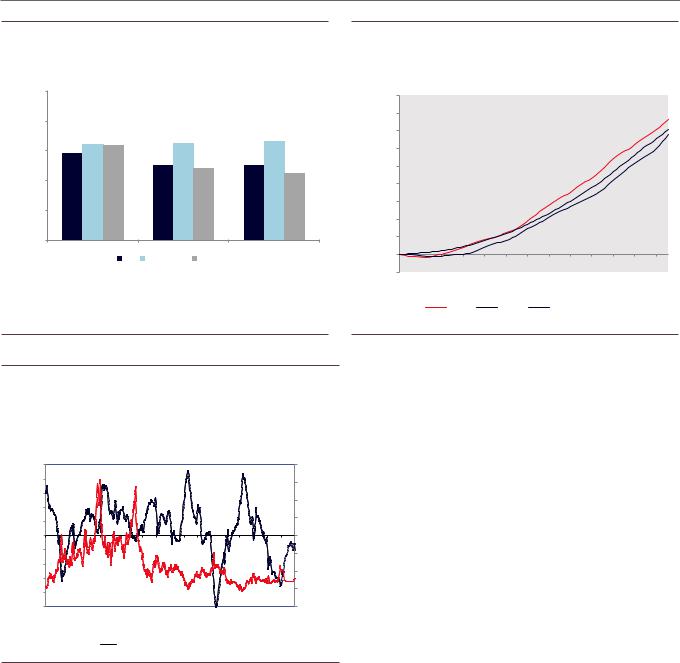
We believe the Street will remain focused on onshore bottlenecks, particularly in the Permian, Colorado and North Dakota. We believe the ability to get Permian oil production to market will remain key, and we see an easing of bottlenecks by YE19 as new long-haul oil pipeline capacity comes online.
Permian: Local market oil price exposure to flip from headwind to tailwind
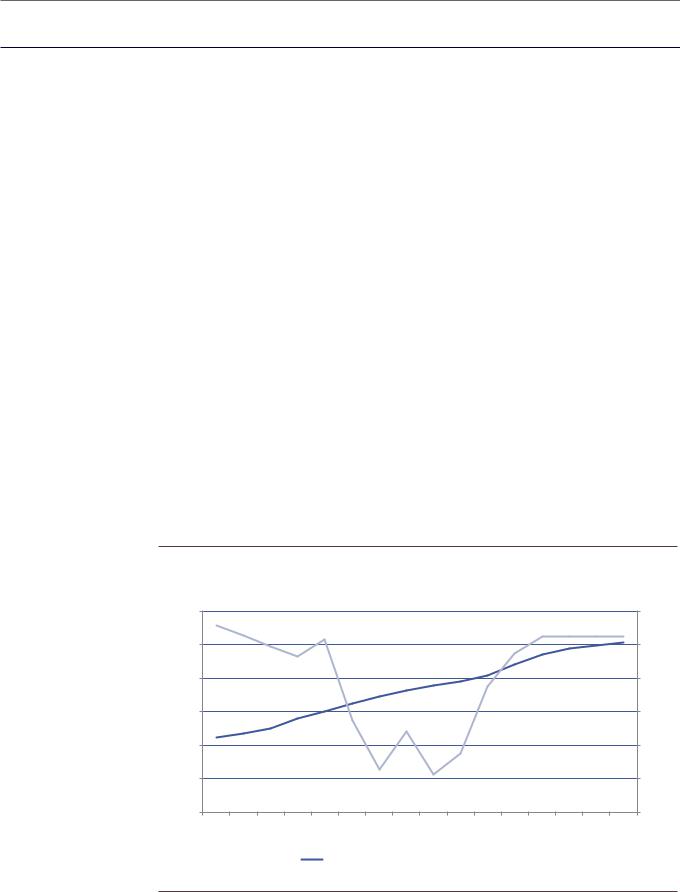
Rapid expansion of Permian oil production over 2018 (+0.8 to +0.9 million bpd, or c. 30% exit-to-exit growth) led to saturation of long-haul oil pipeline takeaway capacity and a widening out of Permian oil price differentials versus key benchmarks at Cushing (WTI) and the Gulf Coast (LLS). Generally speaking, in 2018 Permian E&Ps with high exposure to (weakening) Permian oil prices observed significant EV/EBITDA multiple compression (relative to midstream-insulated peers) due to concerns for negative 2019+ Street revisions and margin compression. Notably, GS forecasts Permian long-haul oil pipeline takeaway capacity will nearly double by 2020 vs 2018 levels, rising by c. 3 mil bpd. We expect midstream debottlenecking will drive a collapse in currently elevated local Permian oil price differentials in late 2019/2020 as, historically, basins with excess long-haul pipeline takeaway capacity have traded closer to the variable cost of pipeline transportation. Thus, we project the differential between in-basin oil prices and those on the Gulf Coast (i.e., Midland-LLS) will narrow in 2H 2019 and 2020, respectively. As visibility on Permian long-haul oil pipeline capacity debottlenecking improves we anticipate Permian E&Ps that stand to benefit from margin enhancement – such as
CXO, XEC, JAG, FANG and PE – could outperform more midstream-insulated peers
(such as OXY, PXD and WPX).
Exhibit 61: We expect Midland-LLS differentials to narrow to $3/bbl in 2020...
LHS: Permian oil production (mn bpd); RHS: Midland-LLS differential ($/bbl)
|
6 |
|
|
|
|
|
|
|
|
|
|
|
|
|
|
$0 |
|
5 |
|
|
|
|
|
|
|
|
|
|
|
|
|
|
($4) |
|
4 |
|
|
|
|
|
|
|
|
|
|
|
|
|
|
($8) |
Mbpd |
3 |
|
|
|
|
|
|
|
|
|
|
|
|
|
|
($12) |
|
|
|
|
|
|
|
|
|
|
|
|
|
|
|
|
|
|
2 |
|
|
|
|
|
|
|
|
|
|
|
|
|
|
($16) |
|
1 |
|
|
|
|
|
|
|
|
|
|
|
|
|
|
($20) |
|
0 |
2Q17 |
3Q17 |
|
|
2Q18 |
3Q18 |
|
1Q19 |
2Q19 |
3Q19 |
|
1Q20 |
2Q20 |
3Q20 |
($24) |
|
1Q17 |
4Q17 |
1Q18 |
4Q18 |
4Q19 |
4Q20 |
Permian oil production |
|
Midland-LLS |
|
Source: Bloomberg, EIA, Goldman Sachs Global Investment Research
17 December 2018 |
54 |
vk.com/id446425943
Goldman Sachs
Exhibit 62: ...as Permian long-haul pipeline capacity nearly doubles relative to 2018 levels
Permian pipeline capacity (Mbpd) vs. GS Permian oil production estimate
7,000
6,000
5,000
BPD |
4,000 |
|
|
|
|
|
|
|
|
|
|
|
|
|
|
|
|
|
|
|
|
|
|
|
|
|
|
|
|
|
|
|
|
Thousands |
3,000 |
|
|
|
|
|
|
|
|
|
|
|
|
|
|
|
|
|
|
|
|
|
|
|
|
|
|
|
|
|
|
||
|
|
|
|
|
|
|
|
|
|
|
|
|
|
|
||
|
|
|
|
|
|
|
|
|
|
|
|
|
|
|
|
|
|
2,000 |
|
|
|
|
|
|
|
|
|
|
|
|
|
|
|
|
|
|
|
|
|
|
|
|
|
|
|
|
|
|
|
1,000
0
2012 |
2013 |
2014 |
2015 |
2016 |
2017 |
2018E |
2019E |
2020E |
2021E |
2022E |
Source: Company data, Goldman Sachs Global Investment Research
Americas Energy: Oil & Gas - E&P
 Permian Gulf Coast (PGC)
 EPD NGL to Crude Conversion
 Gray Oak
 EPIC
EPIC
 Cactus II
 EPIC NGL Pipeline (Crude Service)
 Midland-to-Echo (Midland-to-Sealy)
 Permian Express III
 Permian LV/LA ext.
 Permian Express II
 Centurion
 Basin/Sunrise
 Cactus
 WTG
WTG
 Permian Express
 Longhorn
 BridgeTex
 Total Refinery Demand
Total Permian Crude Oil Supply
DJ Basin (CO): DCP natural gas processing capacity expansion likely to improve mid-year, positive for XOG, PDCE and NBL
Since 3Q17, DJ Basin E&Ps with acreage dedications to DCP Midstream’s natural gas gathering and processing system - such as NBL, PDCE, SRCI and XOG - have observed involuntary volume curtailments owing to a high capacity utilization on the system’s processing infrastructure. In early August DCP placed in service a new natural gas processing plant (Mewbourn 3, aka Plant 10), which expanded capacity on the company’s DJ Basin system by 200 MMcf/d, or 24%. However, despite the processing capacity increase, on 3Q18 results conference calls XOG and PDCE noted production growth will remain constrained until at least the start-up of DCP’s next midstream processing plant capacity expansion (200 MMcf/d O’Connor 2 plant) in 2Q19. Generally speaking, following 2Q19 we believe DJ Basin oil and natural gas volumes will not face midstream constraints until 2020+ – as cumulative DCP natural gas processing capacity will grow nearly 50% vs 2Q18 levels – which should be an incremental positive for Buy-rated PDCE and NBL. NBL has highlighted greater flexibility to execute and offset midstream bottlenecks as it ramps production in its Mustang area, though meeting expectations is key for Street appreciation.
17 December 2018 |
55 |

vk.com/id446425943
Goldman Sachs
Americas Energy: Oil & Gas - E&P
Updating estimates and target prices
Exhibit 63: Updated EBITDA estimates driven by changes to costs, production, hedges and realized prices for select E&Ps
Millions of $
|
12/15/2018 |
|
|
|
|
|
|
|
|
|
|
|
Annual EBITDA Estimates |
|
|
|
|
|
|
|
|
|
|
|||
|
|
|
|
2018E |
|
|
|
2019E |
|
|
|
2020E |
|
|
|
|
2021N |
|
|
|
2022N |
|
|
|
2023N |
|
|
Ticker |
|
new |
old |
% chg |
|
new |
old |
% chg |
|
new |
old |
% chg |
|
new |
|
old |
% chg |
|
new |
old |
% chg |
|
new |
old |
% chg |
International/ diversified E&Ps |
|
|
|
|
|
|
|
|
|
|
|
|
|
|
|
|
|
|
|
|
|
|
|
|
|
|
Apache Corp. |
APA |
$5,053 |
$5,050 |
0.1% |
$5,279 |
$5,172 |
2.1% |
$4,947 |
$4,897 |
1.0% |
$5,150 |
|
$5,134 |
0.3% |
$5,359 |
$5,330 |
0.5% |
$5,543 |
$5,513 |
0.6% |
||||||
Hess Corp. |
HES |
$2,802 |
$2,791 |
0.4% |
$3,100 |
$3,020 |
2.7% |
$2,857 |
$2,695 |
6.0% |
$3,163 |
|
$2,830 |
11.8% |
$3,233 |
$2,933 |
10.3% |
$4,191 |
$3,569 |
17.4% |
||||||
Marathon Oil |
MRO |
$3,637 |
$3,637 |
0.0% |
$3,880 |
$3,880 |
0.0% |
$3,588 |
$3,588 |
0.0% |
$3,850 |
|
$3,850 |
0.0% |
$4,050 |
$4,050 |
0.0% |
$4,219 |
$4,219 |
0.0% |
||||||
Murphy Oil |
MUR |
$1,736 |
$1,706 |
1.7% |
$2,453 |
$2,445 |
0.3% |
$2,075 |
$2,086 |
-0.5% |
$2,186 |
|
$2,192 |
-0.3% |
$2,225 |
$2,219 |
0.3% |
$2,156 |
$2,152 |
0.2% |
||||||
Oily E&Ps |
|
|
|
|
|
|
|
|
|
|
|
|
|
|
|
|
|
|
|
|
|
|
|
|
|
|
Diamondback Energy |
FANG |
$1,674 |
$1,674 |
0.0% |
$3,213 |
$3,213 |
0.0% |
$3,870 |
$3,870 |
0.0% |
$4,500 |
|
$4,562 |
-1.4% |
$5,023 |
$5,079 |
-1.1% |
$5,459 |
$5,515 |
-1.0% |
||||||
Alta Mesa Resources |
AMR |
$251 |
$251 |
0.0% |
$458 |
$458 |
-0.2% |
$532 |
$581 |
-8.5% |
$630 |
|
$702 |
-10.2% |
$730 |
$811 |
-10.1% |
$825 |
$920 |
-10.3% |
||||||
North America diversified E&Ps |
|
|
|
|
|
|
|
|
|
|
|
|
|
|
|
|
|
|
|
|
|
|
|
|
||
Chesapeake Energy |
CHK |
$2,321 |
$2,321 |
0.0% |
$2,273 |
$2,643 |
-14.0% |
$2,824 |
$2,757 |
2.4% |
$2,966 |
|
$2,966 |
0.0% |
$3,442 |
$3,442 |
0.0% |
$3,739 |
$3,739 |
0.0% |
||||||
EOG Resources |
EOG |
$8,641 |
$8,641 |
0.0% |
$10,159 |
$10,166 |
-0.1% |
$9,994 |
$10,177 |
-1.8% |
$11,057 |
|
$11,406 |
-3.1% |
$11,847 |
$12,263 |
-3.4% |
$12,413 |
$12,871 |
-3.6% |
||||||
Source: Goldman Sachs Global Investment Research
Exhibit 64: Updated EPS estimates driven by changes to costs, production, hedges and realized prices for select E&Ps
Per share
|
|
|
|
|
|
|
|
|
|
|
|
|
Annual EPS estimates |
|
|
|
|
|
|
|
|
|
|
||
|
|
|
|
2018E |
|
|
|
2019E |
|
|
|
2020E |
|
|
|
2021N |
|
|
|
2022N |
|
|
|
2023N |
|
|
Ticker |
|
new |
old |
% chg |
|
new |
old |
% chg |
|
new |
old |
% chg |
|
new |
old |
% chg |
|
new |
old |
% chg |
|
new |
old |
% chg |
International/ diversified E&Ps |
|
|
|
|
|
|
|
|
|
|
|
|
|
|
|
|
|
|
|
|
|
|
|
|
|
Apache Corp. |
APA |
$2.07 |
$2.06 |
0.2% |
$2.33 |
$2.20 |
5.5% |
$1.90 |
$1.82 |
4.1% |
$2.03 |
$1.98 |
2.4% |
$2.10 |
$2.04 |
2.9% |
$2.15 |
$2.08 |
3.2% |
||||||
Hess Corp. |
HES |
$0.13 |
$0.10 |
19.5% |
$0.89 |
$0.75 |
17.7% |
-$0.20 |
-$0.23 |
14.3% |
$0.38 |
$0.06 |
505.7% |
$0.45 |
$0.13 |
257.7% |
$2.46 |
$1.13 |
117.0% |
||||||
Marathon Oil |
MRO |
$0.84 |
$0.84 |
0.0% |
$1.33 |
$1.16 |
14.8% |
$0.95 |
$0.62 |
51.7% |
$1.13 |
$0.71 |
59.4% |
$1.16 |
$0.71 |
63.2% |
$1.19 |
$0.71 |
67.0% |
||||||
Murphy Oil |
MUR |
$1.44 |
$1.37 |
5.5% |
$3.33 |
$3.43 |
-2.7% |
$1.08 |
$1.17 |
-7.7% |
$0.97 |
$1.02 |
-4.9% |
$0.87 |
$0.85 |
1.7% |
$0.70 |
$0.68 |
2.3% |
||||||
Oily E&Ps |
|
|
|
|
|
|
|
|
|
|
|
|
|
|
|
|
|
|
|
|
|
|
|
|
|
Diamondback Energy |
FANG |
$6.37 |
$6.37 |
0.0% |
$6.79 |
$6.79 |
0.0% |
$8.89 |
$8.89 |
0.0% |
$10.81 |
$10.96 |
-1.3% |
$12.39 |
$12.51 |
-1.0% |
$13.67 |
$13.78 |
-0.8% |
||||||
Alta Mesa Resources |
AMR |
$0.24 |
$0.24 |
0.0% |
$0.30 |
$0.30 |
-1.4% |
$0.32 |
$0.36 |
-12.1% |
$0.46 |
$0.52 |
-12.1% |
$0.63 |
$0.71 |
-11.5% |
$0.73 |
$0.82 |
-11.3% |
||||||
North America diversified E&Ps |
|
|
|
|
|
|
|
|
|
|
|
|
|
|
|
|
|
|
|
|
|
|
|
|
|
Chesapeake Energy |
CHK |
$0.73 |
$0.73 |
0.0% |
$0.53 |
$0.79 |
-32.2% |
$0.91 |
$0.86 |
6.0% |
$0.95 |
$0.95 |
0.0% |
$1.25 |
$1.25 |
0.0% |
$1.36 |
$1.36 |
0.0% |
||||||
EOG Resources |
EOG |
$6.03 |
$6.03 |
0.0% |
$6.87 |
$6.88 |
-0.2% |
$5.52 |
$5.67 |
-2.6% |
$6.13 |
$6.41 |
-4.3% |
$6.59 |
$6.93 |
-4.8% |
$6.61 |
$6.97 |
-5.2% |
||||||
Source: Goldman Sachs Global Investment Research
Exhibit 65: Price target framework and methodology for E&P coverage universe (updated)
Price targets are 12-months and DCF/M&A-based; key risks include government pronouncements, well results, costs and commodity price volatility;
|
|
|
|
|
|
|
|
|
Fundamental value |
|
|
|
|
|
|
|
|
|
|
|
M&A value |
|
|
|
|
|
New Target Price |
|
|
|
|
|||||||||||
|
|
|
|
|
|
|
Base value |
|
|
|
|
|
|
|
|
Shale efficiency value |
|
|
|
|
|
|
|
|
|
|
|
|
|
|
|
|
|
|
|
|
Old |
|
Change in |
|||
|
|
Price |
|
Rating |
|
$57 oil |
Target |
% |
Upside |
|
|
|
|
|
|
|
$51 oil |
Target |
% |
Upside |
|
|
|
|
|
|
|
M&A |
$69.50 oil/ |
M&A |
% |
Upside |
|
|
|
Target |
Dividend |
Return to |
|
Target |
|
target |
|
|
|
|
|
|
|
|
|
|
|
|
|
|
|
|
|
|
|
|
|
|
|
||||||||||||||||||||
International/diversified E&Ps |
|
12/14/2018 |
|
|
$3.00 gas |
disc. rate |
weight |
|
|
|
|
|
|
|
$2.75 gas |
disc. rate |
weight |
|
|
|
|
|
|
|
rank |
$3.25 gas |
disc. rate |
weight |
|
|
|
Price |
yield |
target |
|
Price |
|
price |
||||
|
|
|
|
|
|
|
|
|
|
|
|
|
|
|
|
|
|
|
|
|
|
|
|
|
|
|
|
|
|
|
|
|
|
|
|
|
|
|
|
|
|
|
Occidental Petroleum |
OXY |
$65.10 |
|
Buy |
$78 |
9.0% |
21% |
20% |
$85 |
9.0% |
64% |
31% |
2 |
$96 |
10% |
15% |
48% |
|
|
|
$85.50 |
5% |
36% |
$89.00 |
-4% |
|||||||||||||||||
Anadarko Petroleum |
APC |
$50.95 |
|
Buy |
$62 |
10.0% |
21% |
21% |
$72 |
10.0% |
64% |
41% |
2 |
$83 |
10% |
15% |
62% |
|
|
|
$71.50 |
2% |
43% |
$75.50 |
-5% |
|||||||||||||||||
Apache Corp. |
APA |
$30.24 |
|
Neutral |
$35 |
10.0% |
25% |
17% |
$41 |
10.0% |
75% |
36% |
3 |
$50 |
10% |
0% |
64% |
|
|
|
$39.50 |
3% |
34% |
$46.50 |
-15% |
|||||||||||||||||
Hess Corp. |
HES |
$50.90 |
|
Neutral |
$72 |
10.0% |
25% |
41% |
$62 |
10.0% |
75% |
21% |
3 |
$88 |
10% |
0% |
72% |
|
|
|
$64.00 |
2% |
28% |
$67.00 |
-4% |
|||||||||||||||||
Marathon Oil |
MRO |
$15.04 |
|
Neutral |
$16 |
10.0% |
21% |
4% |
$18 |
10.0% |
64% |
21% |
2 |
$23 |
10% |
15% |
56% |
|
|
|
$18.50 |
1% |
24% |
$20.75 |
-11% |
|||||||||||||||||
Noble Energy |
NBL |
$21.79 |
|
Buy |
$29 |
10.3% |
21% |
33% |
$32 |
10.3% |
64% |
48% |
2 |
$34 |
10% |
15% |
55% |
|
|
|
$31.75 |
2% |
48% |
$35.75 |
-11% |
|||||||||||||||||
Murphy Oil |
MUR |
$27.53 |
|
Sell |
$29 |
10.3% |
25% |
5% |
$30 |
10.3% |
75% |
9% |
3 |
$37 |
10% |
0% |
34% |
|
|
|
$29.50 |
4% |
11% |
$32.00 |
-8% |
|||||||||||||||||
Permian-focused oily E&Ps |
|
|
|
|
|
|
|
|
|
|
|
|
|
|
|
|
|
|
|
|
|
|
|
|
|
|
|
|
|
|
|
|
|
|
|
|
|
|
|
|
|
|
Pioneer Natural Resources |
PXD |
$137.14 |
|
Buy |
$152 |
10.0% |
18% |
11% |
$212 |
10.0% |
53% |
54% |
1 |
$217 |
10% |
30% |
58% |
|
|
|
$203.00 |
0% |
48% |
$214.00 |
-5% |
|||||||||||||||||
Concho Resources |
CXO |
$115.02 |
|
Buy |
$121 |
9.5% |
21% |
5% |
$173 |
9.5% |
64% |
50% |
2 |
$175 |
10% |
15% |
52% |
|
|
|
$162.50 |
0% |
42% |
$170.50 |
-5% |
|||||||||||||||||
Diamondback Energy |
FANG |
$92.71 |
|
Buy |
$122 |
9.5% |
21% |
32% |
$124 |
9.5% |
64% |
34% |
2 |
$148 |
10% |
15% |
60% |
|
|
|
$127.00 |
1% |
38% |
$138.00 |
-8% |
|||||||||||||||||
Laredo Petroleum Holdings |
LPI |
$3.95 |
|
Neutral |
$3 |
11.8% |
21% |
-31% |
$5 |
11.8% |
64% |
36% |
2 |
$6 |
10% |
15% |
42% |
|
|
|
$4.75 |
0% |
20% |
$5.50 |
-14% |
|||||||||||||||||
Jagged Peak Energy |
JAG |
$9.82 |
|
Buy |
$9 |
10.8% |
18% |
-4% |
$13 |
10.8% |
53% |
29% |
1 |
$18 |
11% |
30% |
85% |
|
|
|
$14.00 |
0% |
43% |
$15.00 |
-7% |
|||||||||||||||||
Parsley Energy |
PE |
$16.43 |
|
Buy |
$25 |
11.0% |
18% |
51% |
$26 |
11.0% |
53% |
57% |
1 |
$35 |
11% |
30% |
114% |
|
|
|
$28.00 |
0% |
70% |
$30.00 |
-7% |
|||||||||||||||||
Bakken-focused E&Ps |
|
|
|
|
|
|
|
|
|
|
|
|
|
|
|
|
|
|
|
|
|
|
|
|
|
|
|
|
|
|
|
|
|
|
|
|
|
|
|
|
|
|
Continental Resources |
CLR |
$45.77 |
|
Neutral |
$50 |
10.0% |
18% |
8% |
$54 |
10.0% |
53% |
18% |
1 |
$69 |
10% |
30% |
50% |
|
|
|
$57.75 |
0% |
26% |
$59.25 |
-3% |
|||||||||||||||||
Whiting Petroleum Corp. |
WLL |
$28.14 |
|
Neutral |
$28 |
11.8% |
21% |
-2% |
$26 |
11.8% |
64% |
-9% |
2 |
$60 |
10% |
15% |
112% |
|
|
|
$31.00 |
0% |
10% |
$35.00 |
-11% |
|||||||||||||||||
Oasis Petroleum, Inc. |
OAS |
$5.89 |
|
Neutral |
$8 |
11.8% |
21% |
36% |
$7 |
11.8% |
64% |
15% |
2 |
$15 |
10% |
15% |
146% |
|
|
|
$8.25 |
0% |
40% |
$9.50 |
-13% |
|||||||||||||||||
Other oily E&Ps |
|
|
|
|
|
|
|
|
|
|
|
|
|
|
|
|
|
|
|
|
|
|
|
|
|
|
|
|
|
|
|
|
|
|
|
|
|
|
|
|
|
|
Alta Mesa Resources |
AMR |
$1.25 |
|
Neutral |
$2 |
11.0% |
25% |
52% |
$2 |
11.0% |
75% |
28% |
3 |
$5 |
10% |
0% |
260% |
|
|
|
$1.75 |
0% |
40% |
$2.50 |
-30% |
|||||||||||||||||
California Resource Corp |
CRC |
$20.96 |
|
Neutral |
$44 |
10.5% |
25% |
110% |
$11 |
10.5% |
75% |
-46% |
3 |
$111 |
10% |
0% |
430% |
|
|
|
$20.00 |
0% |
-5% |
$23.00 |
-13% |
|||||||||||||||||
Berry Petroleum |
BRY |
$10.43 |
|
Buy |
$19 |
10.8% |
25% |
77% |
$15 |
10.8% |
75% |
39% |
3 |
$28 |
10% |
0% |
168% |
|
|
|
$15.50 |
1% |
50% |
$17.00 |
-9% |
|||||||||||||||||
Denbury Resources, Inc. |
DNR |
$2.08 |
|
Sell |
$1.50 |
11.3% |
25% |
-28% |
$2 |
11.3% |
75% |
-4% |
3 |
$10 |
10% |
0% |
381% |
|
|
|
$2.00 |
0% |
-4% |
$2.50 |
-20% |
|||||||||||||||||
EP Energy |
EPE |
$0.81 |
|
Neutral |
$0 |
11.5% |
25% |
-100% |
$1 |
11.5% |
75% |
10% |
3 |
$4 |
10% |
0% |
432% |
|
|
|
$0.75 |
0% |
-7% |
$1.25 |
-40% |
|||||||||||||||||
Extraction Oil & Gas Inc. |
XOG |
$4.80 |
|
Neutral |
$5 |
14.5% |
25% |
13% |
$7 |
14.5% |
75% |
46% |
3 |
$17 |
10% |
0% |
254% |
|
|
|
$6.50 |
0% |
35% |
$8.50 |
-24% |
|||||||||||||||||
PDC Energy |
PDCE |
$30.92 |
|
Buy |
$37 |
12.8% |
25% |
21% |
$47 |
12.8% |
75% |
52% |
3 |
$78 |
10% |
0% |
152% |
|
|
|
$45.00 |
0% |
46% |
$51.00 |
-12% |
|||||||||||||||||
North America diversified E&Ps |
|
|
|
|
|
|
|
|
|
|
|
|
|
|
|
|
|
|
|
|
|
|
|
|
|
|
|
|
|
|
|
|
|
|
|
|
|
|
|
|
|
|
EOG Resources |
EOG |
$100.08 |
|
Buy |
$111 |
9.5% |
18% |
11% |
$135 |
9.5% |
53% |
35% |
1 |
$144 |
10% |
30% |
44% |
|
|
|
$133.50 |
1% |
34% |
$136.50 |
-2% |
|||||||||||||||||
Devon Energy |
DVN |
$25.84 |
|
Neutral |
$26 |
10.0% |
25% |
3% |
$34 |
10.0% |
75% |
33% |
3 |
$40 |
10% |
0% |
57% |
|
|
|
$32.25 |
1% |
26% |
$35.00 |
-8% |
|||||||||||||||||
Carrizo Oil & Gas |
CRZO |
$12.52 |
|
Neutral |
$12 |
12.5% |
21% |
-4% |
$17 |
12.5% |
64% |
34% |
2 |
$28 |
10% |
15% |
121% |
|
|
|
$17.00 |
0% |
36% |
$21.00 |
-19% |
|||||||||||||||||
WPX Energy, Inc. |
WPX |
$12.08 |
|
Neutral |
$13 |
10.8% |
25% |
10% |
$17 |
10.8% |
75% |
39% |
3 |
$24 |
10% |
0% |
100% |
|
|
|
$16.00 |
0% |
32% |
$17.50 |
-9% |
|||||||||||||||||
Marcellus-focused gassy E&Ps |
|
|
|
|
|
|
|
|
|
|
|
|
|
|
|
|
|
|
|
|
|
|
|
|
|
|
|
|
|
|
|
|
|
|
|
|
|
|
|
|
|
|
Cabot Oil & Gas Corporation |
COG |
$23.31 |
|
Neutral |
$28 |
9.5% |
18% |
22% |
$26 |
9.5% |
53% |
12% |
1 |
$35 |
10% |
30% |
48% |
|
|
|
$29.00 |
1% |
26% |
$29.00 |
0% |
|||||||||||||||||
Southwestern Energy |
SWN |
$3.80 |
|
Sell |
$4 |
10.5% |
21% |
-5% |
$4 |
10.5% |
64% |
-6% |
2 |
$7 |
10% |
15% |
76% |
|
|
|
$4.00 |
0% |
5% |
$4.25 |
-6% |
|||||||||||||||||
Range Resources |
RRC |
$11.74 |
|
Neutral |
$18 |
10.5% |
21% |
50% |
$14 |
10.5% |
64% |
22% |
2 |
$19 |
10% |
15% |
58% |
|
|
|
$15.50 |
1% |
33% |
$17.50 |
-11% |
|||||||||||||||||
Gulfport Energy Corp. |
GPOR |
$8.58 |
|
Neutral |
$8 |
10.5% |
25% |
-7% |
$10 |
10.5% |
75% |
17% |
3 |
$15 |
11% |
0% |
77% |
|
|
|
$9.50 |
0% |
11% |
$10.00 |
-5% |
|||||||||||||||||
Eclipse Resources |
ECR |
$0.95 |
|
Neutral |
$0.50 |
10.5% |
18% |
-47% |
$1.00 |
10.5% |
53% |
5% |
1 |
$2.00 |
10% |
30% |
111% |
|
|
|
$1.25 |
0% |
32% |
$1.25 |
0% |
|||||||||||||||||
EQT Corporation |
EQT |
$19.40 |
|
Buy |
$24 |
10.5% |
21% |
25% |
$22 |
10.5% |
64% |
12% |
2 |
$31 |
10% |
15% |
60% |
|
|
|
$23.50 |
1% |
22% |
$23.00 |
2% |
|||||||||||||||||
CNX Resources |
CNX |
$12.34 |
|
Sell |
$10 |
10.0% |
21% |
-15% |
$12 |
10.0% |
64% |
0% |
2 |
$16 |
10% |
15% |
28% |
|
|
|
$12.50 |
0% |
1% |
$12.50 |
0% |
|||||||||||||||||
Note: EOG, OXY and PXD are on the Americas Conviction List; Oil prices referenced above are WTI
Source: FactSet, Goldman Sachs Global Investment Research
nAMR. We are lowering 2019 capital spending expectations as we anticipate weaker current NYMEX oil price futures vs GS base case and greater investor liquidity concerns (AMR debt yields have risen to c. 15% from c. 10%) will result in lower spending vs our prior forecast. Our 2020+ production and capital spending
17 December 2018 |
56 |

vk.com/id446425943
Goldman Sachs
Americas Energy: Oil & Gas - E&P
forecasts also fall as we anticipate AMR will anchor capital spending to cash flow levels.
nCRZO. We have raised our CRZO discount rate assumption to 12.5% from 12.25% to reflect elevated 2019 negative Street revision risk due to the recent decline in oil futures prices. Based on our $45/Bbl WTI scenario analysis CRZO screens as at risk of greater than 5% cuts to GS base case 2019E oil production forecasts.
nDJ Basin E&Ps. We have accounted for greater Colorado regulatory uncertainty following the election of a Democratic majority in both houses of congress, as well as at the governor level by further increasing our PDCE and XOG discount rate assumptions by 25 and 75bp, respectively. Since pre-election levels we have now increased our discount rates to 12.75% (from 9.75%) for PDCE and to 14.5% (from 10.25%) for XOG. Note, the lower relative increase for PDCE is due to the firm’s greater asset exposure to future non-DJ Basin (Colorado) growth opportunities.
nDNR. We have marked-to-market our equity issuance price assumption in our debt restructuring scenario to $2.00 from $2.25.
Financial advisory disclosures
Goldman Sachs and/or one of its affiliates is acting as a financial advisor in connection with an announced strategic matter involving the following company or one of its affiliates: Anadarko Petroleum Corporation, Chesapeake Energy Corporation, EQT Corporation, Hess Corporation
17 December 2018 |
57 |