

GS Americas Energy. Oil Gas - E P. 2019 Outlook_watermark
.pdfvk.com/id446425943
Goldman Sachs
Americas Energy: Oil & Gas - E&P
M&A picking up, but when will it receive Street appreciation?
2018 saw an increase in corporate M&A; can the momentum continue? We have seen an uptick in corporate E&P M&A in shale this year that may continue as companies pursue intra-basin scale or look to add inventory/shift into new basins. We see three potential emerging M&A trends: (1) consolidation among shale companies to build scale; (2) select shale corporate acquisitions by majors to improve returns/scale/short-cycle inventory; and (3) need to replenish inventory/returns/FCF via inorganic acquisitions. While we take no view on the likelihood of any transaction and the timing of the inflection in further M&A activity is unclear, corporate E&P M&A could continue in part due to the intersection of energy equity/financial underperformance, the potential to realize operational synergies and trends in shale innovation.
Scale M&A vs. Survival M&A — neither appear to have been at least initially
appreciated by the Street. As we highlighted in our November 2, 2018 report, M&A returning: What will investors reward? and in our November 28, 2017 report, The next great Energy M&A wave?, we believe corporate/asset level transactions can be divided into two buckets:
1.Scale-driven – To build scale and accommodate the deployment of leading edge/future technological advancements by consolidating intra-basin assets.
2.Survival-driven – Portfolio repositioning into basins/plays which are lower on the cost curve, but would not necessarily build competitive scale.
Notably, early investor reaction to both Scale and Survival M&A appears to have been negative as investors appear to have taken a “show me” approach to ascribing M&A synergy/return enhancement credit. We believe investor focus on returns and capital efficient growth should gear the market more likely towards favoring Scale-driven M&A as opposed to Survival-driven M&A. We believe the Scale M&A CXO executed in 2018, which we view as strategically attractive, has yet to be fully appreciated by investors — we see demonstration of synergies on costs/corporate returns as a catalyst. Additionally, with larger global producers more focused on shale we view the E&Ps identified in our framework (CLR, COG, EOG, JAG, PE, PXD and XEC) as potential beneficiaries (Exhibit 48).
Oil macro: More M&A can likely drive lower growth from shale. US shale industry remaining highly fragmented. While the focus for management teams has shifted away from “growth” to “capital-efficient disciplined growth,” we continue to see less efficient development for the bulk of US producers that do not have “shale scale.” We believe greater M&A can lower the cost base of E&Ps and improve FCF/corporate returns while not necessarily accelerating production growth outlook. This can be positive for E&Ps while not being negative on the oil macro.
17 December 2018 |
41 |
vk.com/id446425943
Goldman Sachs
Americas Energy: Oil & Gas - E&P
Exhibit 45: Most major shale acquisitions appear to have been initially received negatively by investors, based on share price reaction
Corporate M&A transactions from covered E&Ps and relative performance vs. XOP
Buyers
Company - |
Company - |
Announcement |
Transaction |
Play |
Relative performance |
Relative performance |
Relative performance vs. |
Relative performance |
|
acquiring |
selling |
Date |
Value |
vs. XOP after 3 months |
vs. XOP after 6 months |
XOP after 12 months |
vs. XOP to date |
||
|
|||||||||
WLL |
KOG |
7/13/2014 |
$6,000 |
Bakken |
3% |
-20% |
-19% |
-28% |
|
ECA |
ATHL |
9/29/2014 |
$7,100 |
Permian Basin - Midland Basin |
-5% |
-17% |
-15% |
-14% |
|
NBL |
ROSE |
5/11/2015 |
$3,700 |
Eagle Ford Shale & Permian Basin |
-6% |
2% |
9% |
-11% |
|
RRC |
MRD |
5/16/2016 |
$4,146 |
Terryville gas field |
-16% |
-32% |
-46% |
-59% |
|
NBL |
CWEI |
1/16/2017 |
$2,600 |
Permian Basin - Delaware Basin |
4% |
-3% |
-12% |
-14% |
|
EQT |
RICE |
6/19/2017 |
$6,700 |
Appalachia - Marcellus/Utica Shale |
8% |
-16% |
-35% |
-31% |
|
CXO |
RSPP |
3/28/2018 |
$9,500 |
Permian Basin - Midland Basin, Delaware Basin |
-37% |
-29% |
NA |
-11% |
|
FANG |
EGN |
8/14/2018 |
$9,200 |
Permian Basin - Midland Basin, Delaware Basin |
-2% |
NA |
NA |
-2% |
|
DNR |
PVAC |
10/28/2018 |
$1,700 |
Eagle Ford Shale - DeWitt, Lavaca, Gonzales counties |
NA |
NA |
NA |
-33% |
|
CHK |
WRD |
10/30/2018 |
$3,980 |
Eagle Ford Shale/Austin Chalk |
NA |
NA |
NA |
-21% |
|
ECA |
NFX |
11/1/2018 |
$7,700 |
SCOOP/STACK, Uinta, Bakken |
NA |
NA |
NA |
-24% |
|
XEC |
REN |
11/19/2018 |
$1,600 |
Permian Basin - Delaware Basin |
NA |
NA |
NA |
-6% |
|
Total/ Average |
|
|
$63,926 |
|
-7% |
-16% |
-20% |
-21% |
Note: other factors may have affected performance; DNR-PVAC, CHK-WRD, ECA-NFX and XEC-REN does not include 3-month, 6-month and 12-month performance; FANG-EGN does not include 6-month and 12-month performance and CXO-RSPP does not include 12-month performance
Source: FactSet, Goldman Sachs Global Investment Research
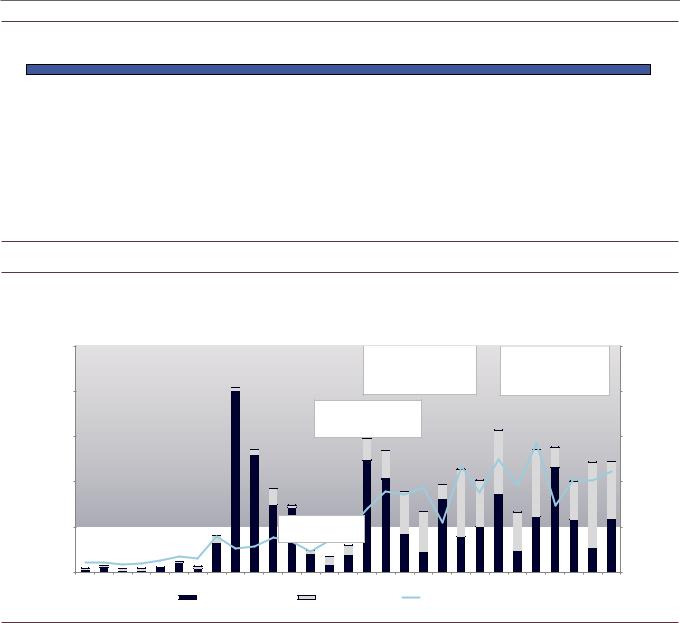
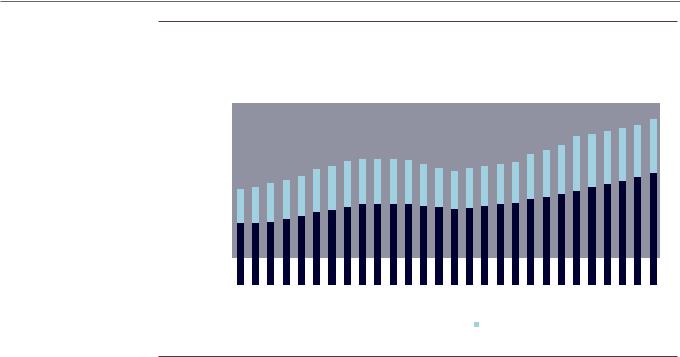
Exhibit 46: Total capital spent on M&A among E&Ps and integrated oils has been robust in recent years, but has largely been asset vs. corporate deals
Transaction value by year, $ bn (RHS); number of transactions (LHS); 2018 is YTD
250 |
|
|
|
|
|
250 |
|
|
2007-2010: Pick-up in |
|
|||
|
|
|
|
2011-Present: Oil shale |
||
|
1998-2000: Rise of |
|||||
|
|
natural gas-focused M&A; |
|
revolution - Bakken/Eagle |
||
|
the supermajors |
|
|
|||
|
|
rise in JV agreements |
|
Ford/Permian in focus |
||
|
|
|
|
|||
|
200 |
|
200 |
|
bn) |
|
2005-2007: |
|
|
|
Canada/GOM-focused |
|
||
($ |
|
|
||
|
transactions prevail |
|
||
transactions |
150 |
150 |
||
|
||||
100 |
|
100 |
||
Value of |
|
|||
|
|
|
||
|
50 |
2004: Rockies |
50 |
|
|
|
come into focus |
|
|
|
0 |
|
0 |
|
|
1990 1991 1992 1993 1994 1995 1996 1997 1998 1999 2000 2001 2002 2003 2004 2005 2006 2007 2008 2009 2010 2011 2012 2013 2014 2015 2016 2017 2018 |
|||
|
Value of corporate deals |
Value of asset deals |
Number of transactions |
|
Source: IHS, Goldman Sachs Global Investment Research
17 December 2018 |
42 |

vk.com/id446425943
Goldman Sachs
Americas Energy: Oil & Gas - E&P
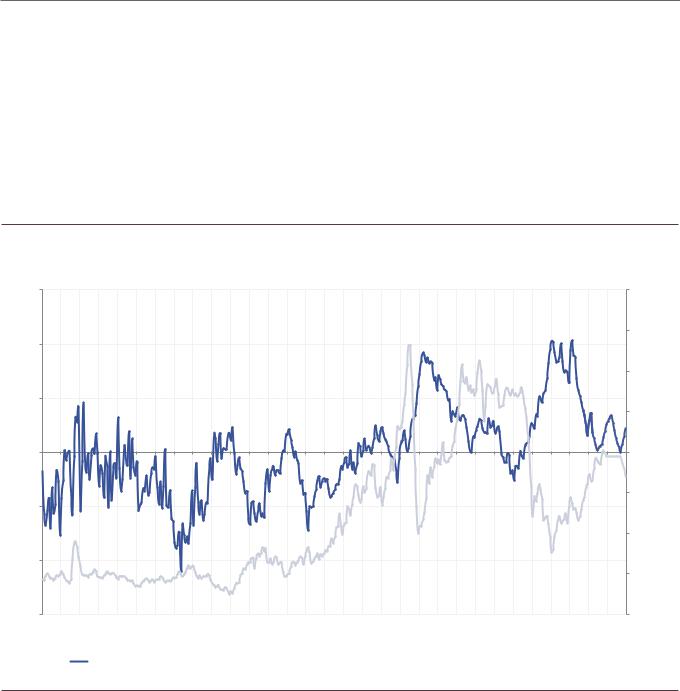
Exhibit 47: Since 2015, when the gap between corporate and asset M&A temporarily converged, we have again seen the number of asset-driven M&A deals outpace corporate transactions
Number of corporate and asset transactions by year, corporate transactions include both public and private
|
120 |
|
|
|
|
|
|
|
|
|
|
|
|
|
|
|
|
|
|
|
|
|
|
|
|
|
|
|
|
|
100 |
|
|
|
|
|
|
|
|
|
|
|
|
|
|
|
|
|
|
|
|
|
|
|
|
|
|
|
|
transactions |
80 |
|
|
|
|
|
|
|
|
|
|
|
|
|
|
|
|
|
|
|
|
|
|
|
|
|
|
|
|
60 |
|
|
|
|
|
|
|
|
|
|
|
|
|
|
|
|
|
|
|
|
|
|
|
|
|
|
|
|
|
Number of |
40 |
|
|
|
|
|
|
|
|
|
|
|
|
|
|
|
|
|
|
|
|
|
|
|
|
|
|
|
|
|
20 |
|
|
|
|
|
|
|
|
|
|
|
|
|
|
|
|
|
|
|
|
|
|
|
|
|
|
|
|
|
0 |
|
|
|
|
|
|
|
|
|
|
|
|
|
|
|
|
|
|
|
|
|
|
|
|
|
|
|
|
|
1990 |
1991 |
1992 |
1993 |
1994 |
1995 |
1996 |
1997 |
1998 |
1999 |
2000 |
2001 |
2002 |
2003 |
2004 |
2005 |
2006 |
2007 |
2008 |
2009 |
2010 |
2011 |
2012 |
2013 |
2014 |
2015 |
2016 |
2017 |
2018 |
|
|
|
|
|
|
|
|
|
|
|
|
Corporate |
|
|
Asset |
|
|
|
|
|
|
|
|
|
|
|
|
||
Source: IHS, Goldman Sachs Global Investment Research
Exhibit 48: Six companies stand out on our framework as having attractive M&A characteristics to potential buyers
M&A framework and potential consolidation candidates as updated on November 2, 2018 with “M&A returning: What will investors reward?” note; EOG and PXD are on the Conviction List
FRAMEWORK FOR POTENTIAL SELLERS
Shale Breakeven oil/gas price
Criteria
•Company average breakevens below $47/bbl WTI for oil-focused E&Ps
•Company average breakevens below $2/MMBtu HH for gasfocused E&Ps
Cash return on cash invested
Criteria
•Greater than 9.5% cash return on cash invested to potential buyer in 2020E
Resource life
Criteria
•Total company 2019E resource life screens above 36 year average for covered E&Ps
Limited bond leakage
Criteria
•Companies with change of control bond leakage of 5% or greater as a percent of EV (above HY Energy average)
CATEGORY STANDOUTS |
|
POTENTIAL E&P CONSOLIDATION |
||||
|
CANDIDATES |
|||||
|
|
|
|
|
|
|
APC |
|
FANG |
|
PXD |
|
Criteria |
BRY |
|
JAG |
|
REN |
|
|
|
|
|
Must be winners in all 4 buckets |
|||
COG |
|
NBL |
|
WPX |
|
|
|
|
|
|
|||
EOG |
|
PE |
|
XOG |
|
|
|
|
|
|
|
|
|
|
|
|
|
|
|
|
AMR |
COG |
EPE |
NBL |
RRC |
|
|
APA |
CRC |
EQT |
OAS |
REN |
|
CLR (Neutral) |
APC |
CRZO |
FANG |
OXY |
SWN |
|
|
AR |
CXO |
GPOR |
PDCE |
WLL |
|
COG (Neutral) |
JAG |
|
|||||
BRY |
DNR |
PE |
WPX |
|
EOG (Buy) |
|
LPI |
|
|||||
CLR |
ECR |
MRO |
PXD |
XOG |
|
JAG (Buy) |
CNX |
EOG |
MUR |
QEP |
|
|
PE (Buy) |
|
|
|
||||
APA |
CRC |
EOG |
LPI |
PE |
|
PXD (Buy) |
CLR |
EQT |
|
|
|||
CXO |
MUR |
PXD |
|
|
||
CNX |
HES |
|
|
|||
DVN |
OXY |
RRC |
|
|
||
COG |
JAG |
|
|
|||
|
|
|
|
|
||
|
|
|
|
|
|
|
|
|
|
|
|
|
|
|
|
EPE |
|
|
|
|
|
|
|
|
|
|
|
Source: Company data, Goldman Sachs Global Investment Research
17 December 2018 |
43 |

vk.com/id446425943
Goldman Sachs
Americas Energy: Oil & Gas - E&P
Oil macro: Neutral as the 3 Ds risk/reward less favorable in 2019
Datapoints on the 3 Ds – oil Demand, voluntary/involuntary Disruptions and US
producer Discipline – moved from constructive in 1H18 to cautious since
September. Over the past six months, we have seen negative datapoints on the 3 Ds:
n2Q18 global oil demand growth surprised to the downside — on a headline basis 0.5 mn bpd yoy vs. trend 1.2-1.3 mn bpd and our expectations for above trend demand; demand growth rebounded to 1.5 mn bpd in 3Q18.
n3Q18 US oil production surprised to the upside by about 0.3 mn bpd, largely in the Gulf of Mexico. In 2018, we expect US oil supply growth yoy of 1.6 mn bpd and an additional 0.6 million bpd of US NGLs growth.
nInvoluntary disruptions in 4Q18 have been less than expected, mainly on oil import waivers granted that have accommodated greater production from Iran.
Our base case in 2019 calls for modestly above-trend oil demand growth but warrants a meaningful deceleration in US supply growth and drop in OPEC supply to keep inventories balanced. Specifically, we believe yoy growth in US oil supply would need to be equally or more than offset by lower OPEC production vs. October 2018 levels. As we think US production is on track to grow 1.2 million bpd (at a near $65/bbl WTI oil price), we believe at least a 1.2 million bpd OPEC+ production cut vs. October 2018 levels (voluntarily or involuntarily) is needed. As such, we view the 1.2 million bpd
OPEC+ cut as in-line with our estimates, though this production level would need to be maintained through incremental involuntary disruptions or a continuation of OPEC+’s voluntary disruptions beyond six months.
2020 outlook may require additional OPEC+ cuts; Saudi supportive of shale growth... to a point. At the post meeting press conference, Khalid Al-Falih, Saudi Arabia’s Minister of Energy, Industry and Mineral Resources, indicated that he sees an environment where OPEC can co-exist with US shale even with US shale continuing to grow. However, the Ministry indicated that Saudi would have limitations on how much the country would cut before it would defend its market share. Overall, to balance the market in 2020 at trend demand growth, we believe we may need to see a further decrease of 0.5-0.6 million bpd in OPEC+ voluntary/involuntary disruptions. We see $60/bbl Brent oil in 2020.
If a meaningful deceleration in US supply growth is ultimately warranted, we
believe we would need to see sub-$50/bbl WTI prices. As we highlighted in our December 5 report “US production tracker: How oil (and gas) production could be impacted by lower oil prices,” we believe we would need WTI of ~$45/bbl for two years to reduce 2020 US oil production by 1.3 million bpd from our base case of combined 2.4 million bpd of growth in 2019-20. US oil production has surprised to the upside this year (driven during 3Q primarily by the Gulf of Mexico but also by the onshore), while producer leverage has fallen and producers appear on track to underspend cash flow. The result is that US oil production will not only enter 2019 at an elevated level, but
17 December 2018 |
44 |

vk.com/id446425943
Goldman Sachs
Americas Energy: Oil & Gas - E&P
producers are likely less sensitive to WTI oil prices than in 2015-17 when there was a greater need for deleveraging and a much greater funding gap.
nAt our base case price deck of $70/$60 per bbl Brent oil in 2019/20 (and a Brent-WTI differential of $5.50/bbl), we see US production growing about 1.2 million bpd annually (after growing around 1.6 million bpd in 2018E). We expect yoy capex from covered E&Ps (excluding gassy E&Ps) to be +6%/+2% in 2019/20.
nIn a sensitivity at $50/bbl Brent oil ($44.50/bbl WTI) in both years, we would see growth of around 0.7 million bpd in 2019 and 0.4 million bpd in 2019, for a cumulative loss of 1.3 million bpd of oil production vs. our base case. This assumes covered companies spend within cash flow (before dividends/distributions) on a weighted-average basis in both years. In addition to lower oil production, our sensitivity implies NGLs production for covered E&Ps would fall by about 0.2-0.3 million bpd in 2020 from our base case of combined 0.9 million of growth in 2019-20. We would expect yoy capex from covered E&Ps (excluding gassy E&Ps) to be -18%/+0% in 2019/20.
nIn a middle case of $60/bbl Brent oil ($54.40/bbl WTI) in both years, we would see US oil growth of around 1.0 million bpd annually in 2019-20, for a cumulative loss of 0.4 million bpd vs. our base case. In addition to lower oil production, our sensitivity implies NGLs production for covered E&Ps would fall by about 0.1 million bpd in 2020 vs. our base case. We would expect yoy capex from covered E&Ps (excluding gassy E&Ps) to be -2%/+6% in 2019/20.
Demand — in both the short term and long term — to be critical focus for equities.
Our expectations for 2018 oil demand has decelerated over the course of the year from 1.6 mn bpd to 1.3 mn, as IEA actuals lagged in the Middle East, Europe and Latin America relative to our initial expectations despite strong demand trends in the US and China. As we look into 2019, we forecast global oil demand growth of 1.4 mn bpd, predicated on global GDP of 3.5% (per our economists). We recognize this level is above trend growth of 1.2 million bpd, but we believe that it is reasonable in the context of easier price comparisons and our steady global economic growth forecast. We estimate that every 25 bps change to our GS economists global GDP assumption, impacts oil demand by 0.2 mn bpd. Within the refined product components of oil demand, we see gasoline margins likely weak in 1H19 as a result of high light oil consumption from refiners which tends to produce more gasoline, softening VMT trends, Asia margin weakness and seasonality.
As such, the key driver of crude demand will be to produce diesel/distillate, as refined product supports the industrial economy and as the downstream sector prepares for IMO 2020 rules. Aside from product demand, we assume continued purchases of Chinese crude continues into 2019, which along with the carry forward of “missing barrels” or unallocated net demand in 2018, should help to mitigate an excessive build of crude/product next year.
We believe demand trends are more important to equities and believe stock prices are likely to respond more favorably to inventory normalization/deficits created by strong global demand than by voluntary supply reductions.
17 December 2018 |
45 |
vk.com/id446425943
Goldman Sachs
Americas Energy: Oil & Gas - E&P
Long-term non-OPEC supply picture in itself more bullish for prices post 2020, but
demand once again is key. After 2020, we see a combination of deceleration in production growth from Top Projects with deceleration in US shale growth. This is still two years away, though we believe the underinvestment in global oil long lead time projects post 2014 in The Age of Restraint plus progression down The Road to Shale Tail will lead to meaningful deceleration in non-OPEC supply growth and decline in non-OPEC supply ex-shale. While this provides a favorable setup from a supply perspective, demand will remain critical in our view — our base case assumes deceleration that keeps markets from being undersupplied but also provides OPEC an opportunity to regain some market share.
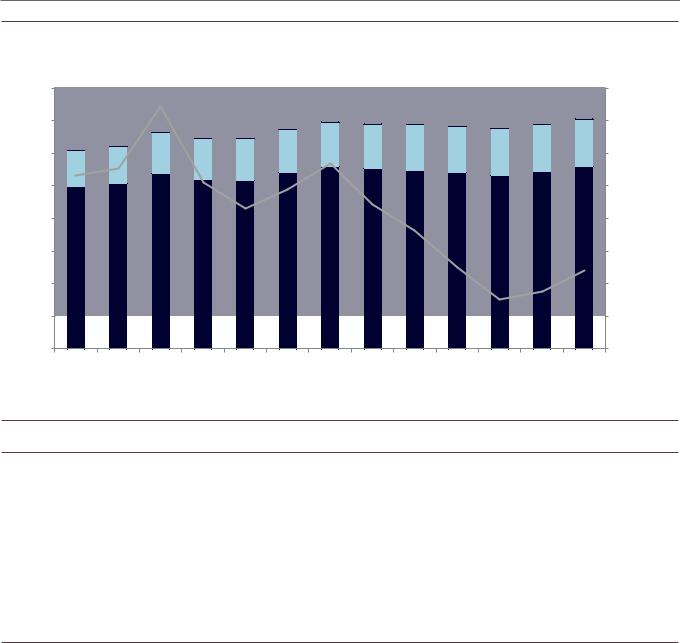
Exhibit 49: We expect to see inventory days of demand rise again before falling and largely staying around normal levels in 2H19, this assumes a 1.2 million bpd drop in OPEC + production on average in 2019 vs. October levels
OECD oil inventories in days of demand vs. the 5-year average (left axis); Brent prices, $/bbl (right axis)
Days of Demand
12 |
|
|
|
|
|
|
|
|
|
|
|
|
|
|
|
|
|
|
|
|
|
|
|
|
|
|
|
|
|
$160 |
|
|
|
|
|
|
|
|
|
|
|
|
|
|
|
|
|
|
|
|
|
|
|
|
|
|
|
|
|
|
$140 |
8 |
|
|
|
|
|
|
|
|
|
|
|
|
|
|
|
|
|
|
|
|
|
|
|
|
|
|
|
|
|
|
|
OECD Inventory Days of |
|
|
|
|
|
|
|
|
|
|
|
|
|
|
|
|
|
|
|
|
|
|
|
$120 |
|||||
|
Demand vs. 5-Year Average |
|
|
|
|
|
|
|
|
|
|
|
|
|
|
|
|
|
|
|
|
|
|
|
||||||
4 |
|
|
(Left Axis) |
|
|
|
|
|
|
|
|
|
|
|
|
|
|
|
|
|
|
|
|
|
|
|
|
|
||
|
|
|
|
|
|
|
|
|
|
|
|
|
|
|
|
|
|
|
|
|
|
|
|
|
|
|
|
|
|
|
|
|
|
|
|
|
|
|
|
|
|
|
|
|
|
|
|
|
|
|
|
|
|
|
|
|
|
|
|
|
$100 |
0 |
|
|
|
|
|
|
|
|
|
|
|
|
|
|
|
|
|
|
|
|
|
|
|
|
|
|
|
|
|
$80 |
|
|
|
|
|
|
|
|
|
|
|
|
|
|
|
|
|
|
|
|
|
|
|
|
|
|
|
|
|
|
$60 |
(4) |
|
|
|
|
|
|
|
|
|
|
|
|
|
|
|
|
|
|
|
|
|
|
|
|
|
|
|
|
|
|
|
|
|
|
|
|
|
|
|
|
|
|
|
|
|
|
|
|
|
|
|
|
|
|
|
|
|
|
|
|
$40 |
(8) |
|
|
|
|
|
|
|
|
|
|
|
|
|
|
|
|
|
|
|
|
|
|
|
|
|
|
|
|
|
|
|
|
|
|
|
|
|
|
|
|
|
|
|
|
|
|
|
|
|
|
|
|
|
|
|
|
|
|
|
|
$20 |
(12) |
|
|
|
|
|
|
|
|
|
|
|
|
|
|
|
|
|
|
|
|
|
|
|
|
|
|
|
|
|
$0 |
1989 |
1990 |
1991 |
1992 |
1993 |
1994 |
1995 |
1996 |
1997 |
1998 |
1999 |
2000 |
2001 |
2002 |
2003 |
2004 |
2005 |
2006 |
2007 |
2008 |
2009 |
2010 |
2011 |
2012 |
2013 |
2014 |
2015 |
2016 |
2017 |
2018E |
2019E |
($/bbl) Prices Brent
OECD Inventory Days of Demand vs. 5-Year Average (Left Axis) |
|
Brent Price Forecasts (Right Axis) |
|
Source: IEA, FactSet, Bloomberg, Goldman Sachs Global Investment Research
17 December 2018 |
46 |

vk.com/id446425943
Goldman Sachs
Americas Energy: Oil & Gas - E&P
Exhibit 50: We expect the US to grow oil production by 1.2 million bpd annually in 2019-20, offset by falling OPEC and deceleration in non-OPEC ex US growth post 2019
Yoy growth in oil supply-demand, million barrels per day
|
2013 |
2014 |
2015 |
2016 |
2017 |
2018E |
2019E |
2020E |
2021E |
2022E |
|
3Q18 |
Supply growth |
|
|
|
|
|
|
|
|
|
|
|
|
US oil |
1.0 |
1.2 |
0.7 |
(0.7) |
0.5 |
1.6 |
1.2 |
1.2 |
0.8 |
0.4 |
2.0 |
|
Non-OPEC ex US |
0.3 |
0.8 |
0.5 |
(0.2) |
0.1 |
0.2 |
0.2 |
0.3 |
(0.5) |
(0.6) |
0.4 |
|
OPEC |
(1.0) |
0.0 |
1.3 |
1.1 |
(0.4) |
(0.2) |
(0.4) |
(0.3) |
(0.0) |
0.1 |
(0.3) |
|
US/Saudi NGLs |
0.2 |
0.5 |
0.4 |
0.2 |
0.3 |
0.6 |
0.5 |
0.6 |
0.4 |
0.4 |
0.7 |
|
Total supply |
0.5 |
2.5 |
2.8 |
0.5 |
0.5 |
2.3 |
1.5 |
1.7 |
0.6 |
0.3 |
|
2.8 |
Demand growth |
|
|
|
|
|
|
|
|
|
|
|
|
Reported |
1.8 |
1.3 |
2.2 |
1.1 |
1.5 |
1.3 |
1.4 |
1.2 |
1.1 |
1.0 |
1.5 |
|
Other implied (a) |
(0.9) |
0.6 |
0.2 |
0.1 |
(0.6) |
0.5 |
0.2 |
0.0 |
0.0 |
0.0 |
0.5 |
|
Total |
0.9 |
1.9 |
2.5 |
1.2 |
1.0 |
1.8 |
1.6 |
1.2 |
1.1 |
1.0 |
|
2.0 |
Net OECD inventory build (draw) |
(0.2) |
0.4 |
0.8 |
0.0 |
(0.4) |
0.1 |
0.0 |
0.5 |
0.5 |
0.5 |
0.6 |
|
(a) Change in non-OECD inventory build, SPR build, other to balance
Source: IEA, Goldman Sachs Global Investment Research
Exhibit 51: We assume modestly above trend oil demand growth in 2019 — we believe demand outlook (short and long term) is particularly key for equities
Oil demand summary, million bpd
|
|
|
|
|
|
|
|
|
|
|
|
2018E |
|
|
|
|
2019E |
|
||
|
2013 |
2014 |
2015 |
2016 |
2017 |
2018E |
2019E |
2020E |
|
1Q |
2Q |
|
3Q |
4QE |
|
1QE |
2QE |
|
3QE |
4QE |
YOY demand growth, mn bpd |
|
|
|
|
|
|
|
|
|
|
|
|
|
|
|
|
|
|
|
|
US |
0.5 |
0.1 |
0.4 |
0.2 |
0.3 |
0.5 |
0.2 |
0.0 |
0.7 |
0.3 |
0.7 |
0.3 |
0.2 |
0.2 |
0.2 |
0.2 |
||||
Europe |
(0.2) |
(0.1) |
0.3 |
0.2 |
0.3 |
0.0 |
0.1 |
0.0 |
0.2 |
(0.1) |
(0.1) |
0.1 |
0.1 |
0.1 |
0.1 |
0.1 |
||||
China |
0.6 |
0.4 |
0.8 |
0.4 |
0.6 |
0.5 |
0.4 |
0.4 |
0.3 |
0.1 |
0.8 |
0.6 |
0.4 |
0.4 |
0.4 |
0.4 |
||||
India |
0.0 |
0.2 |
0.4 |
0.2 |
0.1 |
0.2 |
0.2 |
0.3 |
0.4 |
0.2 |
0.2 |
0.2 |
0.2 |
0.3 |
0.2 |
0.3 |
||||
Other Asia |
0.1 |
(0.1) |
0.2 |
0.3 |
0.2 |
0.1 |
0.2 |
0.2 |
0.2 |
0.2 |
(0.2) |
0.1 |
0.2 |
0.2 |
0.2 |
0.2 |
||||
Middle East/Africa |
0.6 |
0.4 |
0.2 |
0.0 |
0.0 |
(0.2) |
0.2 |
0.2 |
(0.2) |
(0.2) |
(0.1) |
(0.1) |
0.2 |
0.2 |
0.2 |
0.2 |
||||
Latin America |
0.1 |
0.1 |
(0.1) |
(0.2) |
(0.1) |
(0.1) |
0.0 |
0.1 |
(0.0) |
(0.1) |
(0.1) |
(0.0) |
0.0 |
0.1 |
0.0 |
0.0 |
||||
FSU |
0.2 |
0.3 |
(0.0) |
(0.1) |
0.0 |
0.2 |
0.1 |
0.1 |
0.2 |
0.1 |
0.2 |
0.2 |
0.1 |
0.1 |
0.1 |
0.1 |
||||
Other |
(0.0) |
(0.0) |
0.0 |
0.0 |
(0.0) |
(0.0) |
0.0 |
0.0 |
(0.1) |
(0.0) |
(0.0) |
(0.0) |
0.0 |
0.0 |
0.0 |
0.0 |
||||
Total demand growth |
1.8 |
1.3 |
2.2 |
1.1 |
1.5 |
1.3 |
1.4 |
1.2 |
|
1.7 |
0.5 |
1.5 |
1.4 |
|
1.3 |
1.5 |
1.4 |
1.4 |
||
Source: IEA, Goldman Sachs Global Investment Research
17 December 2018 |
47 |
vk.com/id446425943
Goldman Sachs
Americas Energy: Oil & Gas - E&P
Exhibit 52: OPEC’s market share has fallen to below 2014 levels
OPEC liquids production, mn bpd (primary axis), OPEC oil supply as a % of global demand (secondary axis)
|
45 |
36.0% |
|
production, mn bpd |
40 |
35.3% |
% a as supply oil OPEC |
35 |
34.5% |
||
30 |
33.8% |
||
25 |
33.0% |
||
|
|
||
OPEC liquids |
20 |
32.3% |
demand global of |
15 |
31.5% |
||
10 |
30.8% |
||
|
5 |
30.0% |
|
2010 |
2011 |
2012 |
2013 |
2014 |
2015 |
2016 |
2017 |
2018E |
2019E |
2020E |
2021E |
2022E |
||||
|
Total OPEC Oil Supply |
|
Total OPEC |
NGL Supply |
|
|
OPEC oil supply as a % of global demand |
|||||||||
|
|
|
|
|||||||||||||
|
|
|||||||||||||||
Source: IEA, Goldman Sachs Global Investment Research
Exhibit 53: We assume a combination of voluntary/involuntary disruptions in 2019E in OPEC-producing countries to drive 1.0 mn bpd of annual declines vs. October 2018 levels; we believe this along with select non-OPEC country cuts are needed to balance inventories
OPEC supply by country (million barrels per day)
|
2013 |
2014 |
2015 |
2016 |
2017 |
2018E |
2019E |
2020E |
2021E |
2022E |
|
Oct 18 |
OPEC supply (million bpd) |
|
|
|
|
|
|
|
|
|
|
|
|
Saudi Arabia |
9.4 |
9.5 |
10.1 |
10.4 |
10.0 |
10.3 |
10.4 |
10.5 |
10.7 |
10.8 |
10.7 |
|
Iraq |
3.1 |
3.3 |
4.0 |
4.4 |
4.5 |
4.6 |
4.8 |
4.7 |
4.7 |
4.8 |
4.7 |
|
Iran |
2.7 |
2.8 |
2.8 |
3.6 |
3.8 |
3.6 |
2.6 |
2.6 |
3.1 |
3.6 |
3.3 |
|
UAE |
2.8 |
2.8 |
2.9 |
3.0 |
2.9 |
3.0 |
3.1 |
3.1 |
3.1 |
3.2 |
3.2 |
|
Venezuela |
2.5 |
2.5 |
2.5 |
2.2 |
2.0 |
1.3 |
1.0 |
0.8 |
0.8 |
0.9 |
1.3 |
|
Neutral zone |
0.5 |
0.4 |
0.1 |
0.0 |
0.0 |
0.0 |
0.1 |
0.2 |
0.2 |
0.2 |
0.0 |
|
Other OPEC |
10.1 |
9.6 |
9.6 |
9.3 |
9.5 |
9.7 |
10.0 |
9.7 |
9.7 |
9.7 |
9.9 |
|
Total OPEC |
31.0 |
30.9 |
32.1 |
33.0 |
32.6 |
32.4 |
32.0 |
31.7 |
32.2 |
33.0 |
|
33.0 |
Source: IEA, Goldman Sachs Global Investment Research
17 December 2018 |
48 |
vk.com/id446425943
Goldman Sachs
Americas Energy: Oil & Gas - E&P
Exhibit 54: Our bottom-up sensitivity of US oil production to oil prices in 2019 and 2020 suggests 0.6/1.0/1.3 mn bpd of growth at WTI prices of ~$45/$55/$65 per bbl vs. 1.2 million bpd of annual growth at our base case of ~$65/$55 WTI
US oil supply, mn bpd, at various oil prices with efficiency gains (LHS); WTI oil price, $/bbl (RHS); assumes $5.50/bbl Brent-WTI differential
|
14 |
|
|
|
|
|
|
|
$120 |
|
|
13 |
|
|
|
|
|
|
|
$110 |
|
|
12 |
$97.96 |
|
|
|
|
|
|
$100 |
|
|
$94.16 |
|
$93.13 |
|
|
|
|
|
|
WTI |
b/d |
11 |
|
|
|
|
|
|
|
$90 |
|
production, mn |
10 |
|
|
|
|
|
|
|
$80 |
($/bbl) price oil |
9 |
|
|
|
|
|
$67.49 |
|
$70 |
||
|
|
|
|
|
|
|
|
|
||
Oil |
8 |
|
|
|
|
|
|
|
$60 |
|
|
|
|
|
|
|
|
|
|
||
|
7 |
|
|
$48.71 |
|
$50.81 |
|
|
$50 |
|
|
|
|
|
$43.24 |
|
|
|
|
||
|
|
|
|
|
|
|
|
|
|
|
|
6 |
|
|
|
|
|
|
|
$40 |
|
|
2012 |
2013 |
2014 |
2015 |
2016 |
2017 |
2018E |
2019E |
2020E |
|
|
$44.50 scenario |
|
$54.50 scenario |
Base case |
$64.50 scenario |
|
||||
Source: IEA, Company data, Goldman Sachs Global Investment Research
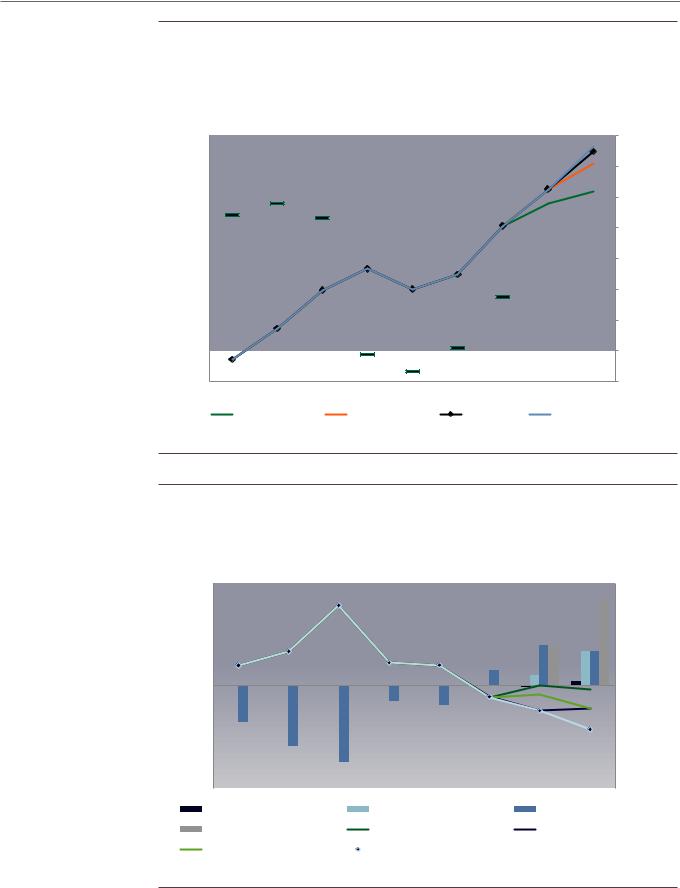
Exhibit 55: In our sensitivity at ~$45/bbl WTI oil in 2019/20, we see cash flow in line with capex pre-dividends and distributions
Historical reinvestment rate (capex/cash flow) and expectations at various WTI oil price scenarios (assumes
Brent-WTI in 2019-20 of $5.50/bbl) |
|
|
|
|
|
|
|
|
30 |
|
|
|
|
|
|
160% |
|
20 |
|
|
|
|
|
|
140% |
|
10 |
|
|
|
|
|
|
120% |
(%) rate Reinvestment |
0 |
|
|
|
|
|
|
100% |
|
(10) |
|
|
|
|
|
|
80% |
|
Fundinggapbn)($ |
|
|
|
|
|
|
60% |
|
(20) |
|
|
|
|
|
|
|
|
(30) |
|
|
|
|
|
|
40% |
|
2013 |
2014 |
2015 |
2016 |
2017 |
2018E |
2019E |
2020E |
|
$44.50 scenario |
|
|
$54.50 scenario |
|
Base case |
|
||
$64.50 scenario |
|
|
$44.50 reinvestment rate |
|
Base case reinvestment rate |
|||
$54.50 reinvestment rate |
|
$64.50 reinvestment rate |
|
Source: Company data, Goldman Sachs Global Investment Research
17 December 2018 |
49 |
vk.com/id446425943
Goldman Sachs
Americas Energy: Oil & Gas - E&P
Exhibit 56: We continue to assume strong growth from the US over the next year, with upside risk if producers outside our coverage grow at similar rates as in 2018
US oil production, million bpd
US oil production, million bpd
14.0 |
|
|
|
|
|
|
|
|
|
|
|
|
|
|
|
|
|
|
|
|
|
|
|
|
|
|
|
|
|
|
|
|
|
|
|
|
|
|
|
|
|
|
|
|
|
|
|
|
|
|
|
|
|
|
|
|
|
|
|
12.0 |
|
|
|
|
|
|
|
|
|
|
|
|
|
|
|
|
|
|
|
|
|
|
|
|
|
|
|
|
|
10.0 |
|
|
|
|
|
|
|
|
|
|
|
|
|
|
|
|
|
|
|
|
|
|
|
4.1 |
4.1 |
4.1 |
4.0 |
4.0 |
4.2 |
|
|
|
|
|
|
|
|
|
|
|
|
|
|
|
|
|
|
|
|
|
|
3.6 |
3.7 |
|
|
|
|
||
8.0 |
|
|
|
|
|
|
|
3.5 |
3.4 |
3.5 |
3.4 |
3.3 |
3.1 |
3.0 |
|
|
3.0 |
3.0 |
3.1 |
3.4 |
|
|
|
|
|
|
|||
|
|
|
|
|
3.2 |
3.3 |
2.9 |
3.0 |
|
|
|
|
|
|
|
|
|
||||||||||||
|
|
|
|
2.9 |
3.0 |
|
|
|
|
|
|
|
|
|
|||||||||||||||
6.0 |
2.6 |
2.7 |
2.9 |
|
|
|
|
|
|
|
|
|
|
|
|
|
|
|
|
|
|
|
|
|
|
|
|
||
4.0 |
|
|
|
|
|
|
|
|
|
6.2 |
6.2 |
6.3 |
6.2 |
6.2 |
|
|
|
6.1 |
6.3 |
6.3 |
6.7 |
6.8 |
7.0 |
7.3 |
7.6 |
7.8 |
8.0 |
8.4 |
8.6 |
|
|
|
|
5.1 |
5.3 |
5.7 |
5.8 |
6.1 |
6.0 |
5.9 |
6.0 |
|
|
|
|
||||||||||||||
2.0 |
4.8 |
4.8 |
4.9 |
|
|
|
|
|
|
|
|
|
|||||||||||||||||
|
|
|
|
|
|
|
|
|
|
|
|
|
|
|
|
|
|
|
|
|
|
|
|
||||||
|
|
|
|
|
|
|
|
|
|
|
|
|
|
|
|
|
|
|
|
|
|
|
|
|
|
|
|
|
|
0.0 |
|
|
|
|
|
|
|
|
|
|
|
|
|
|
|
|
|
|
|
|
|
|
|
|
|
|
|
|
|
1Q13 |
2Q13 |
3Q13 |
4Q13 |
1Q14 |
2Q14 |
3Q14 |
|
4Q14 |
1Q15 |
2Q15 |
3Q15 |
4Q15 |
1Q16 |
2Q16 |
3Q16 |
4Q16 |
1Q17 |
2Q17 |
3Q17 |
4Q17 |
1Q18 |
2Q18 |
3Q18 |
4Q18E |
1Q19E |
2Q19E |
3Q19E |
4Q19E |
|
|
|
||||||||||||||||||||||||||||
|
|
|
|
|
|
|
|
|
US E&P/integrated oil coverage |
|
Other |
|
|
|
|
|
|
|
|
|
|
||||||||
|
|
|
|
|
|
|
|
|
|
|
|
|
|
|
|
|
|
|
|
||||||||||
Source: Company data, Goldman Sachs Global Investment Research
17 December 2018 |
50 |