

GS Americas Energy. Oil Gas - E P. 2019 Outlook_watermark
.pdfvk.com/id446425943
Goldman Sachs
Americas Energy: Oil & Gas - E&P
evolution), we believe there is increased discussion particularly regarding large-cap E&Ps to encourage managements to demonstrate more market-competitive free cash flow yield by slowing growth. In our view, over time we believe we will see rising investor calls for E&P FCF until, at a minimum, aggregate US oil growth is not deemed a threat to global oil prices. We believe this potential pivot could be important to E&Ps as generating positive FCF should increase flexibility for return of capital (debt paydown, dividends and/or equity repurchases) and bolt-on acquisitions (if they help improve scale of legacy assets) rather than a sole focus on pulling forward volume growth. This increased flexibility will also raise the importance of E&P managements’ role as capital allocators and should drive increased focus on per share production growth metrics. Net/net, until broad-based FCF visibility improves we expect investors to remain anchored to legacy valuation methodologies (EV/EBITDA, EV/DACF and NAV). However, we believe investors should increasingly monitor FCF yield trends to identify E&Ps with an attractive combination of volume/FCF growth (CXO, EOG, FANG, PE and PXD) opportunities for lower growth/high FCF E&Ps to unlock shareholder value (BRY, COG
and OXY).
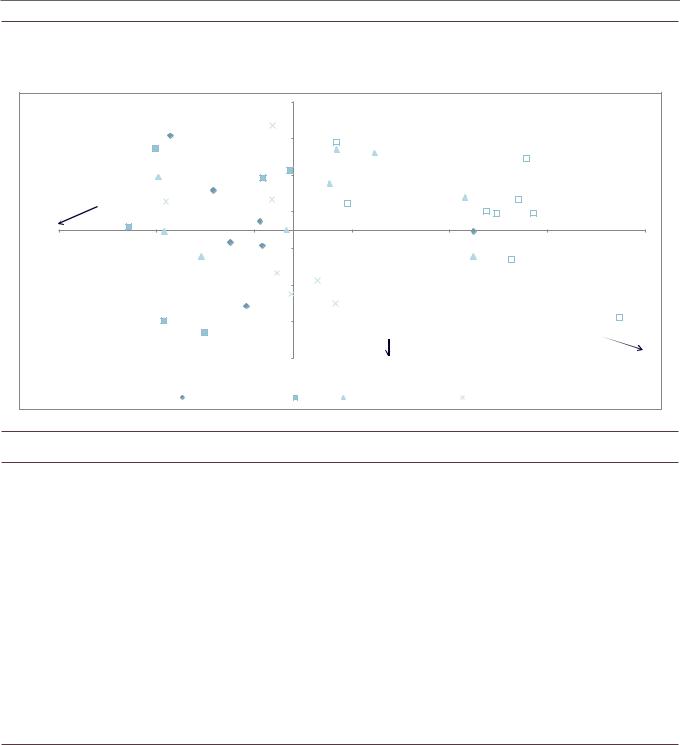
Exhibit 20: We believe COG/EOG/FANG/BRY have a favorable combination of FCF yield, incremental returns and resource potential, which should differentiate these E&Ps even in a rising risk commodity price environment
Average 2019E-21N consolidated FCF yield (after for dividends paid to minority shareholders that consolidate public midstream companies) on y-axis; average 2019E-21N incremental CROCI; size of the bubbles represents total estimated resource potential (that have positive value at our base case commodity prices) at the end of 2019 divided by 2020E production; white bubbles are those E&Ps with negative FCF yields; red bubbles denote companies with Buy rating
2019E-21E average CROCI
25% |
High absolute returns |
|
|
|
|
|
|
|
|
|
High absolute returns |
|
|
|
|
|
|
|
JAG |
|
|
|
|
||
|
Low incremental returns |
|
|
|
|
|
|
|
|
High incremental returns |
|
|
|
|
|
|
|
|
|
COG |
|
|
|
|
|
20% |
|
|
|
|
|
|
|
|
|
|
|
|
|
|
|
|
|
|
PDCE |
|
XOG |
FANG |
BRY |
|
|
|
|
|
|
|
|
|
|
|
|
|||
15% |
|
|
|
|
CLR |
|
PE |
|
|
WPX |
|
|
|
|
|
|
|
|
|
|
|
|
|
||
|
|
|
|
|
|
EOG |
PXD |
|
REN |
|
|
|
|
|
|
|
|
|
|
|
|
|
|
|
|
|
|
|
|
AR |
CRZO |
OAS |
|
CXO AMR |
|
|
|
|
10% |
OXY |
EPE |
WLL |
APC |
|
|
NBL |
|
|
|||
|
GPOR |
QEP |
|
|
|
|
EQT (68%, 9%) |
|
||||
|
|
CNX |
MRO |
APA |
XEC NFX |
RRC |
|
|
|
|
|
|
|
|
|
|
|
|
|
|
|||||
|
LPI |
|
|
|
|
|
|
|
||||
|
|
HES |
ECR |
MUR |
|
|
|
|
|
|
|
|
|
DVN |
|
|
|
|
|
ECA |
|
|
|
||
5% |
SWN |
|
|
|
|
|
|
|
|
|
|
|
CRC |
|
|
CHK |
|
|
|
|
|
|
|
||
|
DNR |
|
|
|
|
|
|
|
|
|
||
|
|
|
|
|
|
|
|
|
|
|
|
|
|
Low absolute returns |
|
|
|
|
|
|
|
|
|
Low absolute returns |
|
|
Low incremental returns |
|
|
|
|
|
|
|
|
High incremental returns |
|
|
0% |
|
|
|
|
|
|
|
|
|
|
|
|
-10% |
-5% |
0% |
5% |
|
10% |
15% |
|
20% |
25% |
|
30% |
35% |
2019E-21E average incremental CROCI
Oily E&P |
Gassy E&P |
Gas to liquids transitional E&Ps |
International/diversified E&Ps |
Source: Company data, Goldman Sachs Global Investment Research
17 December 2018 |
21 |
vk.com/id446425943
Goldman Sachs
Americas Energy: Oil & Gas - E&P
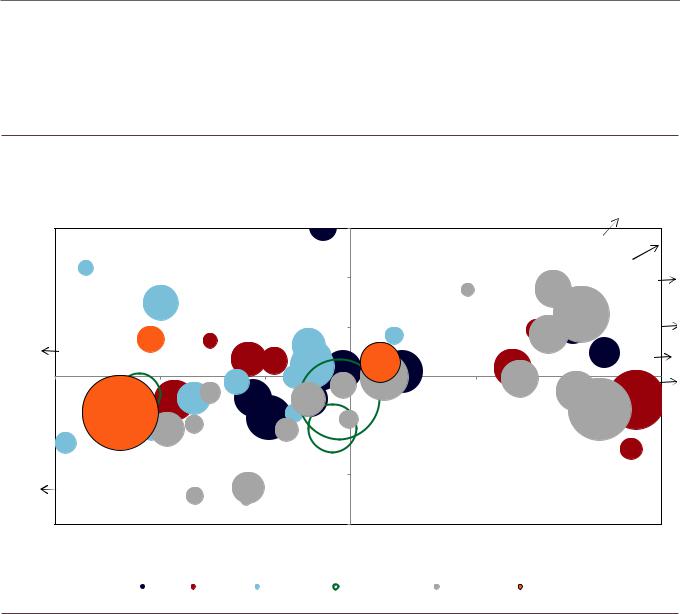
Exhibit 21: We believe FANG/CXO/COG among pure-plays and EOG among diversifieds offer an attractive combination of growth and free cash flow through 2021
Average 2019E-2021E free cash flow yield on y-axis; 2020E-2021E Production CAGR on x-axis
2019E-21N FCF Yield
8%
6%
4%
2%
0%
-2%
-4%
COG
OXY
WLL
OAS
QEP |
MRO |
PDCE |
|
||
EQT |
|
RRC |
CRC: (-1%, 1%) |
|
APC |
|
|
|
DVN |
|
NFX |
DNR |
MUR |
APA |
|
|
|
|
CHK |
GPOR |
|
|
|
|
|
CNX |
EPE |
|
HES |
|
LPI |
|
Median: |
|
|
|
|
|
|
|
|
|
|
|
|
|
|
|
|
|
|
|
|
|
|
|
|
12% |
BRY |
|
|
|
|
|
|
|
|
|
|
|
|
|
|
|
|
|
|
|||||
|
|
|
|
|
|
EOG |
|
|
|
|
|
|
|
XOG |
||||||||||
|
|
|
|
|
|
|
|
|
|
|
|
|||||||||||||
|
|
|
ECA |
|
|
|
|
|
|
|
||||||||||||||
|
|
|
|
|
|
|
|
|
|
|
|
|
|
|
|
|
|
|
|
|
||||
|
WPX |
|
|
|
|
|
|
|
|
|
|
|
|
|
|
|
|
|
|
|||||
|
|
|
|
|
CLR |
CRZO |
|
|
|
|
|
FANG |
||||||||||||
|
|
|
|
|
CXO |
|
|
|
|
|
|
|
|
|
PE |
|||||||||
|
|
|
|
|
|
|
|
|
|
|
|
|
|
|
|
|
|
|
|
|
|
|
|
|
|
|
|
|
|
|
|
|
|
|
PXD |
|
|
|
|
|
|
|
|
Median: 1% |
|||||
|
|
|
|
|
|
|
|
|
|
|
|
|
|
|
|
|
|
|
|
|
||||
|
|
|
|
|
|
|
NBL |
|
|
|
|
|
|
|
|
|
|
|
|
|
|
|
||
|
|
|
|
|
XEC |
|
|
|
|
|
|
|
||||||||||||
|
|
|
|
|
|
|
|
|
|
|
|
|||||||||||||
|
AR |
|
|
|
REN |
|||||||||||||||||||
|
SWN |
|
|
|
|
|
|
|
|
|
|
|
|
|
|
JAG |
||||||||
|
|
|
|
|
|
|
|
|
|
|
|
|
|
|
|
|
|
|
|
|
||||
|
|
|
|
|
|
|
|
|
|
|
|
|
|
|
|
|
|
|
|
|
|
|
||
|
|
|
|
|
|
|
|
|
|
|
|
|
|
|
|
|
|
|
|
|
|
|
|
|
|
|
|
|
|
|
|
|
|
|
|
|
|
|
|
|
|
|
|
|
|
||||
|
|
|
|
|
|
|
|
|
|
|
|
|
|
|
|
|
|
|
|
AMR: (31%, -12%) |
|
|||
|
|
|
|
|
|
ECR: (22%, -12%) |
|
|
|
|
|
|
|
|
|
|
|
|
||||||
|
|
|
|
|
|
|
|
|
|
|
|
|
|
|
|
|
|
|
|
|
|
|
|
|
|
|
|
|
|
|
|
|
|
|
|
|
|
|
|
|
|
|
|
|
|
|
|
|
|
-6%
0% |
5% |
10% |
|
15% |
20% |
25% |
30% |
|
|
|
2020E-21N Production CAGR |
|
|
|
|
|
|
International/diversified E&Ps |
Oily E&P |
Gas to liquids transitional E&Ps |
Gassy E&P |
|
|
Source: Company data, Goldman Sachs Global Investment Research
Exhibit 22: Returning cash to shareholders was not a blanket theme for outperformance vs. the XOP in 2018, though some of this was due to share repurchase from cash flow streams that were temporary (asset sale-driven)
Absolute and relative stock performance of E&Ps who have announced share repurchases or dividend increases
|
|
|
|
|
|
Share repurchase authorization |
|
Expected dividend increase |
|
|
Stock performance |
|
|||
Company |
Day of |
Share |
Shares |
Market |
|
Old |
New |
% of |
|
Old |
New |
|
Performance vs. XOP |
Performance vs. |
Absolute |
announcement |
price |
outstanding |
cap |
|
$mn |
$mn |
market cap. |
|
dividend/share |
dividend/share |
|
post announcement |
XOP since |
performance since |
|
|
|
12/14/2018 |
mn |
$mn |
|
|
|
|
|
|
|
|
|
|
|
APC* |
2/6/2018 |
$50.79 |
531 |
$26,959 |
|
$2,500 |
$4,000 |
14.8% |
$0.20 |
$1.00 |
5% |
5% |
(11%) |
||
COG* |
2/23/2018 |
$23.40 |
463 |
$10,823 |
|
$720 |
$1,215 |
11.2% |
$0.06 |
$0.07 |
(0%) |
11% |
(2%) |
||
ECA |
2/15/2018 |
$5.83 |
973 |
$5,668 |
|
- |
$400 |
7.1% |
- |
- |
(2%) |
(34%) |
(48%) |
||
EOG |
2/27/2018 |
$99.27 |
580 |
$57,576 |
|
- |
- |
- |
$0.67 |
$0.74 |
(2%) |
8% |
(6%) |
||
FANG |
2/13/2018 |
$92.13 |
98 |
$9,063 |
|
- |
- |
- |
$0.00 |
$0.50 |
3% |
(8%) |
(19%) |
||
GPOR* |
2/21/2018 |
$8.65 |
183 |
$1,584 |
|
$100 |
$200 |
12.6% |
- |
- |
12% |
14% |
2% |
||
LPI |
2/14/2018 |
$3.96 |
241 |
$953 |
|
- |
$200 |
21.0% |
- |
- |
5% |
(36%) |
(50%) |
||
NBL |
2/15/2018 |
$21.78 |
492 |
$10,706 |
|
- |
$750 |
7.0% |
$0.40 |
$0.44 |
(1%) |
(3%) |
(18%) |
||
PXD |
2/6/2018 |
$136.95 |
172 |
$23,519 |
|
- |
$100 |
0.4% |
$0.08 |
$0.32 |
4% |
(5%) |
(21%) |
||
XEC |
2/23/2018 |
$68.23 |
95 |
$6,514 |
|
- |
- |
- |
$0.08 |
$0.16 |
1% |
(14%) |
(28%) |
||
QEP |
2/28/2018 |
$6.96 |
241 |
$1,676 |
|
- |
$1,250 |
74.6% |
- |
- |
10% |
(7%) |
(19%) |
||
HES* |
3/8/2018 |
$50.59 |
314 |
$15,890 |
|
$500 |
$1,500 |
9.4% |
- |
- |
1% |
24% |
10% |
||
SU* |
3/2/2018 |
$29.40 |
1641 |
$48,245 |
|
$1,400 |
$2,000 |
4.1% |
$1.28 |
$1.44 |
(5%) |
7% |
(6%) |
||
COP* |
2/1/2018 |
$64.38 |
1221 |
$78,610 |
|
$1,500 |
$3,000 |
3.8% |
$1.06 |
$1.14 |
0% |
31% |
10% |
||
DVN* |
3/7/2018 |
$25.84 |
521 |
$13,457 |
|
$1,000 |
$4,000 |
29.7% |
$0.24 |
$0.32 |
5% |
(2%) |
(17%) |
||
EQT* |
7/26/2018 |
$19.39 |
264 |
$5,125 |
|
$39 |
$539 |
10.5% |
- |
- |
(2%) |
(33%) |
(65%) |
||
CXO |
10/30/2018 |
$115.32 |
149 |
$17,151 |
|
- |
- |
- |
$0.00 |
$0.50 |
0% |
2% |
(15%) |
||
XOG |
11/19/2018 |
$4.88 |
172 |
$840 |
|
- |
$100 |
11.9% |
- |
- |
4% |
(13%) |
(29%) |
||
BRY |
12/13/2018 |
$10.40 |
81 |
$846 |
|
|
$50 |
5.9% |
- |
- |
3% |
3% |
(2%) |
||
PXD |
12/13/2018 |
$136.95 |
172 |
$23,519 |
|
|
$2,000 |
8.5% |
- |
- |
3% |
3% |
(1%) |
||
|
|
|
|
|
|
|
|
|
|
|
|
|
|
|
|
E&P average |
|
|
|
|
|
|
|
|
|
|
|
2% |
(2%) |
(17%) |
|
E&P median |
|
|
|
|
|
|
|
|
|
|
|
2% |
0% |
(16%) |
|
* E&Ps which have announced repurchases and subsequently raised the buyback; stock performance based on initial repurchase announcement
Source: FactSet, Company data, Goldman Sachs Global Investment Research
17 December 2018 |
22 |

vk.com/id446425943
Goldman Sachs
Americas Energy: Oil & Gas - E&P
Key indicator 4: Resource base improvement/degradation
Expect a 4th D (Depletion) to be increasingly top of mind. While we continue to believe that the 3 D’s (global demand growth, supply disruptions and US producer discipline) will be main drivers of oil prices in the near-term, over time, we expect Depletion will become a key theme (not just in shale). We believe the theme of Depletion came into focus during 2018 as some incremental (and less favorable) datapoints around decelerating productivity gains and downward inventory revisions for select producers spurred investor concerns that we may have already seen the best from shale.
We may be seeing initial signs of depletion; 2019 productivity/inventory
datapoints key. As shale plays and producers move further into the Execution and Efficiency phase, remaining inventory levels will naturally get revised lower as more of the wells are developed/brought online. Prior to 2018, productivity/efficiency gains allowed producers to replace/add to high quality inventory levels. During 2018, we saw early signs of maturity from inventory revisions, notably from companies such as EOG, which revised down its Eagle Ford premium locations by 125 as wells drilled exceeded new locations added. The level of core Permian inventory remains a major area of investor debate. As many companies move towards field development/tighter spacing, we expect questions around well performance degradation and inventory depletion to remain topical among investors.
Where do we see productivity improving?
Following a year of strong productivity improvements in 2017, 2018 data thus far (through June/July) would suggest a slowdown in yoy productivity improvements, particularly on a lateral-length adjusted basis. While we see scope for productivity gains to continue through 2020 (we assume 3%-10% per year by play for US shale plays), we believe they may become increasingly concentrated among higher quality operators/those with scale. As a result, we think greater emphasis will be placed on differentiated productivity trends by company, which can ultimately drive upward revisions to resource bases and/or those E&Ps which can effectively lower secular well costs.
Where can well costs come down in 2019?
We note that well productivity improvement is not the sole driver of improved corporate metrics (such as lower F&D costs). As such, we view E&P ability to lower secular well cost as another important factor. Moving into 2019, we highlight EOG, OXY and PXD as we believe their position as scale winners as well as company-specific cost saving initiatives can help drive down D&C costs in 2019. At a macro level we believe the ramp-up of Permian in-basin sand mine capacity will be a deflationary tailwind for the group which could lower well costs in the Permian by c. 3%-5%.
nEOG: In our recent meetings with management in Asia, the company noted it was optimistic in its ability to lower well costs based on a combination of efficiencies/attractive service contracts.
17 December 2018 |
23 |
vk.com/id446425943
Goldman Sachs
Americas Energy: Oil & Gas - E&P
nOXY: We highlight OXY’s Aventine logistics hub in New Mexico — we see potential for further well cost savings in 2019 as the facility ramps up.
nPXD: We see scope for cost improvement from greater completion efficiencies (announced with 3Q results) and from its recent-announced long-term sand supply agreement with US Silica.
Exhibit 23: Based on 2018 data so far, we highlight CXO/DVN/XEC/XOM for improved well performance yoy and EOG/OXY/MRO/DVN/WPX for absolute well performance in several key US shale plays
2018 3-month oil IP rates (bbls/d) adjusted for 1K foot of lateral (x-axis) vs. yoy improvement in productivity 2018 vs. 2017 (y-axis); bubble size is based on number of wells drilled in 2018 as a percent of total wells drilled in the play this year
Yoy improvement in productivity 2018 vs. 2017
60% |
|
|
|
|
|
XOM |
|
|
|
|
QEP Bakken |
|
|
|
|
|
|
|
|
|
|
|
|||
|
|
|
|
|
|
|
|
|
|
|
(162, 128%) |
|
|
EPE |
|
|
|
|
|
|
|
|
|
|
DVN EFS |
40% |
|
|
|
|
|
|
|
|
|
|
(282, 57%) |
|
|
|
|
|
|
|
|
|
|
|
DVN |
XOM Delaware |
|
|
|
|
|
|
|
|
|
|
|
OAS |
||
|
|
|
|
XOM |
|
|
|
|
|
|
(157, 53%) |
|
|
|
XOM |
|
|
|
|
|
|
|
CXO |
||
|
|
|
|
|
|
|
|
|
|
|
|
|
20% |
|
|
|
|
|
|
|
|
|
MUR |
|
DNR Bakken (17 |
|
XOG |
COP |
|
CXO |
|
FANG |
WPX |
14%) |
||||
|
|
|
|
XEC |
|
|||||||
|
WLL DJ Basin |
|
CRZO |
|
ECA |
|
|
|
MRO |
|||
|
|
|
EPE |
|
|
|
MRO |
|
||||
|
(33, 15%) |
|
|
WLL |
NBL |
CLR |
|
|||||
|
|
|
|
|
|
|
|
|
||||
0% |
|
|
|
|
APA |
PXD |
|
|
|
|
|
|
|
|
|
PE |
|
|
|
WPX |
|
COP - EFS |
|||
|
|
|
|
|
NFX |
APC |
|
|
||||
|
PDCE |
CHK |
CRZO |
HES |
CVXJAG |
|
|
OXY |
(196,-5%) |
|||
|
|
CHK QEP |
OAS |
EOG |
|
|
|
EOG |
||||
|
|
|
COP CVX |
|
|
|
||||||
-20% |
APC |
|
PE |
|
|
PDCE |
|
|
|
|
EOG |
|
LPI |
OXY APA |
|
REN |
DVN |
|
|
|
|
|
|
||
|
|
|
COP |
|
|
|
|
|
|
|
ECA |
|
|
|
|
|
|
|
|
|
|
|
|
||
|
|
|
|
|
|
|
|
|
|
|
|
|
-40% |
COP Midland |
|
|
NBL |
|
|
|
|
|
|
|
|
|
|
MRO |
|
|
|
|
|
|
|
|
||
|
(35, -42%) |
|
COP |
|
|
|
|
|
|
|
||
|
|
|
|
|
|
|
|
|
|
|
||
-60% |
40 |
60 |
|
|
80 |
|
|
100 |
|
120 |
140 |
|
|
|
|
|
|
|
|||||||
3-month oil IP rates (bbls/d) adjusted for 1K foot of lateral
Bakken |
Eagle Ford |
Midland Basin |
Powder River Basin |
Delaware Basin |
DJ Basin |
Source: IHS, Goldman Sachs Global Investment Research.
17 December 2018 |
24 |
vk.com/id446425943
Goldman Sachs
Americas Energy: Oil & Gas - E&P
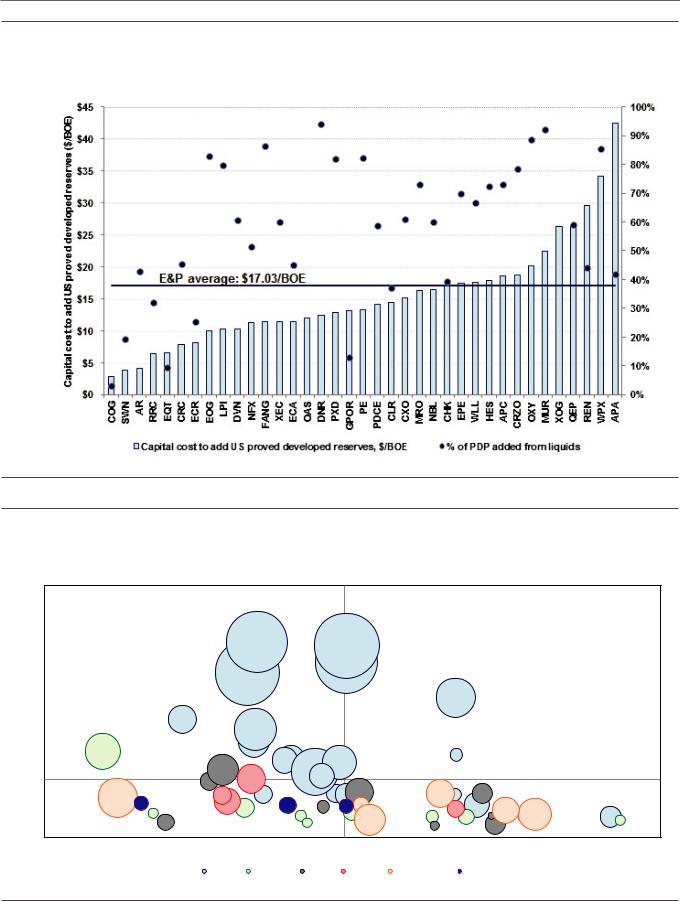
Exhibit 24: Among non-gassy E&Ps, we have seen low F&D costs for CRC, EOG, LPI; EOG is best positioned balance sheet wise for strip oil prices
Weighted average proved developed F&D 2015-17, $/BOE
Source: Company 10-K filings, Goldman Sachs Global Investment Research
Exhibit 25: Resource longevity and positioning on the cost curve are key to sustaining capital-efficient growth with inflection to FCF; we believe this is supportive of PXD, CXO, EOG and OXY
WTI breakevens for coverage in key shale plays vs. oil production growth (thousand bpd) in the basin; size of circle based on estimated resource size
Mb/d,2017 |
325 |
|
275 |
||
|
||
2020 vs. |
225 |
|
|
||
growth |
175 |
|
productionoil |
125 |
|
|
||
Cumulative |
75 |
|
25 |
||
|
||
|
-25 |
$30
|
|
|
EOG |
|
|
CXO |
|
|
|
|
|
|
|
|
|
|
|
|
|
|
|
|
|
|
|
|
|
|
|
|
|
PXD |
|
|
|
OXY |
|
|
|
|
|
|
|
|
|
|
|
|
|
|
|
|
|
APA |
|
|
|
|
|
|
FANG |
|
APC |
|
|
|
|
|
|
|
|
|
|
|
|
|
PE |
|
|
|
|
|
|
|
|
|
|
|
|
EOG |
|
|
|
NBL |
DVN |
|
|
|
OAS |
|
|
|
|
|
|
|
CLR |
|
XEC |
|
|
|
|
|
|
|
|||
|
|
|
ECA |
|
|
|
|
|
|
|
|
|
||
|
|
|
WPX |
|
|
|
|
|
|
|
|
|
||
|
|
APC |
|
HES |
|
|
|
|
|
|
|
|
||
|
MRO |
|
|
NFX |
|
OAS |
|
|
|
|
||||
|
|
|
|
|
|
|
|
|
|
|||||
CLR EOG |
|
XOG |
QEP |
JAG MRO |
|
CRZO |
|
|
|
|
||||
|
|
|
|
|
|
|
||||||||
|
NBL MRO |
DVN |
WPX CHK AMR |
CRZO |
PDCE LPI |
|
DVN |
MRO |
EPE |
|||||
ECA |
|
|
|
CHK |
MUR |
|
|
|
|
NFX |
|
|||
EOG |
|
|
|
|
DVN |
XEC |
|
QEP |
EPE |
|
WLL |
WLL |
NBL |
|
|
|
|
|
|
|
|
|
|
|
|||||
|
|
|
|
|
|
|
|
|
|
|
|
|||
$35 |
|
$40 |
|
|
$45 |
|
$50 |
|
|
$55 |
|
$60 |
$65 |
|
|
|
|
|
|
WTI breakeven price ($/bbl) |
|
|
|
|
|
|
|
||
|
|
Permian |
Eagle Ford |
Bakken |
DJ Basin |
STACK/SCOOP |
PRB |
|
|
|
|
|||
Source: Company data, Goldman Sachs Global Investment Research
17 December 2018 |
25 |

vk.com/id446425943
Goldman Sachs
Americas Energy: Oil & Gas - E&P
Exhibit 26: We see upcoming catalysts both on/offshore in 2019 for several E&Ps, where favorable resource updates/results could drive upside to resource credit
E&Ps with upcoming on/offshore catalysts where development/resource credit is already ongoing (note: this is not an inclusive list of ongoing development projects for E&P coverage and is based on several areas we believe are key areas of focus for producers/investors alike)
|
Company |
Ongoing development / |
near- |
|
GS resource |
Percent of |
Next catalyst |
|
|
|
term start-up |
|
|
credit |
total target |
|
|
|
|
|
|
|
|
|
|
|
|
|
|
|
|
|
|
Oil: further testing of oily Wolfcamp/Bone Spring zones |
|
|
APA |
Alpine High |
|
|
$9.00 |
23% |
NGLs: Start-up of new cryogenic facilities in April 2019, which can |
|
|
|
|
allow NGL ramp-up |
|
||||
|
|
|
|
|
|
|
Natural gas: new pipelines will limit exposure to local Permian |
|
|
|
|
|
|
|
|
prices in 2H19 |
|
|
APC |
Mozambique LNG |
|
|
$6.00 |
8% |
FID expected in 1H19 |
|
|
|
|
|
|
|
|
|
|
|
|
|
|
|
|
|
Turner formation continues to be key near-term focus, while a 6th |
|
|
CHK |
Powder River Basin |
|
|
NA |
NA |
rig directed at the Parkman/Niobrara/Mowry could be added in |
|
|
|
|
|
|
|
|
2019 |
|
|
|
|
|
|
|
|
|
|
|
|
|
|
|
|
|
CNX expects to deliver first production 17 Utica wells across its |
|
|
CNX |
Utica - Pennsylvania |
|
|
$0 |
0% |
SW PA and Central PA operating areas in 2019. Successful well |
|
|
|
|
production rates/improved capital costs could drive positive Street |
|
||||
|
|
|
|
|
|
|
|
|
|
|
|
|
|
|
|
NAV revisions. |
|
|
|
|
|
|
|
|
|
|
|
DVN |
Powder River Basin |
|
|
$5.00 |
16% |
Ongoing Niobrara exploration (initial wells flowing back); expect to |
|
|
|
|
run up to 4 rigs in 2019 |
|
||||
|
|
|
|
|
|
|
|
|
|
ECA |
Graben area (Eagle Ford) |
$0 |
0% |
3 wells drilled in 2018; testing additional opportunities in order to |
|
||
|
determine potential for premium inventory |
|
||||||
|
|
|
|
|
|
|
|
|
|
|
|
|
|
|
|
|
|
|
|
Powder River Basin, Woodford Oil |
|
|
Identified Mowry and Niobrara premium locations during 2018; |
|
||
|
EOG |
$19.00 |
14% |
continue development in Mid-Con/Permian to determine extent of |
|
|||
|
and 1st Bone Spring |
|
|
|
||||
|
|
|
|
|
|
premium inventory |
|
|
|
|
|
|
|
|
|
|
|
|
EPE |
Northeastern Utah (NEU) - |
$0 |
0% |
First 2 wells completed in 3Q18; samples to assess future hz |
|
||
|
horizontal development |
|
|
development across entire acreage position planned for 4Q18 |
|
|||
|
|
|
|
|
|
|
||
|
|
|
|
|
|
|
|
|
|
HES |
Guyana |
|
|
$30.75 |
48% |
Liza phase 1 startup expects first oil by early 2020; Phase 2 by mid- |
|
|
|
|
2022 and Phase 3 in 2023 |
|
||||
|
|
|
|
|
|
|
|
|
|
|
|
|
|
|
|
JAG holds 30k net acres in NW Pecos Co. (TX) which investors |
|
|
JAG |
Big Tex |
|
|
$0.25 |
2% |
view as "fringe" given limited aerial delineation / production history. |
|
|
|
|
Strong delineation well results and/or a joint-venture agreement |
|
||||
|
|
|
|
|
|
|
|
|
|
|
|
|
|
|
|
(which JAG is pursuing) could drive positive Street NAV revisions. |
|
|
|
|
|
|
|
|
|
|
|
NBL |
Leviathan and Tamar |
|
|
$5.00 |
16% |
Leviathan Phase I start-up by year-end 2019; potential for Phase 2 |
|
|
|
|
and/or Tamar expansion thereafter |
|
||||
|
|
|
|
|
|
|
|
|
|
|
|
|
|
|
|
Acceleration of Permian well results/volume growth and |
|
|
OAS |
Permian |
|
|
$1.25 |
15% |
downspacing/delineation pilot results could drive greater investor |
|
|
(Delaware Basin) |
|
|
appreciation of OAS’s inventory depth potentially warranting an |
|
|||
|
|
|
|
|
|
|
||
|
|
|
|
|
|
|
EV/EBITDA multiple re-rate. |
|
|
|
|
|
|
|
|
|
|
|
|
|
|
|
||||
Source: Company data, Goldman Sachs Global Investment Research |
|
|
|
|
||||
17 December 2018 |
26 |

vk.com/id446425943
Goldman Sachs
Americas Energy: Oil & Gas - E&P
Exhibit 27: Guyana, Suriname and US onshore key areas of exploratory focus
Ongoing exploration efforts by E&P and key upcoming catalysts (note: this is a list of select key areas of exploration for covered companies, though is not exhaustive of all exploration opportunities across E&P portfolios)
|
Company |
Exploration area(s) |
Next catalyst |
|
|
|
|
|
|
|
|
|
|
|
|
APA |
Suriname |
Initiating exploratory drilling on Block 58 |
|
|
APC |
Gulf of Mexico and Colombia |
GOM: Developing lease blocks added since 2017 |
|
|
Colombia: In process of securing funding partners |
|
||
|
|
|
|
|
|
|
|
|
|
|
COG |
"Exploratory area #2" |
Will continue on 2nd exploratory effort in 2019 |
|
|
HES |
Guyana/Suriname |
Tilapia-1 prospect expected to spud next in Guyana; exploration |
|
|
wells in the Walker prospect in Suriname planned for 2019 |
|
||
|
|
|
|
|
|
|
|
|
|
|
MRO |
Louisiana Austin Chalk |
First well spud in 3Q18; results expected in 2019 |
|
|
|
|
GOM: Spud King Cake prospect in 4Q18; awarded Highgarden |
|
|
|
Gulf of Mexico, Vietnam and |
prospect |
|
|
MUR |
Vietnam: LDT prospect expected spud in 1Q19 |
|
|
|
Mexico, Brazil |
|
||
|
|
Mexico: Cholula prospect expected spud in 1Q19 |
|
|
|
|
|
|
|
|
|
|
Brazil: acquired 3D seismic data |
|
|
|
|
|
|
|
|
Newfoundland, Gabon and E. |
Newfoundland: Interpretation of prospects ongoing |
|
|
NBL |
Gabon: Processing 3D seismic data |
|
|
|
Mediterranean |
|
||
|
|
Eastern Mediterranean: Deep oil potential |
|
|
|
|
|
|
|
|
|
|||
Source: Company data, Goldman Sachs Global Investment Research |
|
|||
17 December 2018 |
27 |

vk.com/id446425943
Goldman Sachs
Americas Energy: Oil & Gas - E&P
Top stock debates into 2019
Can PXD get through 2019 without a perceived execution issue or increased capital budget?
Bottom line: We believe the Street expectation for PXD’s 2019 growth/capex outlook has overshadowed PXD’s underlying low-cost Permian asset base. We believe the risk-reward is skewed to the upside and see potential for 22% Permian oil growth in 2019 at capex of $4.0 bn. We are Buy rated with shares on the CL.
Street remains concerned regarding PXD’s 2019 outlook; however, we believe the Street is underappreciating growth potential. We believe investors are concerned 2019 production/capex guidance could be unfavorable vs. Street expectations and have little confidence in potential beat-raise given 2018 capex guidance upward revisions over the course of the year. Specifically on capex, investors are concerned that capex in 2019 could be well above $4.0 bn — we assume $4.0 bn capital spend in 2019, in line with consensus. We see room for slight improvement in capital efficiency from greater completion efficiencies (highlighted with 3Q results) and a newly announced long-term sand supply agreement with US Silica. We believe investors are not fully considering higher production response from three factors:
1.Greater rig activity — PXD is currently operating 22 rigs with 2 rigs expected to be added in December.
2.Version 3.0+ completions — PXD plans to complete 60 v3.0+ wells in 2H18; management indicated that v3.0+ wells are outperforming the type curve by 35%. We see potential for more Version 3.0+ wells to drilled in 2019 which can drive upside to consensus oil production forecasts.
3.PXD’s well performance should continue to benefit from wider base case spacing due in part to PXD’s large contiguous acreage position in the Midland Basin.
Our estimate for FY19 oil production growth of 19% is 2% above consensus.
Upside to 2019 consensus estimates. Beyond upside to consensus production estimates, we see strong margins aided by greater than 90% of Permian oil receiving Gulf Coast (Brent-linked) pricing and the remaining priced off of WTI. Our estimates for EBITDA assuming consensus commodity prices are 15% above consensus. Using strip prices, our 2019 EBITDA estimates would be only 6% below consensus vs. 19% below consensus on average for non-gassy E&Ps.
17 December 2018 |
28 |
vk.com/id446425943
Goldman Sachs
Americas Energy: Oil & Gas - E&P
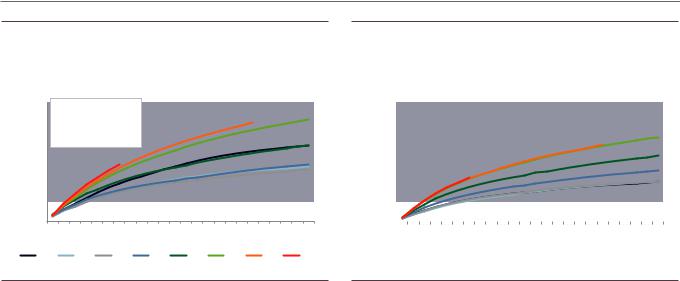
Exhibit 28: PXD wells in 2018 are tracking 7% above 2017 wells ...
PXD Midland Basin cumulative production adjusted for lateral length
laterals |
30 |
Lateral adj. production |
|
|
|
|
|
|
||||||
25 |
2017 vs. 2016: |
+8% |
|
|
|
|
|
|
|
|||||
|
|
|
|
|
|
|
|
|||||||
|
2018 vs. 2017: +7% thus |
|
|
|
|
|
|
|||||||
for |
|
|
|
|
|
|
|
|||||||
20 |
far |
|
|
|
|
|
|
|
|
|
|
|
|
|
adjusted |
|
|
|
|
|
|
|
|
|
|
|
|
|
|
15 |
|
|
|
|
|
|
|
|
|
|
|
|
|
|
bbls |
|
|
|
|
|
|
|
|
|
|
|
|
|
|
10 |
|
|
|
|
|
|
|
|
|
|
|
|
|
|
Cumulative |
|
|
|
|
|
|
|
|
|
|
|
|
|
|
5 |
|
|
|
|
|
|
|
|
|
|
|
|
|
|
|
|
|
|
|
|
|
|
|
|
|
|
|
|
|
|
0 |
|
|
|
|
|
|
|
|
|
|
|
|
|
|
1 |
2 |
3 |
4 |
5 |
6 |
7 |
8 |
9 |
10 11 12 13 14 15 16 17 18 19 20 21 22 23 24 |
||||
|
|
|
|
|
|
|
|
|
|
|
Month |
|
|
|
|
2011 |
|
2012 |
|
|
2013 |
|
|
2014 |
2015 |
2016 |
2017 |
2018 |
|
Source: IHS, Goldman Sachs Global Investment Research
Exhibit 29: ... tracking above the industry average on absolute and on rate of improvement
Industry Midland Basin cumulative production adjusted for lateral length
lateralsfor |
30 |
|
|
|
|
|
|
|
|
|
|
|
|
|
|
|
|
|
|
|
|
|
|
|
|
|
|
|
|
2018 vs. 2017: +1% to 2% |
|
|
|
|
|
|
|
|
|
|
|
||||||||||||||
|
|
|
|
|
Lateral adj. production |
|
|
|
|
|
|
|
|
|
|
|
|
||||||||||
|
25 |
|
|
2017 vs. 2016: |
+1% |
|
|
|
|
|
|
|
|
|
|
|
|
|
|
||||||||
|
|
|
|
|
|
|
|
|
|
|
|
|
|
|
|
|
|
|
|
|
|
|
|
|
|
||
adjusted |
20 |
|
|
thus far |
|
|
|
|
|
|
|
|
|
|
|
|
|
|
|
|
|
|
|
||||
15 |
|
|
|
|
|
|
|
|
|
|
|
|
|
|
|
|
|
|
|
|
|
|
|
|
|
||
|
|
|
|
|
|
|
|
|
|
|
|
|
|
|
|
|
|
|
|
|
|
|
|
|
|||
bbls |
|
|
|
|
|
|
|
|
|
|
|
|
|
|
|
|
|
|
|
|
|
|
|
|
|
||
10 |
|
|
|
|
|
|
|
|
|
|
|
|
|
|
|
|
|
|
|
|
|
|
|
|
|
||
Cumulative |
|
|
|
|
|
|
|
|
|
|
|
|
|
|
|
|
|
|
|
|
|
|
|
|
|
||
5 |
|
|
|
|
|
|
|
|
|
|
|
|
|
|
|
|
|
|
|
|
|
|
|
|
|
||
|
|
|
|
|
|
|
|
|
|
|
|
|
|
|
|
|
|
|
|
|
|
|
|
|
|
||
|
0 |
|
|
|
|
|
|
|
|
|
|
|
|
|
|
|
|
|
|
|
|
|
|
|
|
|
|
|
1 |
2 |
3 |
4 |
5 |
6 |
7 |
8 |
|
9 |
10 11 12 13 14 15 16 17 18 19 20 21 22 23 24 |
|
|||||||||||||||
|
|
|
|
|
|
|
|
|
|
|
|
|
|
|
|
|
|
Month |
|
|
|
|
|
|
|
||
|
|
2011 |
|
|
|
2012 |
|
|
|
2013 |
|
|
|
2014 |
|
|
2015 |
|
2016 |
|
2017 |
|
2018 |
||||
|
|
|
|
|
|
|
|
|
|
|
|
|
|
|
|||||||||||||
Source: IHS, Goldman Sachs Global Investment Research
What will the Street care about more for EOG — headline 90-day well productivity stats or financial results?
Bottom line: While productivity improvements may decelerate on the margin, we believe EOG’s ability to translate cost reductions and absolute productivity rate leadership to lower F&D costs and improved margins should ultimately be a more meaningful driver for shares via EBITDA and FCF beats. We are Buy rated with shares on the CL.
Investor concern over well productivity degradation for EOG has risen. In the past year, we have seen increased scrutiny of EOG’s well productivity (particularly in the Permian) where the company still screens as a peer leader on absolute well rates, though on the margin saw lower annual improvements in productivity relative to its peers/play average. We note that this dynamic can be attributed to EOG’s increased focus on tighter spacing in order to maximize NPV per section vs. sole focus on single well returns, which resulted in some degradation of well performance vs. prior years. However, we believe EOG should continue to screen as a leader on an absolute well productivity basis given its technology leadership/innovation. The company expects that the ongoing transition to development mode in the Delaware Basin should help improve well performance into 2019 both because there will be fewer parent wells as comps and due to high grading to core acreage. As detailed below, we also see potential for well costs to fall.
However, we believe EOG’s improving financials should ultimately be a more
important driver of shares, with cash margins and capital costs underappreciated.
We believe EOG screens uniquely relative to peers on several key financial metrics that should help drive outperformance moving forward. In particular, see several areas of financial differentiation that can drive upside to shares:
1.F&D costs can come down. We believe EOG can lower the capital cost to add reserves, through both productivity gains and lower well costs. At our recent meetings with management in Asia, management noted it was optimistic in its
17 December 2018 |
29 |
vk.com/id446425943
Goldman Sachs
Americas Energy: Oil & Gas - E&P
ability to lower well costs in 2019 based on a combination of efficiencies/attractive service contracts. EOG also indicated that with additional innovation (management is particularly optimistic on unspecified improvements in completion processes being tested) can turn non-premium drilling locations into premium locations.
2.Intense focus on corporate returns and FCF. Management’s focus on corporate returns and increasing free cash flow creates a favorable alignment with investors even though the company has not prioritized share repurchase. We see EOG with an 6% FCF yield in 2019E (vs. 1% for peers). However, at strip prices we would expect lower FCF but still would expect differentiation vs. peers.
3.Upside to 2019 consensus estimates. At consensus commodity prices, we continue to believe FactSet consensus EBITDA estimates for 2019 are too low — our estimates for EBITDA assuming consensus commodity prices are 13% above consensus. However, at strip prices we would see less EBITDA differentiation as EOG is more exposed to 2019 oil prices vs. peers.
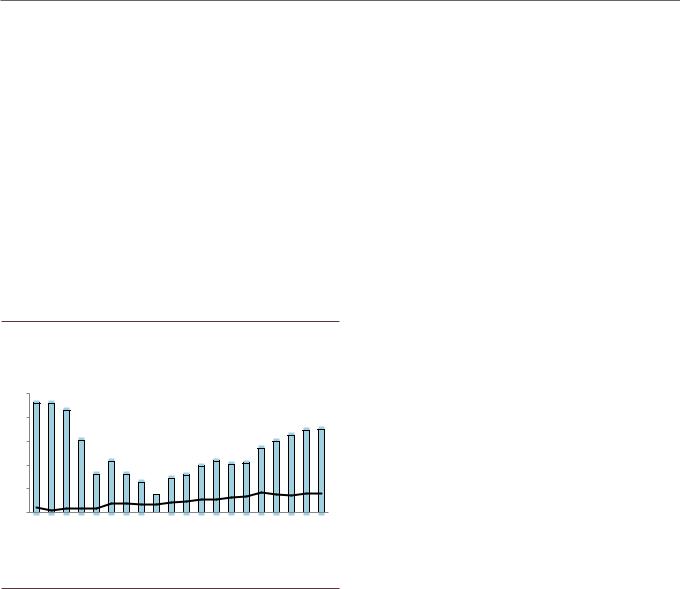
Exhibit 30: EOG has improved its EBITDA per BOE by $8 unrelated to commodity prices
EBITDA margin improvement; $/BOE
$50 |
|
|
|
|
|
|
|
|
|
|
|
|
|
|
|
|
|
|
|
$40 |
|
|
|
|
|
|
|
|
|
|
|
|
|
|
|
|
|
|
|
$30 |
|
|
|
|
|
|
|
|
|
|
|
|
|
|
|
|
|
|
|
$20 |
|
|
|
|
|
|
|
|
|
|
|
|
|
|
|
|
|
|
|
$10 |
|
|
|
|
|
|
|
|
|
|
|
|
|
|
|
|
|
|
|
$0 |
|
|
|
|
|
|
|
|
|
|
|
|
|
|
|
|
|
|
|
1Q 2014 |
2Q 2014 |
3Q 2014 |
4Q 2014 |
1Q 2015 |
2Q 2015 |
3Q 2015 |
4Q 2015 |
1Q 2016 |
2Q 2016 |
3Q 2016 |
4Q 2016 |
1Q 2017 |
2Q 2017 |
3Q 2017 |
4Q 2017 |
1Q 2018 |
2Q 2018 |
3Q 2018 |
4Q 2018E |
|
|
|
EBITDA per BOE |
|
EOG-driven cumulative margin improvement |
|
|
|
|
Source: Company data, Goldman Sachs Global Investment Research
17 December 2018 |
30 |