

GS Americas Energy. Oil Gas - E P. 2019 Outlook_watermark
.pdfvk.com/id446425943
Goldman Sachs
Americas Energy: Oil & Gas - E&P
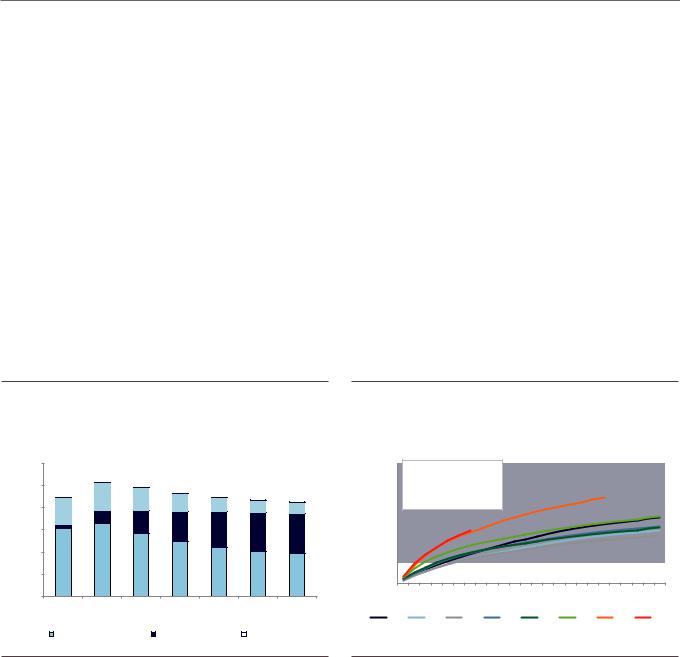
Exhibit 31: EOG has either met or beaten the high end of its production guidance in 12 of the past 15 quarters, though production has been closer to the top end of the range (vs. above) for the past year
EOG US oil production guidance (Mb/d) vs. actual
Historical EOG US oil production guidance (Mb/d)
|
Low |
Average |
High |
|
Actual |
% above |
% above |
|
Production |
|
|
mid-point |
high-point |
|
growth % |
||||
|
|
|
|
|
|
|
|||
1Q15 |
287 |
292 |
297 |
299 |
2% |
1% |
-1% |
||
2Q15 |
264 |
269 |
274 |
277 |
3% |
1% |
-7% |
||
3Q15 |
269 |
273 |
277 |
278 |
2% |
0% |
1% |
||
4Q15 |
274 |
277 |
280 |
280 |
1% |
0% |
1% |
||
1Q16 |
255 |
260 |
265 |
266 |
2% |
0% |
-5% |
||
2Q16 |
255 |
260 |
265 |
265 |
2% |
0% |
0% |
||
3Q16 |
264 |
268 |
272 |
276 |
3% |
1% |
4% |
||
4Q16 |
290 |
295 |
300 |
306 |
4% |
2% |
11% |
||
1Q17 |
300 |
305 |
310 |
313 |
2% |
1% |
2% |
||
2Q17 |
322 |
327 |
332 |
333 |
2% |
0% |
7% |
||
3Q17* |
320 |
325 |
330 |
327 |
1% |
-1% |
3% |
||
4Q17 |
362 |
366 |
370 |
367 |
0% |
-1% |
8% |
||
1Q18 |
350 |
355 |
360 |
360 |
1% |
0% |
-2% |
||
2Q18 |
374 |
378 |
382 |
379 |
0% |
-1% |
5% |
||
3Q18 |
401 |
405 |
409 |
409 |
1% |
0% |
8% |
||
*Adjusted for 15K bpd of US oil production impact from Hurricane Harvey
Source: Company data, Goldman Sachs Global Investment Research
What’s more important for OXY and CXO — Permian differentials or upstream productivity/efficiency gains?
Bottom line: We believe ability/confidence in differentiated capital-efficient production growth from OXY/CXO’s unique resource base in the Permian Basin will be more important than differentials for both OXY and CXO. We believe that expected 2H19/FY2020 narrowing of Permian differentials has been a headwind for OXY and that Permian efficiency can be a positive catalyst for OXY by raising FCF expectations. We are Buy rated on OXY (shares on CL) and CXO.
Permian differentials to likely have minimal impact on shale-scale Permian producers. As discussed in our Temporary EPIC pipeline conversion to reduce extent of ‘19 Permian oversupply note, we see 0.1-0.3 mn bpd of oversupply in the basin in 1H2019 ahead of debottlenecking via pipelines in 2H2019. Ultimately, we believe the oversupply is likely to be solved via three factors: (1) trucks, based on widening of differentials to the Gulf Coast; (2) some deferral of new wells from producers to 2H19 (which is likely to be a bit more clear as 2019 guidance); and (b) utilization of local Permian oil inventories. We believe the local oversupply will prove temporary.
nOXY has 470 Mb/d firm capacity to move Permian volumes to the Gulf Coast (expanding in late 2019) vs. ~300K bpd of Permian oil production on average in 2019. As such, we believe $1/bbl lower Permian differentials has a less than 1% negative impact on 2019 cash flows.
nCXO is exposed to local Permian crude oil prices though has ~50% of expected 2019 oil volumes hedged via basis contracts. We believe potential of volume impact from delays to Permian pipes will likely be minimal due to CXO’s scale and strong execution track record which should allow for greater consideration from marketing companies.
17 December 2018 |
31 |

vk.com/id446425943
Goldman Sachs
Americas Energy: Oil & Gas - E&P
Ability to show differentiated capital efficient growth from unique resource base
relative to other Permian producers key for long-term credit. On the Road to Shale Tail, we believe focus will likely be on producers which can drive execution led capital-efficient growth and have (1) unique resource base (long resource life which is low on the cost curve); and/or (2) ability to find and develop new resource plays or extend the life of existing shale plays.
nCXO has a unique resource base within the Permian and rising scale from its northern Midland “super block” that should sustain growth with potential to improve its slightly below industry breakeven supply cost over time. We believe CXO’s scale and plans to deploy bigger packages of wells per pad should allow for greater efficiencies.
nOXY is well positioned for shale scale because it has superior Permian inventory and technology edge (OXY continues to be a leader in well performance on our new analysis). Notably, OXY expects little well performance degradation due to its conservative spacing plans (4-6 wells per zone). We see OXY prepared for the middle stage of the Road to Shale Tail because it has expertise in secondary recovery that we believe will be key to the next leg of getting more oil out of shale.
Exhibit 32: We see less than a 1% change to cash flows from $1/bbl change in Permian differentials in the near-term
Impact of $1/bbl change in Permian differentials to 2019E cash flows
impactflowfrom $1/bbl |
|
1.0% |
|
|
|
|
|
||
differentialsPermian |
0.8% |
|
0.6% |
|
-0.2% |
|
|||
|
|
0.6% |
|
|
|
|
0.4% |
|
|
|
|
0.2% |
|
|
|
|
0.0% |
|
|
2019Ecash |
changein |
-0.4% |
|
|
-0.8% |
|
|
||
|
|
-0.6% |
|
-0.6% |
|
|
|
|
|
|
|
-1.0% |
|
OXY |
|
|
|
||
|
|
|
|
 $1/bbl narrower Brent-Midland differential
0.8%
-0.8%
CXO
 $1/bbl wider Brent-Midland differential
Source: Goldman Sachs Global Investment Research
Among gas E&Ps, what could be the drivers of EQT outperformance, and why be Neutral rated on COG?
Bottom line: EQT and COG are both exposed to natural gas prices. While we see more attractive combination of FCF/growth for COG relative to EQT, EQT is trading at a 0.7x discount to Appalachian gassy peers which we believe is unwarranted as compared to 2.1x premium for COG. We believe Street expectations are assuming little improvement in EQT’s capital efficiency which we believe can drive strong improvement in FCF expectations and share price revisions.
EQT: As indicated in our recent note upgrading EQT to Buy, we see three reasons to own EQT shares:
17 December 2018 |
32 |

vk.com/id446425943
Goldman Sachs
Americas Energy: Oil & Gas - E&P
1.Conservative 2019 guidance: We believe production guidance calling for 5% asset sale-adjusted growth in 2019 is conservative — we see a 1% higher growth rate in part due to assuming more modest curtailments.
2.Positive FCF with upside if capital efficiency improves: We believe concerns around management’s 5-year outlook are overdone — while we use a slightly lower long-term gas price vs. management, our analysis of historical well decline profiles indicates EQT should see an improvement in capital efficiency due to lower corporate decline rates post-2019. We see potential for upside if EQT can demonstrate a reduction in drilling/completion cost relative to our base case (we assume slightly higher capex relative to management’s 5-year outlook).
3.Attractive valuation: We see valuation as attractive with EQT (excluding its remaining minority midstream stake and hedges) trading at sub-4.0x on EBITDA multiples and a 0.7x discount to peers that we view as too wide.
COG: While we continue to view COG as a top-tier operator within its natural gas peer group with strong growth/returns, we see more balanced risk-reward with shares trading at a 2.1x premium to peers on 2019/20 upstream unhedged EBITDA. We see three key factors which can allow us to be more positive on shares:
1.Capital efficient growth: With 3Q18 results, management provided a preliminary operating plan for 2019, which included expectations for 20%-25% production growth, lower annual capex of $800-$850 mn (vs. $940 mn in 2018) and FCF before dividend of $650-$700 mn. We view current guidance as favorable as it focuses on capital discipline with capital efficient growth. Longer-term, we look for more confidence in relative production rates of Upper Marcellus vs. Lower Marcellus wells - we do not assume a degradation of production rates in our base case assumptions.
2.Strong FCF/continued FCF growth. We expect that COG can achieve 27% yoy growth and $820 mn in FCF in 2019 based on GS price deck of $2.96/MMBtu, though we note that based on current strip prices, we could see higher FCF of $900 mn. We believe FCF has become an increasingly important area of investor focus and, as such, expect E&Ps with attractive cash flow yields to benefit.
3.Continued focus/enhancement of shareholder returns. With 3Q results, COG raised its quarterly dividend by 17% (from $0.06 per share for 3Q18 to $0.07 per share) and is proceeding with its share repurchase plan. Moving forward, management indicated it plans to distribute 50% or greater FCF generated to shareholders through a combination of dividends/share repurchases. Management indicated flexibility towards returning more cash to shareholders depending on commodity prices in 2019. Due to its low cost position and new takeaway capacity, we believe COG can generate more than $1.9 bn in cumulative post-tax CF in the next three years (2018E-2020E) vs. company guidance of $1.6-$2.5 bn.
17 December 2018 |
33 |
vk.com/id446425943
Goldman Sachs
Americas Energy: Oil & Gas - E&P
Exhibit 33: We expect EQT to generate $0.3 bn (6% FCF yield) in |
Exhibit 34: ...vs. our expectation for $0.8 bn (7% FCF yield) for COG |
average FCF over the next 5 years... |
COG FCF excluding lease acquisitions, $ mn (left-axis); FCF yield |
EQT FCF excluding lease acquisitions, $ mn (left-axis); FCF yield |
excluding lease acquisition, % (right axis) |
excluding lease acquisition, % (right axis) |
|
Operating FCF excluding acquisitions |
|
$850 |
|
|
|
9% |
acquisition) .(ex yield FCF Operating |
|
$750 |
|
|
|
8% |
||
|
|
|
|
|
|||
|
$650 |
|
|
|
|
||
($ mn) |
$550 |
|
|
|
7% |
||
|
|
|
|
||||
$450 |
|
|
|
6% |
|||
|
|
|
|
||||
$350 |
|
|
|
|
|||
$250 |
|
|
|
5% |
|||
|
|
|
|
||||
$150 |
|
|
|
4% |
|||
|
|
|
|
|
|
||
|
|
2019E |
2020E |
2021E |
2022E |
2023E |
|
Operating FCF (ex. acquisition) |
FCF yield |
Source: Company data, Goldman Sachs Global Investment Research |
Source: Company data, Goldman Sachs Global Investment Research |
Exhibit 35: When stripping out market values of midstream subsidiaries and hedges, we note that EQT’s implied E&P business trades at a 0.7x discount to peers on 2019/20 EBITDA vs. COG which trades at a ~2.1x premium
Implied upstream EV/EBITDA multiples (hedged and unhedged) for gassy E&Ps based on our estimates; assuming 17.50% discount for tax/timing/diversification for EQM/EQGP consistent with our target price methodology; 2019/20 upstream EV includes the benefit of distributions from midstream entities through 2018/2019 year-end (excluding this for EQT in 2019 would imply slightly higher 2020E EV/EBITDA multiples)
|
Current upstream |
|
Current upstream unhedged |
|
Target upstream EV/EBITDA |
|
Target upstream unhedged |
||||
|
EV/EBITDA |
|
EV/EBITDA |
|
|
EV/EBITDA |
|||||
|
|
|
|
|
|
||||||
|
|
|
|
|
|
|
|
|
|
|
|
|
2019E |
2020E |
|
2019E |
2020E |
|
2019E |
2020E |
|
2019E |
2020E |
EQT |
3.5x |
3.9x |
|
3.5x |
4.1x |
|
3.7x |
4.2x |
|
3.7x |
4.3x |
COG |
6.6x |
6.5x |
|
6.6x |
6.5x |
|
7.9x |
7.7x |
|
7.9x |
7.7x |
AR |
3.1x |
3.7x |
|
3.5x |
4.1x |
|
NA |
NA |
|
NA |
NA |
RRC |
5.1x |
5.1x |
|
5.0x |
5.1x |
|
5.7x |
5.7x |
|
5.6x |
5.8x |
SWN |
3.6x |
3.9x |
|
3.6x |
3.9x |
|
3.6x |
3.9x |
|
3.7x |
3.9x |
GPOR |
3.3x |
3.3x |
|
3.1x |
3.3x |
|
3.2x |
3.2x |
|
3.0x |
3.2x |
CNX |
5.4x |
5.9x |
|
5.4x |
6.2x |
|
5.1x |
5.5x |
|
5.0x |
5.8x |
ECR |
3.8x |
4.0x |
|
3.7x |
3.9x |
|
4.1x |
4.3x |
|
4.0x |
4.2x |
Peer average |
4.3x |
4.5x |
|
4.3x |
4.6x |
|
4.8x |
4.9x |
|
4.7x |
5.0x |
Source: Company data, Goldman Sachs Global Investment Research
Will Leviathan be a positive or negative for NBL’s FCF/return of cash flow to shareholders relative to expectations?
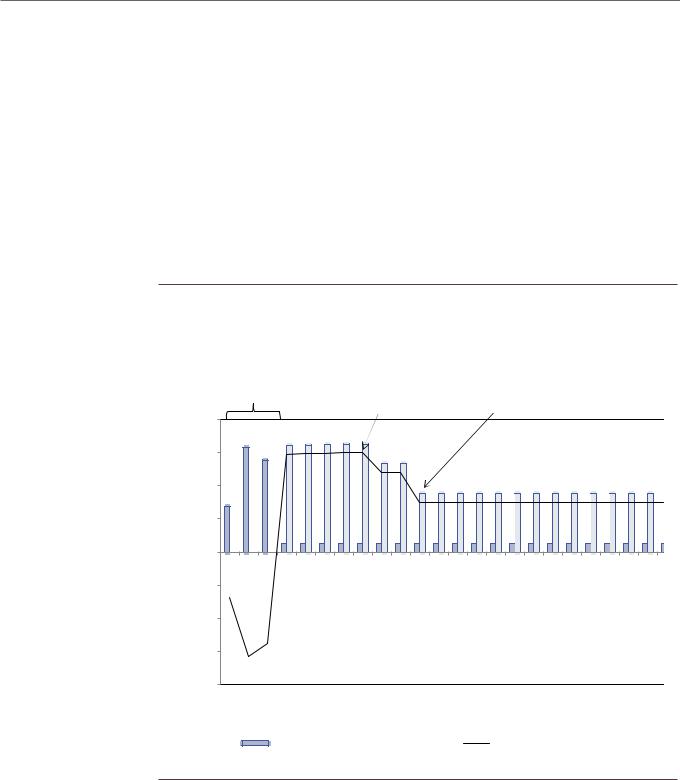
Bottom line: Leviathan is a high return, free cash generative project, which we expect can contribute $0.6 bn in FCF to NBL in 2020 and ultimately help NBL inflect from outspend to FCF generation on the corporate level, which can then be used for shareholder friendly activities.
Leviathan start-up expected by late 2019. One of the key points underpinning our Buy-rating on NBL has been that as we move closer to expected Leviathan startup in late 2019, we should start to see greater investor credit for the unique 34% IRR project. In particular, we believe both management and investors alike will become increasingly focused on greater capital allocation towards returning free cash to shareholders vs. M&A or other uses.
17 December 2018 |
34 |
vk.com/id446425943
Goldman Sachs
Americas Energy: Oil & Gas - E&P
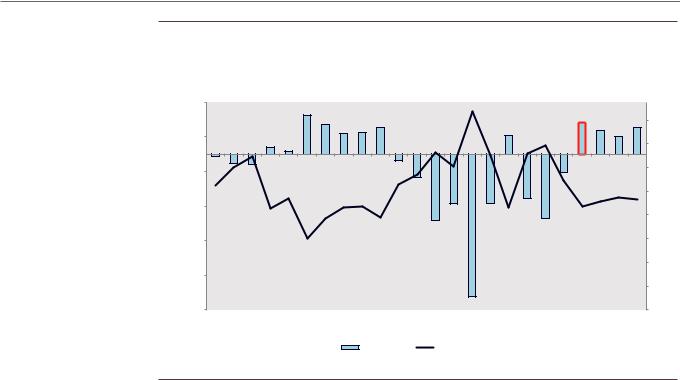
Expect inflection to FCF as Leviathan comes online. As seen in Exhibit 36, we expect 2019 to be a transition year as Leviathan development capex ramps down and production comes online, ultimately driving company-level FCF in 2020. Specifically, we forecast Phase I of Leviathan will generate $0.6 bn in FCF (net to NBL) in its first full year online (2020), which will contribute to our expectation for $0.2 bn in company FCF (after dividends) in 2020E. While we believe NBL will likely allocate some of its FCF to a combination of growth in its US onshore business, future phases of Leviathan (or Tamar expansion) or ongoing exploration efforts, we also expect that NBL will commit to pursue shareholder friendly activities such as share repurchases with excess cash flow. NBL currently has a $750 mn share repurchase program (31% of which had been bought back YTD by 3Q18 results), though this was driven in part by its Gulf of Mexico asset sale in February 2018. Moving forward, we believe ability to allocate capital from organic FCF generation will be key to greater credit from investors.
Exhibit 36: We expect Leviathan Phase I to generate $1.6 bn in gross post-tax cash flow for the first four years from project start-up, with $0.8 bn in FCF annually longer-term (net to partners); we expect NBL to generate $0.6 bn in FCF at project startup Leviathan Phase I
Operating cash flow and capex from Leviathan Phase I net to partners (NBL currently has 39.66% working interest)
Phase I capital |
Profit tax |
Profit tax |
investment of |
adjustment |
adjustment |
|
|
|
|
|
|
|
factor changes |
|
factor changes |
|
|
|
|
|
|
||||||||
|
$2.0 |
|
|
|
|
|
|
|
|
|
|
|
|
|
|
|
|
|
|
|
|
|
|
|
$1.5 |
|
|
|
|
|
|
|
|
|
|
|
|
|
|
|
|
|
|
|
|
|
|
|
$1.0 |
|
|
|
|
|
|
|
|
|
|
|
|
|
|
|
|
|
|
|
|
|
|
|
$0.5 |
|
|
|
|
|
|
|
|
|
|
|
|
|
|
|
|
|
|
|
|
|
|
bn |
$0.0 |
|
|
|
|
|
|
|
|
|
|
|
|
|
|
|
|
|
|
|
|
|
|
$ |
|
|
|
|
|
|
|
|
|
|
|
|
|
|
|
|
|
|
|
|
|
|
|
|
|
|
|
|
|
|
|
|
|
|
|
|
|
|
|
|
|
|
|
|
|
|
|
|
($0.5) |
|
|
|
|
|
|
|
|
|
|
|
|
|
|
|
|
|
|
|
|
|
|
|
($1.0) |
|
|
|
|
|
|
|
|
|
|
|
|
|
|
|
|
|
|
|
|
|
|
|
($1.5) |
|
|
|
|
|
|
|
|
|
|
|
|
|
|
|
|
|
|
|
|
|
|
|
($2.0) |
|
|
|
|
|
|
|
|
|
|
|
|
|
|
|
|
|
|
|
|
|
|
|
Year 1 |
Year 2 |
Year 3 |
Year 4 |
Year 5 |
Year 6 |
Year 7 |
Year 8 |
Year 9 |
Year 10 |
Year 11 |
Year 12 |
Year 13 |
Year 14 |
Year 15 |
Year 16 |
Year 17 |
Year 18 |
Year 19 |
Year 20 |
Year 21 |
Year 22 |
Year 23 |
Capex |
|
Cash flow post tax |
Operating FCF post tax |
|
|||
|
Source: Company data, Goldman Sachs Global Investment Research
17 December 2018 |
35 |
vk.com/id446425943
Goldman Sachs
Americas Energy: Oil & Gas - E&P
Exhibit 37: We expect 2019/20 to be inflection years for NBL as the company begins to benefit from Leviathan FCF
Funding gap, $ bn vs. Reinvestment rate (%)
|
0.75 |
|
|
|
|
|
|
|
|
|
|
|
|
|
|
|
|
|
|
|
|
|
|
|
|
|
|
|
|
|
|
|
|
|
|
|
|
|
|
|
|
|
|
|
|
|
|
|
160% |
|
0.25 |
|
|
|
|
|
|
|
|
|
|
|
|
|
|
|
|
|
|
|
|
|
|
140% |
|
|
|
|
|
|
|
|
|
|
|
|
|
|
|
|
|
|
|
|
|
|
|
|
|
($, bn) |
(0.25) |
|
|
|
|
|
|
|
|
|
|
|
|
|
|
|
|
|
|
|
|
|
|
120% |
|
|
|
|
|
|
|
|
|
|
|
|
|
|
|
|
|
|
|
|
|
|
|
||
|
|
|
|
|
|
|
|
|
|
|
|
|
|
|
|
|
|
|
|
|
|
|
100% |
|
gap |
(0.75) |
|
|
|
|
|
|
|
|
|
|
|
|
|
|
|
|
|
|
|
|
|
|
80% |
Funding |
|
|
|
|
|
|
|
|
|
|
|
|
|
|
|
|
|
|
|
|
|
|
|
|
(1.25) |
|
|
|
|
|
|
|
|
|
|
|
|
|
|
|
|
|
|
|
|
|
|
60% |
|
|
|
|
|
|
|
|
|
|
|
|
|
|
|
|
|
|
|
|
|
|
|
|
||
|
|
|
|
|
|
|
|
|
|
|
|
|
|
|
|
|
|
|
|
|
|
|
|
40% |
|
(1.75) |
|
|
|
|
|
|
|
|
|
|
|
|
|
|
|
|
|
|
|
|
|
|
|
|
|
|
|
|
|
|
|
|
|
|
|
|
|
|
|
|
|
|
|
|
|
|
|
20% |
|
(2.25) |
|
|
|
|
|
|
|
|
|
|
|
|
|
|
|
|
|
|
|
|
2021E |
|
0% |
|
2000 |
2001 |
2002 |
2003 |
2004 |
2005 |
2006 |
2007 |
2008 |
2009 |
2010 |
2011 |
2012 |
2013 |
2014 |
2015 |
2016 |
2017 |
2018E |
2019E |
2020E |
2022E |
2023E |
|
|
|
|
|
|
|
|
|
|
Funding gap |
|
Reinvestment rate |
|
|
|
|
|
|
|
|
|||||
Source: Company data, Goldman Sachs Global Investment Research
Can MRO continue to outperform?
Bottom line: We believe investors are concerned about MRO’s inventory depth in its core assets in the Myrmidon area in the Bakken and in Karnes County in the Eagle Ford. Moving forward, we expect greater focus on results from Atascosa County in the Eagle Ford and MRO’s Hector/Ajax area in the Bakken, as the company looks to define these areas as extensions of the core. We remain Neutral pending greater confidence in demonstration of enhanced inventory at continued productivity improvement or cost reductions which can allow MRO to sustain and drive greater capital-efficient growth and improve returns.
Inventory quality/depth remains a key Street concern. MRO has outperformed over the course of 2018 due good execution – production guidance was raised twice while capex was maintained. While execution has been favorable, investors remain concerned on the inventory depth of the Bakken/Eagle Ford areas within MRO’s portfolio:
1.Bakken. MRO has three key areas within the Bakken – Myrmidon (core of the core), Hector (core) and Ajax (an extension area which is currently being tested for higher intensity completions). Most of the Bakken wells drilled by MRO in past years (58%/74% in 2016/17) have been focused in the Myrmidon area. Our productivity analysis shows well productivity in Hector area lags that of Myrmidon on both an absolute and rate of improvement basis based on the most recent data (see Exhibits 38-39). Also, Ajax wells brought online in 2014/15 (we found no data for specified Ajax wells drilled in 2016-17) underperformed the Myrmidon/Hector wells in that period by ~45%/25% on 24-month cumulative rates; these wells were completed using older completions. We also note that ~30% of MRO’s 1.2K Bakken inventory is in Myrmidon area – this should allow the company to maintain healthy activity levels
17 December 2018 |
36 |
vk.com/id446425943
Goldman Sachs
Americas Energy: Oil & Gas - E&P
in the area for ~5 years (based on 60 net wells completed per year - based on 80 net completions per year and 75% of wells completed in the Myrmidon area). This drives greater focus on (1) upside to remaining inventory in the Myrmidon area; and
(2) potential for well results from recent optimized completions in the Ajax/Hector area to improve. We note recent wells in the Ajax area announced on 12/11 with 30-day oil IP rates of over 2K bpd have been favorable, while still slightly below recent Myrmidon wells with 30-day oil IP rates of ~2.6K bpd. Confidence in repeatability of the results could drive upside to our resource estimate for the area.
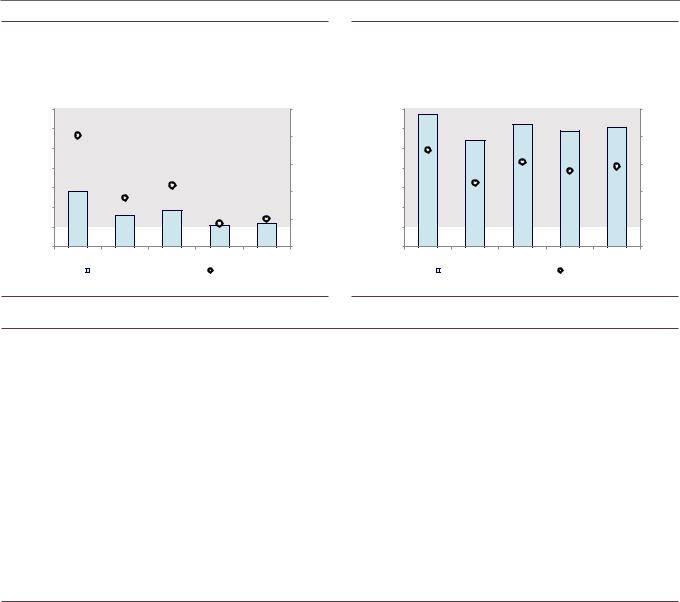
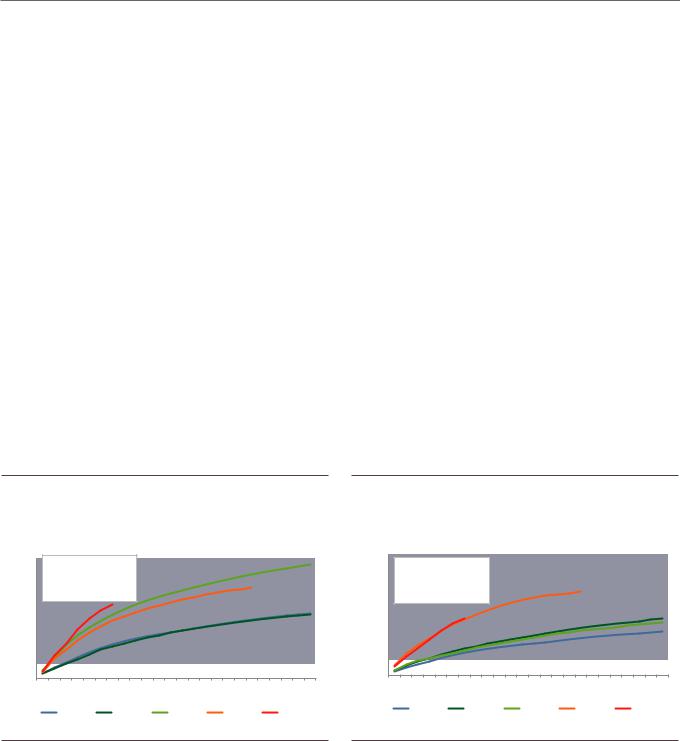
2.Eagle Ford. MRO has two key areas in the Eagle Ford – Karnes County (core) and Atascosa County (non-core). Most of the Eagle Ford wells drilled by MRO in the past years (80%/68% in 2016/17) have been focused in Karnes County. We note that about 25% of MRO’s remaining ~1.2K Eagle Ford inventory is in Karnes County; given ~80 wells completed per year (based on ~100 net wells per year and 80% of wells completed in the Karnes area), these levels should allow for continued healthy activity levels for ~4 more years. Our productivity analysis shows that based on the most recent data, Karnes county wells have outperformed those of Atascosa on an absolute basis and in line on rate of improvement (see Exhibits 40-41). Similar to the Bakken, we believe this will drive greater focus on (1) upside to remaining inventory in the core (Karnes County) and (2) potential for additional strong results from Atascosa County. We note that with 3Q18 results, the company reported favorable results from Atascosa County; 30-day oil IP rates averaging ~1.1K bpd (2Q18 Karnes 30-day oil IP rates averaging ~1.7K bpd).
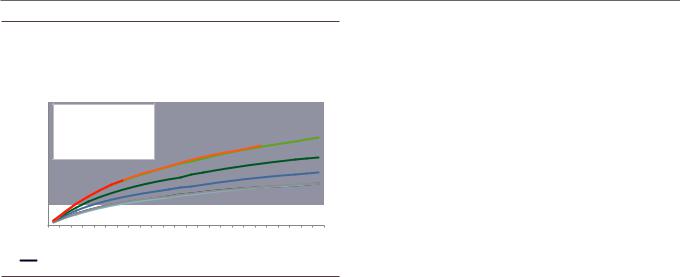
Exhibit 38: MRO Myrmidon wells in 2018 are tracking 29% above 2017 wells...
Cumulative oil production from MRO wells in Myrimdon area in Bakken adjusted for lateral length
laterals |
40 |
Lateral adj. production |
|
|
|
|
||||||
35 |
2017 vs. 2016: -12% |
|
|
|
|
|
||||||
|
|
|
|
|
|
|
|
|
|
|
||
30 |
2018 vs. 2017: +29% thus |
|
|
|
|
|||||||
for |
|
|
|
|
||||||||
far |
|
|
|
|
|
|
|
|
|
|
||
|
|
|
|
|
|
|
|
|
|
|
||
adjusted |
25 |
|
|
|
|
|
|
|
|
|
|
|
20 |
|
|
|
|
|
|
|
|
|
|
|
|
|
|
|
|
|
|
|
|
|
|
|
|
|
bbls |
15 |
|
|
|
|
|
|
|
|
|
|
|
10 |
|
|
|
|
|
|
|
|
|
|
|
|
Cumulative |
|
|
|
|
|
|
|
|
|
|
|
|
5 |
|
|
|
|
|
|
|
|
|
|
|
|
0 |
2 |
3 |
4 |
5 |
6 |
7 |
8 |
9 |
10 11 12 13 14 15 16 17 18 19 20 21 22 23 24 |
|||
|
1 |
|||||||||||
|
|
|
|
|
|
|
|
|
|
Month |
|
|
|
|
|
2014 |
|
|
|
2015 |
|
2016 |
2017 |
2018 |
|
Exhibit 39: ...and tracking above Hector area average on an absolute and rate of improvement basis
Cumulative oil production from MRO wells in Hector area in Bakken adjusted for lateral length
laterals |
40 |
Lateral adj. production |
|
|
|
|
||||||
35 |
|
|
|
|
||||||||
2017 vs. 2016: |
+92% |
|
|
|
|
|
||||||
|
|
|
|
|
|
|||||||
30 |
|
|
|
|
|
|
|
|
|
|
|
|
for |
2018 vs. 2017: +1% thus |
|
|
|
|
|||||||
|
|
|
|
|
||||||||
adjusted |
25 |
far |
|
|
|
|
|
|
|
|
|
|
|
|
|
|
|
|
|
|
|
|
|
||
20 |
|
|
|
|
|
|
|
|
|
|
|
|
|
|
|
|
|
|
|
|
|
|
|
|
|
bbls |
15 |
|
|
|
|
|
|
|
|
|
|
|
10 |
|
|
|
|
|
|
|
|
|
|
|
|
Cumulative |
|
|
|
|
|
|
|
|
|
|
|
|
5 |
|
|
|
|
|
|
|
|
|
|
|
|
0 |
2 |
3 |
4 |
5 |
6 |
7 |
8 |
9 |
10 11 12 13 14 15 16 17 18 19 20 21 22 23 24 |
|||
|
1 |
|||||||||||
|
|
|
|
|
|
|
|
|
|
Month |
|
|
|
|
|
2014 |
|
|
|
2015 |
|
2016 |
2017 |
2018 |
|
Source: IHS, Goldman Sachs Global Investment Research |
Source: IHS, Goldman Sachs Global Investment Research |
17 December 2018 |
37 |

vk.com/id446425943
Goldman Sachs
Americas Energy: Oil & Gas - E&P
Exhibit 40: MRO Karnes wells in 2018 are tracking 3% to 4% above |
Exhibit 41: ...and tracking above Atascosa county average on an |
2017 wells... |
absolute basis and in line on rate of improvement |
Cumulative oil production from MRO wells in Karnes County in Eagle |
Cumulative oil production from MRO wells in Atascosa County in Eagle |
Ford Shale adjusted for lateral length |
Ford Shale adjusted for lateral length |
lateralsforadjustedbblsCumulative |
0 |
Lateral adj. production |
|
|
|
lateralsforadjustedbblsCumulative |
||||||
|
35 |
2017 vs. 2016: +30% |
|
|
|
|
|
|||||
|
30 |
2018 vs. 2017: +3% to 4% |
|
|
|
|
||||||
|
25 |
thus far |
|
|
|
|
|
|
|
|
|
|
|
|
|
|
|
|
|
|
|
|
|
|
|
|
20 |
|
|
|
|
|
|
|
|
|
|
|
|
15 |
|
|
|
|
|
|
|
|
|
|
|
|
10 |
|
|
|
|
|
|
|
|
|
|
|
|
5 |
|
|
|
|
|
|
|
|
|
|
|
|
1 |
2 |
3 |
4 |
5 |
6 |
7 |
8 |
9 |
10 11 12 13 14 15 16 17 18 19 20 21 22 23 24 |
||
|
|
|
|
|
|
|
|
|
|
Month |
|
|
|
|
|
2014 |
|
|
|
2015 |
|
2016 |
2017 |
2018 |
|
35 |
Lateral adj. production |
|
|
||
30 |
2017 vs. 2016: -2% |
|
25 |
2018 vs. 2017: +2% to 5% |
|
thus far |
||
|
||
20 |
|
|
15 |
|
|
10 |
|
|
5 |
|
0 


 1 2 3 4 5 6 7 8 9 10 11 12 13 14 15 16 17 18 19 20 21 22 23 24
|
|
Month |
|
|
2014 |
2015 |
2016 |
2017 |
2018 |
Source: IHS, Goldman Sachs Global Investment Research |
Source: IHS, Goldman Sachs Global Investment Research |
What are the potential catalysts for APA to outperform?
Bottom line: Over the past two years, the Street has largely rejected the bull case for Apache that the stock may deserve credit for meaningful discovered resource at the Alpine High play in the southwest Permian Basin, largely in our view because Alpine High has been largely considered a gassy play. APA shares have underperformed the XOP index by 24% over the past three years and 8% YTD. We are Neutral rated though see potential for greater credit to be awarded to the shares as the company transitions from resource-driven catalysts to cash flow-driven catalysts.
Five cash flow-impacting catalysts over the next year:
1.Confidence in lower operating costs. APA has indicated that Alpine High operating costs are lower than the rest of the portfolio and are also falling. As Alpine High production ramps, while average revenue per BOE should decline due to a gassier mix, confidence in higher cash flows from meaningful lower operating costs will be key. We estimate total US production costs (before production taxes) will fall by 5% by 4Q19 and 7% in FY20 vs. 3Q18. We believe this will help margins and overall cash flow. We also see room for DD&A per BOE to decline as well which could help return on capital employed, and this may be needed along with falling annual F&D costs for greater appreciation of Alpine High’s capital cost structure.
2.NGLs production ramping (2Q-4Q 2019). Apache expects new access to cryogenic processing plants starting in April 2019, which will allow the company to ramp its NGL production from the Alpine High play. Higher liquids should drive greater revenue and EBITDA growth, especially if ethane/NGLs prices are favorable.
3.Potential further asset sales (2019). We see potential for the company to consider further asset sales. We believe APA’s core plays are Alpine High, Permian Basin unconventional, North Sea and Egypt. We see 48 MBOE/d of US production outside the Permian/Alpine High. We believe the Street affords little value beyond producing/proved developed reserves, and our target price assumes little explicit
17 December 2018 |
38 |
vk.com/id446425943 |
Americas Energy: Oil & Gas - E&P |
Goldman Sachs |
undrilled credit. While these are cash flow contributing assets, we believe that given its already strong balance sheet, the company would consider allocating incremental FCF (asset sales or operating-driven) to share repurchase.
4.New gas pipelines limiting exposure to local Permian prices (4Q19). The sharp rise in associated and Alpine High natural gas production has created regional oversupply and further dampened Street sentiment towards Apache’s Alpine High play. While we see potential for local price volatility, we note that as the Gulf Coast Express pipelines ramp up in 2H19, Apache will reduce its local price exposure to minimal levels. While we are not medium-term bullish on Henry Hub, we believe this will result in improved realizations even post-transport costs.
5.Exploration upside — oily zones in Alpine High, new onshore plays, Suriname wildcat (2H19). We believe shares afford little credit for exploration which is understandable as the company has had little recent success outside of Alpine High and adds in the North Sea. However, we see three key areas of focus over the next year: (1) Oily zones in Alpine High, (2) Suriname exploration well, and (3) additional US onshore unconventional plays. Any favorable exploration news could drive share prices higher.
Exhibit 42: We assume $7 per BOE production cost for Alpine High production which should drive total US production costs lower as Alpine High weighting of total production rises
US production cost weighted by area (ex taxes)
BOE |
$12 |
|
|
|
|
|
|
|
$10 |
|
|
|
|
|
|
|
|
|
|
|
|
|
|
|
|
|
per |
$8 |
|
$13 |
$14 |
$14 |
$14 |
$14 |
$14 |
$10 |
|
|||||||
cost |
$7 |
|
|
|||||
|
$7 |
|
|
|
|
|||
$6 |
|
$7 |
$7 |
|
|
|||
production |
|
|
|
$7 |
$7 |
|||
|
|
|
|
|||||
$4 |
$9 |
$10 |
$10 |
|
|
|
|
|
|
|
|
|
|
|
|
|
|
US |
$2 |
|
|
|
$10 |
$10 |
$10 |
$10 |
|
|
|
|
|||||
|
|
|
|
|
|
|
|
|
|
$0 |
2017 |
2018E |
2019E |
2020E |
2021E |
2022E |
2023E |
|
|
Ex Alpine High |
Alpine High |
|
Other US |
|
Exhibit 43: APA wells in the Midland Basin play averages are outperforming play average by ~10% in 2017/18 ...
Cumulative oil production from APA wells in Midland Basin adjusted for lateral length
laterals |
30 |
Lateral adj. production |
|
|
|
|
|
|
||||||
25 |
2017 vs. 2016: |
+43% |
|
|
|
|
|
|
|
|||||
|
|
|
|
|
|
|
|
|||||||
|
2018 vs. 2017: +2% to 3% |
|
|
|
|
|
||||||||
for |
|
|
|
|
|
|
||||||||
20 |
thus far |
|
|
|
|
|
|
|
|
|
|
|
||
adjusted |
|
|
|
|
|
|
|
|
|
|
|
|
|
|
15 |
|
|
|
|
|
|
|
|
|
|
|
|
|
|
bbls |
|
|
|
|
|
|
|
|
|
|
|
|
|
|
10 |
|
|
|
|
|
|
|
|
|
|
|
|
|
|
Cumulative |
|
|
|
|
|
|
|
|
|
|
|
|
|
|
5 |
|
|
|
|
|
|
|
|
|
|
|
|
|
|
|
|
|
|
|
|
|
|
|
|
|
|
|
|
|
|
0 |
|
|
|
|
|
|
|
|
|
|
|
|
|
|
1 |
2 |
3 |
4 |
5 |
6 |
7 |
8 |
9 |
10 11 12 13 14 15 16 17 18 19 20 21 22 23 24 |
||||
|
|
|
|
|
|
|
|
|
|
|
Month |
|
|
|
|
2011 |
|
2012 |
|
|
2013 |
|
|
2014 |
2015 |
2016 |
2017 |
2018 |
|
Source: Company data, Goldman Sachs Global Investment Research |
Source: IHS, Goldman Sachs Global Investment Research |
17 December 2018 |
39 |
vk.com/id446425943
Goldman Sachs
Americas Energy: Oil & Gas - E&P
Exhibit 44: Industry Midland Basin wells performance in 2018 is in-line with 2016/17 wells
Cumulative oil production from all Midland Basin wells adjusted for lateral length
Cumulative bbls adjusted for laterals
30 |
Lateral adj. production |
|
|
||||||
|
|
|
|||||||
25 |
2017 vs. 2016: |
+1% |
|
|
|
||||
|
|
|
|
|
|
|
|
|
|
20 |
2018 vs. 2017: +1% to 2% |
|
|||||||
thus far |
|
|
|
|
|
|
|
||
15 |
|
|
|
|
|
|
|
|
|
10 |
|
|
|
|
|
|
|
|
|
5 |
|
|
|
|
|
|
|
|
|
0 |
|
|
|
|
|
|
|
|
|
1 |
2 |
3 |
4 |
5 |
6 |
7 |
8 |
9 |
10 11 12 13 14 15 16 17 18 19 20 21 22 23 24 |
Month
2011 |
|
2012 |
|
2013 |
|
2014 |
|
2015 |
|
2016 |
|
2017 |
|
2018 |
|
|
|
|
|
|
|
Source: IHS, Goldman Sachs Global Investment Research
17 December 2018 |
40 |