


vk.com/id446425943
Goldman Sachs
Solar boom accelerating
Power Shift 2019: Nextgen Power
During 2008-17, solar capacity has been growing at a +44% CAGR. During the same time frame, most commentators have been continuously revising upwards growth expectations. We believe this is set to continue owing to: (i) ongoing cost improvements, supported by an oversupply in modules and new technologies; (ii) the rise of the incumbents, which have decisively begun to enter the space (eg, Enel); and (iii) the rising willingness by corporates to sign long-term contracts (corporate PPAs, or C-PPA). Spain remains the precursor on this theme: through May-November, the pipeline of solar projects doubled (to 55 GW) and is now equivalent to c.50% of the total installed base in the country. Given its deflationary effect on wholesale prices, its ability to generate carbon-free power, and the reduced geopolitical dependence on foreign regions to generate electricity (eg gas imports), we believe political support for solar will remain strong.
The IEA has increased its 2030 forecasts ten-fold, over the past 10 years
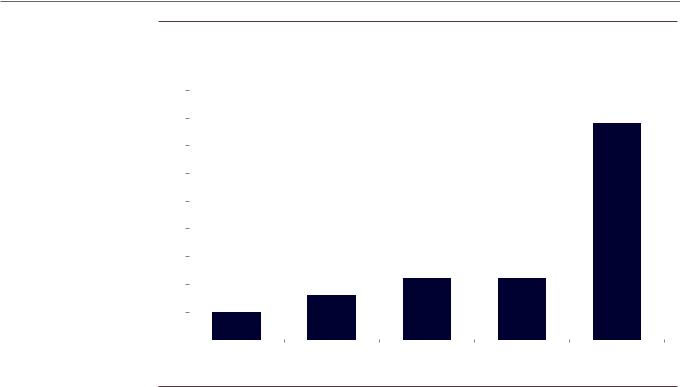
Solar growth has been surprising to the upside for the past 10 years. Exhibit 7 shows that the International Energy Agency (IEA) has consistently revised upwards its solar capacity forecasts. It is interesting to observe that just over 10 years ago, for 2030, the IEA was expecting less than 100 GW of solar PV, globally. In its latest update, the IEA is forecasting >1,000 GW, about a ten-fold increase.
Exhibit 7: IEA Solar capacity forecasts for 2030 have been revised upward more than 10-fold since 2006 data in GW
1,000 |
|
|
|
|
|
|
|
|
|
|
|
|
|
|
|
|
|
|
|
|
|
|
900 |
|
|
|
|
|
|
|
|
|
|
|
|
|
|
|
|
|
|
|
|
|
Actual & 2017 forecasts |
800 |
|
|
|
|
|
|
|
|
|
|
|
|
|
|
|
|
|
|
|
|
|
2016 |
|
|
|
|
|
|
|
|
|
|
|
|
|
|
|
|
|
|
|
|
|
|
|
700 |
|
|
|
|
|
|
|
|
|
|
|
|
|
|
|
|
|
|
|
|
|
2015 |
|
|
|
|
|
|
|
|
|
|
|
|
|
|
|
|
|
|
|
|
|
|
|
|
|
|
|
|
|
|
|
|
|
|
|
|
|
|
|
|
|
|
|
|
|
2014 |
600 |
|
|
|
|
|
|
|
|
|
|
|
|
|
|
|
|
|
|
|
|
|
2013 |
|
|
|
|
|
|
|
|
|
|
|
|
|
|
|
|
|
|
|
|
|
|
|
500 |
|
|
|
|
|
|
|
|
|
|
|
|
|
|
|
|
|
|
|
|
|
2012 |
|
|
|
|
|
|
|
|
|
|
|
|
|
|
|
|
|
|
|
|
|
|
|
400 |
|
|
|
|
|
|
|
|
|
|
|
|
|
|
|
|
|
|
|
|
|
2011 |
300 |
|
|
|
|
|
|
|
|
|
|
|
|
|
|
|
|
|
|
|
|
|
2010 |
|
|
|
|
|
|
|
|
|
|
|
|
|
|
|
|
|
|
|
|
|
|
|
200 |
|
|
|
|
|
|
|
|
|
|
|
|
|
|
|
|
|
|
|
|
|
2009 |
|
|
|
|
|
|
|
|
|
|
|
|
|
|
|
|
|
|
|
|
|
2008 |
|
|
|
|
|
|
|
|
|
|
|
|
|
|
|
|
|
|
|
|
|
|
|
|
100 |
|
|
|
|
|
|
|
|
|
|
|
|
|
|
|
|
|
|
|
|
|
2007 |
|
|
|
|
|
|
|
|
|
|
|
|
|
|
|
|
|
|
|
|
|
|
|
0 |
|
|
|
|
|
|
|
|
|
|
|
|
|
|
|
|
|
|
|
|
|
2006 |
2008 |
2009 |
2010 |
2011 |
2012 |
2013 |
2014 |
2015 |
2016 |
2017 |
2018 |
2019 |
2020 |
2021 |
2022 |
2023 |
2024 |
2025 |
2026 |
2027 |
2028 |
2029 |
2030 |
Source: IEA, data compiled by Goldman Sachs Global Investment Research
3 December 2018 |
9 |
vk.com/id446425943
Goldman Sachs
Power Shift 2019: Nextgen Power
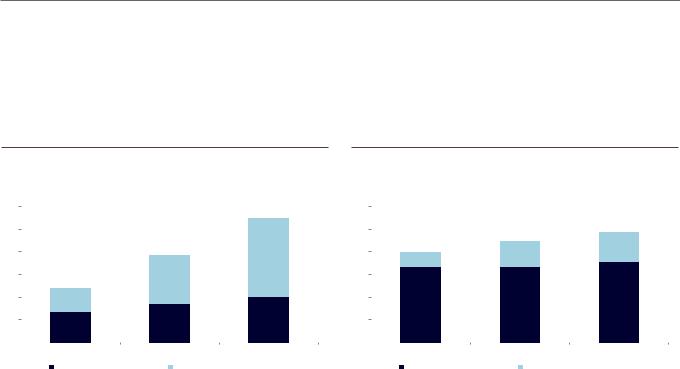
Spanish solar backlog has doubled in just over six months
Another interesting data point comes from Spain: when we published on solar’s potential to transform Europe’s energy mix six months ago, Spain had 24 GW of planning applications for solar. This has doubled to 55 GW. Ongoing cost reduction, the willingness of corporates to sign long-term PPA contracts, and rising wholesale power prices explain the boom.
Exhibit 8: Solar planning applications have doubled |
|
|
|
Exhibit 9: Wind applications have increased 20% |
|
|
||||||||
Planning applications for subsidy-free solar PV projects in Spain, GW |
|
|
Planning applications for subsidy-free wind projects in Spain, GW |
|
||||||||||
60 |
|
|
|
|
55 |
30 |
|
|
|
|
24 |
|
||
|
|
|
|
|
|
|||||||||
50 |
|
|
|
|
|
25 |
|
|
|
22 |
|
|||
|
|
|
|
|
|
|
|
|
|
|||||
|
|
|
|
38 |
|
|
|
|
|
|
20 |
|
6 |
|
40 |
|
|
|
|
20 |
|
|
|
5 |
|
||||
|
|
|
|
35 |
|
|
3 |
|
|
|||||
|
|
|
|
|
|
|
|
|
|
|
|
|
||
30 |
|
|
24 |
21 |
|
15 |
|
|
|
|
|
|
||
|
|
|
|
|
|
|
|
|
|
|
|
|
||
20 |
|
|
10 |
|
|
10 |
|
|
17 |
17 |
18 |
|
||
|
|
|
|
|
|
|
|
|
|
|
||||
|
|
|
|
|
|
|
|
|
|
|
|
|||
10 |
|
|
14 |
17 |
20 |
5 |
|
|
|
|
|
|
||
|
|
|
|
|
|
|
|
|
|
|
|
|
||
|
|
|
|
|
|
|
|
|
|
|
|
|
|
|
0 |
|
|
|
|
|
0 |
|
|
|
|
|
|
||
|
|
May-18 |
Oct-18 |
Nov-18 |
|
|
May-18 |
Oct-18 |
Nov-18 |
|
||||
|
|
|
|
|
|
|
|
|
||||||
|
|
|
Applications with grid connection |
Applications without grid connections |
|
|
|
|
|
Applications with grid connection |
Applications without grid connections |
|
||
|
|
|
|
|
|
|
||||||||
Source: REE, Goldman Sachs Global Investment Research |
|
|
|
Source: REE, Goldman Sachs Global Investment Research |
|
|
||||||||
3 December 2018 |
10 |
vk.com/id446425943
Goldman Sachs
The rise of the incumbents
Power Shift 2019: Nextgen Power
The reduction in costs and the evolving corporate PPA market have led to an acceleration in our “solar thesis”, expressed in our previous report; for instance, the pipeline of solar projects in Spain has risen from 24 GW in May 2018 to 55 GW in just over six months. Another novelty vs our previous research is the rising presence of incumbent utilities: recently, Enel/Endesa and Iberdrola – seen by most as the early movers in energy transition – have announced new investments in the solar space, under corporate PPA.
Enel has shown the path: More will follow
During its recent capital markets day (November 20), Enel emphasised a new route to develop renewables, by leveraging corporate power purchasing agreements (C-PPA). Effectively, instead of competing in (often overcrowded) auctions, Enel has been approaching industrial and commercial customers with the intention to sell renewable power under long-term contracts, at a fixed price. For a corporate, despite the ability to “green up” its power intake, such contracts are able to offer a substantial discount when compared with the current forward curves. Exhibit 10 compares the potential C-PPA prices in Spain from solar and wind, to the wholesale forward curves.
Exhibit 10: We estimate that a C-PPA from Solar in 2019 in Spain could lead to c.40% savings for corporates data in €/MWh
70
60
50 |
42% |
|
discount |
40 |
|
|
6.0 |
30 |
61.2 |
5.0
1.2
20
35.7
23.5
10
0
Solar LCOE (5.25% IRR) |
Transmission |
Backup |
Extra mark-up |
Solar C-PPA (5.25% |
Fwd Curve 2019 |
|
|
|
|
return) |
|
Source: Goldman Sachs Global Investment Research
As seen from the chart, such contracts could lead to c.40% savings for corporates. Also, such contracts could boost returns – at least for the incumbent utilities able to act as early movers. For Enel, we estimate that C-PPAs could improve the IRR-over-WACC spreads from 100-150 bp to around 200 bp.
3 December 2018 |
11 |
vk.com/id446425943
Goldman Sachs
Power Shift 2019: Nextgen Power
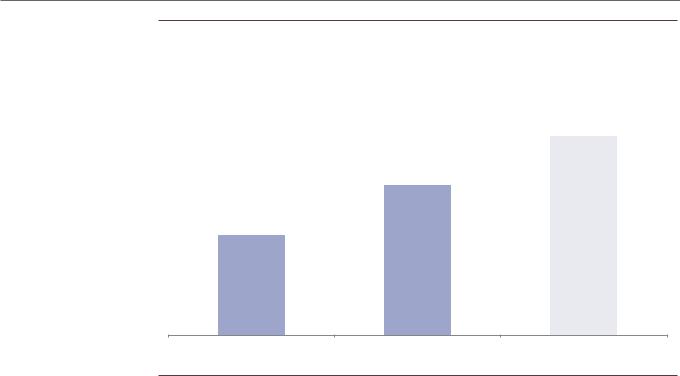
Exhibit 11: Corporate PPAs could temporarily boost IRR spreads over WACC data in basis points for a typical project by Enel
200-250
125-150
75-100
Typical Solar IRR - WACC (auctions) |
Typical Wind IRR - WACC (auctions) |
Typical IRR - WACC (C-PPA) |
Source: Goldman Sachs Global Investment Research
Clearly, the ability to enhance IRRs via corporate PPAs will be more relevant in the home market of an incumbent utility. Renewable additions outside of home markets may not benefit from “cheaper backup” via existing hydro/gas plants. This means that IRRs in the home market could surpass those outside of it.
Three advantages that favour the incumbents
Compared to renewables IPPs, incumbent utilities could face three pivotal advantages that could make them more successful in taking market share, and could allow for higher returns vs the IPPs.
1. Scale
The main renewable developers (Enel, Iberdrola, RWE, EDP, Orsted) typically add from 600 MW per year to about 4,000 MW per year. These companies simultaneously manage several projects (globally), each with an average size of 150-200 MW, and with instances as large as 1,000 MW. This compares with many IPPs where the average size of the project is 5-50 MW, and global additions would not even reach 100 MW. This implies advantages in purchasing the equipment, and major savings in installation costs; for instance, currently the larger developers have already started to adopt robots to lay down lanes of solar modules. This has increased productivity and lowered costs significantly.
3 December 2018 |
12 |
vk.com/id446425943
Goldman Sachs
Power Shift 2019: Nextgen Power
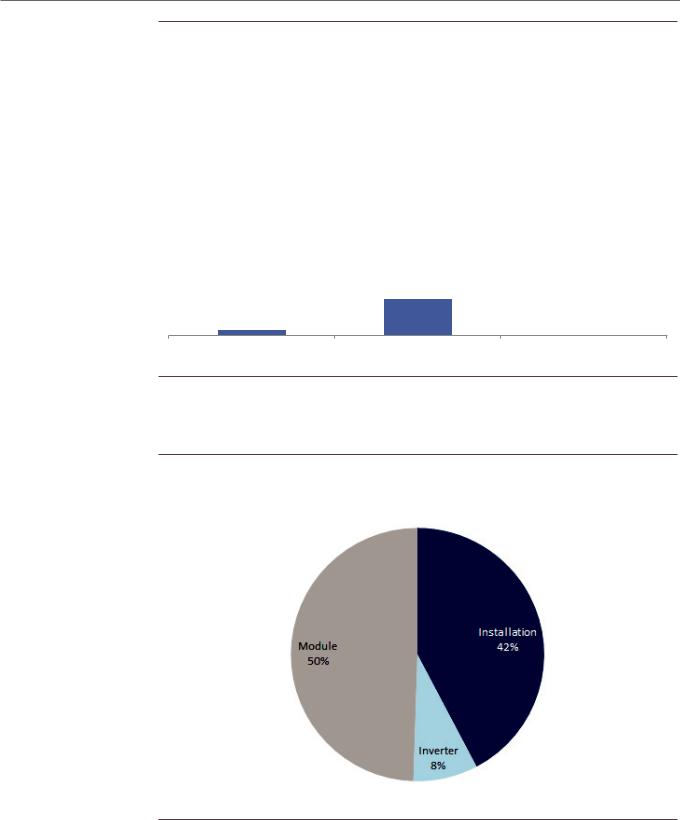
Exhibit 12: Large utilities enjoy a scale advantage vs smaller IPPs
Illustrative data for typical solar/wind projects
1 GW
150-200 MW
5-50 MW
Typical IPP project |
Typical incumbent project |
Largest project by incumbent |
Source: Goldman Sachs Global Investment Research
As a reference, we show the breakdown of the capex/kW for a typical solar park, in 2019E.
Exhibit 13: Modules account for half of the solar input costs
Solar plant input cost split
Source: IRENA, Goldman Sachs Global Investment Research
2. Commercial relationships with corporate clients
Large utilities have long-standing relationships with industrial and commercial clients. It might be relatively easy therefore for a utility to approach an existing customer, and offer a corporate PPA.
3 December 2018 |
13 |
vk.com/id446425943
Goldman Sachs
Power Shift 2019: Nextgen Power
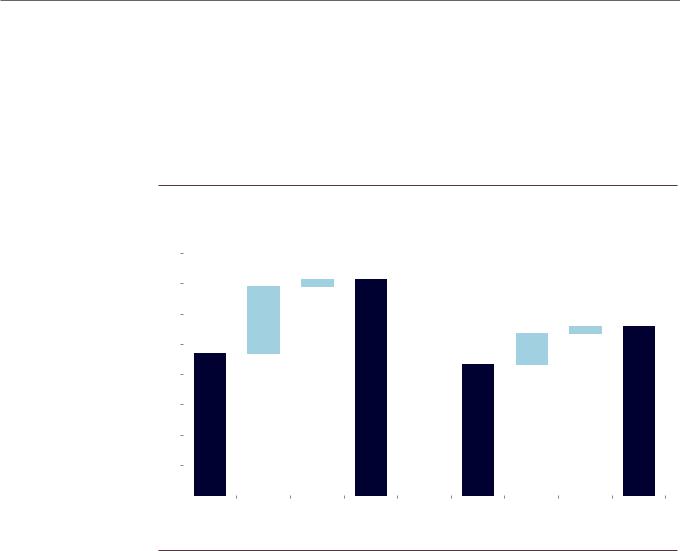
3. Lower backup costs (in home market)
Besides lower installation costs (to the tune of 5%-10% based on anecdotal evidence), utilities are also capable of offering cheaper PPAs thanks to lower backup costs. Indeed, due to the volatile/erratic nature of renewables output, typically solar developers have to secure backup output for whenever the sun isn’t shining. We estimate backup costs at €10-12/MWh for IPPs, vs €5/MWh for an integrated utility that already owns hydro/gas-fired power plants, which can directly provide said backup. As we explain later, we see this feature as pivotal to boost solar IRRs in home markets.
Exhibit 14: Incumbents can offer corporate PPAs c.20% cheaper
LCOE to Corporate PPA cost bridge for independent power producers (IPP) and incumbents, €/MWh
40 |
|
|
|
35-37 |
|
|
|
|
|
|
|
|
|||
|
|
|
|
|
|
|
|
35 |
|
|
|
1 |
|
|
|
30 |
|
|
|
10-12 |
|
|
28 |
|
|
|
|
|
1 |
|
|
|
|
|
24 |
|
|
|
|
25 |
|
|
|
|
5 |
|
|
|
|
|
|
|
22 |
|
|
|
|
|
|
|
|
|
|
20 |
|
|
|
|
|
|
|
15 |
|
|
|
|
|
|
|
10 |
|
|
|
|
|
|
|
5 |
|
|
|
|
|
|
|
0 |
|
|
|
|
|
|
|
|
|
LCOE IPP |
Back-up Transmission C-PPA (IPP) |
LCOE |
Back-up Transmission |
C-PPA |
|
|
|
|
|||||
|
|
|
|
|
incumbent |
|
(incumbent) |
Source: Goldman Sachs Global Investment Research
Corporate PPA market has already started to pick up in Europe
Similar to what has been happening in the US, European corporates have started to sign long-term power offtakes from renewable sources; most of these contracts have been signed in Spain and the Nordic region. We believe this new tool will accelerate the development of solar PV, and it is one of the reasons behind the rising solar pipeline in Spain (55 GW in November 2018, almost double the May level, and equivalent to about half of the total installed base in the country).
3 December 2018 |
14 |
vk.com/id446425943
Goldman Sachs
Power Shift 2019: Nextgen Power
Exhibit 15: In 2018, the corporate PPA market has been picking up pace in Europe
Corporate PPA volumes in Europe, ytd based on press reports and company announcements
4.5 |
|
|
|
|
|
|
|
|
|
|
|
||
4.0 |
|
|
|
|
|
|
3.5 |
|
|
|
|
|
3.9 GW |
|
|
|
|
|
|
|
3.0 |
|
|
|
|
|
|
2.5 |
|
|
|
|
|
|
2.0 |
|
|
|
|
|
|
1.5 |
|
|
|
|
|
|
1.0 |
|
|
|
1.1 GW |
1.1 GW |
|
|
|
|
|
|
||
0.5 |
|
|
0.8 GW |
|
|
|
|
0.5 GW |
|
|
|
|
|
|
|
|
|
|
|
|
0.0 |
|
|
|
|
|
|
|
|
|
|
|
|
|
2014 |
2015 |
2016 |
2017 |
YTD |
||
Source: Goldman Sachs Global Investment Research, IRENA
3 December 2018 |
15 |