


vk.com/id446425943
Goldman Sachs
Power Shift 2019: Nextgen Power
Solar LCOE falling faster and deeper
We lower our European 2018-30E LCOE forecasts by 10% to reflect falling module prices in the region, driven by the oversupply of the Chinese solar market and the end of anti-dumping laws. This puts solar at a significant discount to forward curves in Spain and Italy in particular as well as in France and Germany. For 2019, we estimate that generating electricity from solar across Southern Europe would be c.50% cheaper than the prevailing (merchant) forward curves. We currently factor in a gradual improvement in modules efficiency; a widespread switch to bifacial trackers could lower costs further (by 5%-20%), as we explain later in this note.
Oversupply in Chinese solar manufacturing has sent module prices down 30%
At the end of May, China, which accounted for 50% of global solar installations in 2017, issued new policies that drove a significant drop of solar installations for 2018. The government announced widespread subsidy cuts and introduced a distributed generation quota of 10 GW that was far below expectations. This led to oversupply in the solar industry and a significant decrease in prices as shown below. Module prices have fallen almost 30% since the beginning of the year.
Exhibit 16: Solar market is in oversupply in 2018
Module production utilisation rate
100% |
|
|
87% |
94% |
|
|
|
|
|
|
|
|
|
||||
90% |
|
|
|
|
|
|
81% |
|
|
|
|
|
|
|
|
||
|
|
|
|
|
|
|
|
|
80% |
|
|
|
|
|
|
75% |
|
70% |
|
|
|
|
66% |
67% |
|
|
60% |
|
|
|
|
|
|
|
|
50% |
|
|
|
|
|
|
|
|
40% |
|
|
|
|
|
|
|
|
30% |
|
|
|
|
|
|
|
|
20% |
|
|
|
|
|
|
|
|
10% |
|
|
|
|
|
|
|
|
0% |
|
|
|
|
|
|
|
|
|
|
|
|
|
|
|
|
|
|
|
2016 |
2017 |
2018E |
2019E |
2020E |
2021E |
|
Exhibit 17: Global module prices are down c.30% ytd
US$/W |
|
|
|
|
|
|
|
|
|
|
|
|
|
|
|
0.65 |
|
|
|
|
|
|
|
|
|
|
|
|
|
|
|
0.60 |
|
|
|
|
|
|
|
|
|
|
|
|
|
|
|
0.55 |
|
|
|
|
|
|
|
|
|
|
|
|
|
|
|
0.50 |
|
|
|
|
|
|
|
|
|
|
|
|
|
|
|
0.45 |
|
|
|
|
|
|
|
|
|
|
|
|
|
|
|
0.40 |
|
|
|
|
|
|
|
|
|
|
|
|
|
|
|
0.35 |
|
|
|
|
|
|
|
|
|
|
|
|
|
|
|
0.30 |
|
|
|
|
|
|
|
|
|
|
|
|
|
|
|
0.25 |
|
|
|
|
|
|
|
|
|
|
|
|
|
|
|
0.20 |
Apr-15 |
Jul-15 |
Oct-15 |
|
Apr-16 |
Jul-16 |
Oct-16 |
|
Apr-17 |
Jul-17 |
Oct-17 |
|
Apr-18 |
Jul-18 |
Oct-18 |
Jan-15 |
Jan-16 |
Jan-17 |
Jan-18 |
||||||||||||
|
|
|
|
Domestic China |
|
|
|
|
Global |
|
|
|
|
||
Source: Company data, Goldman Sachs Global Investment Research |
Source: PVInsights, PVnews, Goldman Sachs Global Investment Research |
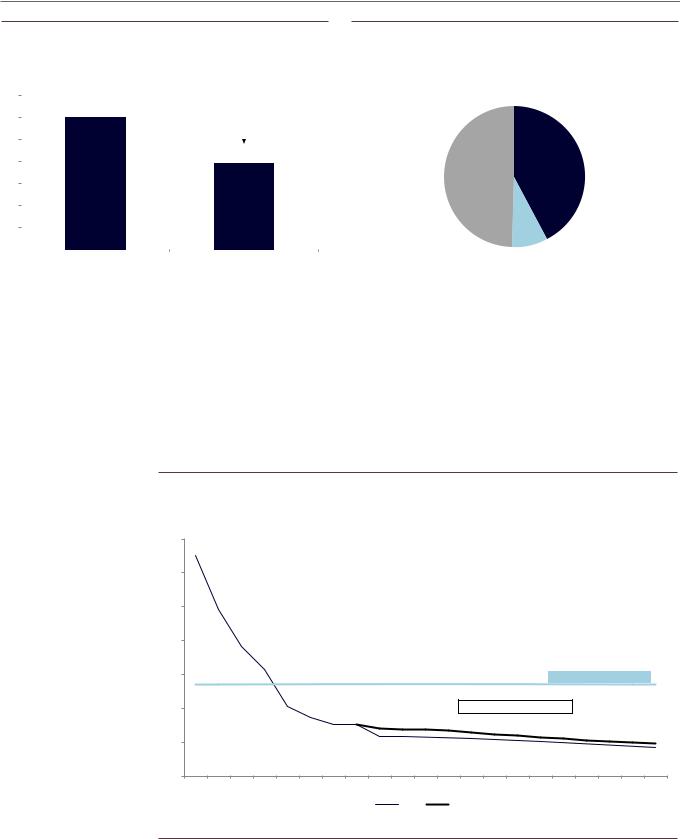
European module prices to fall 35% with the end of solar anti-dumping measures
Europe can benefit from the decrease in global module prices as the EU removed its solar anti-dumping measures at the end of the summer. The decision was considered to be in the “best interest of the EU” and that it “takes into account the EU’s renewable energy targets”.We now expect European module prices to converge towards global prices, a 35% drop. This should lower LCOE given modules represent half of the input cost. In turn, we expect the drop to drive more installations to reach renewable targets.
3 December 2018 |
16 |
vk.com/id446425943
Goldman Sachs
Power Shift 2019: Nextgen Power
Exhibit 18: European module to fall 35% and converge to global |
|
|
Exhibit 19: Module accounts for half of solar input costs |
|||||||
prices |
|
|
|
|
|
Solar plant input cost split |
|
|||
Module prices, €cents/W |
|
|
|
|
|
|
|
|||
35 |
|
|
|
|
|
|
|
|
|
|
|
|
|
|
|
|
|
|
|
||
30 |
|
|
30 |
|
-35% |
|
|
|
|
|
|
|
|
|
|
|
|
||||
|
|
|
|
|
|
|
|
|
|
|
25 |
|
|
|
|
|
|
|
|
|
|
20 |
|
|
|
19 |
|
|
|
|
|
|
|
|
|
|
|
|
|
|
|
Installation |
|
|
|
|
|
|
|
|
|
|
Module |
|
|
|
|
|
|
|
|
|
|
42% |
|
15 |
|
|
|
|
|
|
50% |
|||
|
|
|
|
|
|
|
||||
10 |
|
|
|
|
|
|
|
|
|
|
5 |
|
|
|
|
|
|
|
|
|
Inverter |
|
|
|
|
|
|
|
|
|
|
8% |
0 |
|
|
|
|
|
|
|
|
|
|
|
|
European anti-dumping |
Global average price |
|
|
|
|
|||
|
|
|
|
|
|
|
||||
|
|
|
|
|||||||
Source: EU, PVInsights, Goldman Sachs Global Investment Research |
|
|
Source: IRENA, Goldman Sachs Global Investment Research |
|||||||
We lower our LCOE forecasts by 10%
We update our LCOE forecasts to reflect lower module prices across Europe and now forecast 2018-30E solar LCOE to be 10% lower on average across Europe. In Spain, we estimate solar LCOE at €23.5/MWh for 2019, c.50% below the forward curve, and expect it to drop to €17/MWh by 2030. Although the absolute LCOE level will vary by country, we forecast the same reduction trend across Europe; the economics are particularly compelling – for now – in Spain and Italy.
Exhibit 20: Spain LCOE is c.50% below forwards and continues to fall
Spain: Solar PV LCOE evolution vs 2019 power forward, €/MWh
140 |
|
|
|
|
|
|
|
|
|
|
|
|
|
|
|
|
|
|
|
|
120 |
€ 131 |
|
|
|
|
|
|
|
|
|
|
|
|
|
|
|
|
|
|
|
|
|
|
|
|
|
|
|
|
|
|
|
|
|
|
|
|
|
|
|
|
100 |
|
€ 98 |
|
|
|
|
|
|
|
|
|
|
|
|
|
|
|
|
|
|
|
|
|
|
|
|
|
|
|
|
|
|
|
|
|
|
|
|
|
|
|
80 |
|
|
€ 77 |
|
|
|
|
|
|
|
|
|
|
|
|
|
|
|
|
|
60 |
|
|
|
€ 63 |
|
|
|
|
|
|
|
|
|
|
|
2019 Fwd: €61/MWh |
|
|||
|
|
|
|
|
|
|
|
|
|
|
|
|
|
|
|
|||||
|
|
|
|
|
|
|
|
|
|
|
|
|
|
|
|
|
||||
40 |
|
|
|
€ 41 |
|
|
|
|
|
|
|
Merchant PPA opportunity |
|
|
|
|
||||
|
|
|
|
€ 35 |
|
|
|
|
|
|
|
|
|
|
|
|
|
|
|
|
|
|
|
|
|
€ 31 |
€ 30 |
|
|
|
|
|
|
|
|
|
|
|
|
|
|
20 |
|
|
|
|
|
|
|
|
|
|
|
|
|
|
|
|
|
|
||
|
|
|
|
|
|
|
€ 24 |
€ 24 |
€ 23 |
€ 22 |
€ 22 |
€ 22 |
€ 21 |
|
|
|
|
|
|
|
|
|
|
|
|
|
|
|
€ 20 |
€ 20 |
€ 19 |
€ 18 |
€ 18 |
€ 17 |
|||||||
|
|
|
|
|
|
|
|
|
|
|
|
|
||||||||
0 |
|
|
|
|
|
|
|
|
|
|
|
|
|
|
|
|
|
|
|
|
2010 |
2011 |
2012 |
2013 |
2014 |
2015 |
2016 |
2017 |
2018E 2019E 2020E 2021E 2022E 2023E 2024E 2025E 2026E 2027E 2028E 2029E 2030E |
||||||||||||
|
|
|
|
|
|
|
|
|
New |
|
Old |
|
|
|
|
|
|
|
|
|
Source: Bloomberg, IRENA, Goldman Sachs Global Investment Research
3 December 2018 |
17 |

vk.com/id446425943
Goldman Sachs
Power Shift 2019: Nextgen Power
Dissecting the reduction in solar LCOE
We expect the reduction in solar PV LCOE to come from lower costs/kW, higher efficiency (load factors) and an improvement in opex. This would outweigh the increase in cost of capital that we assume (+200 bp) driven by increasing bond yields. The exhibit below shows the example for Spain, where we expect a c.30% reduction in costs per MWh.
Exhibit 21: We expect LCOE to fall mainly driven by lower capex and higher load factors: -30% during 2019 and 2030
Solar LCOE drivers 2018-2030 (Spain, €/MWh)
25
24
-8
20
4 -5
-1 |
17 |
|
|
15
10
5
0
2019E |
Capex |
Opex |
Cost of capital |
Load factor |
2030E |
Source: Goldman Sachs Global Investment Research
Regional LCOE forecasts
We model solar LCOEs across major European markets and estimate 10%-25% reduction by 2023 and 20%-40% by 2030. The greater-than-expected cost reduction in solar and surge in wholesale forward curves have led to a unique situation in the history of the industry: in 2019, solar will be meaningfully cheaper than wholesale forward curves, in all European market, with the only exception the Nordics.
3 December 2018 |
18 |

vk.com/id446425943
Goldman Sachs
Power Shift 2019: Nextgen Power
Exhibit 22: The spread between LCOEs and forwards suggests that Spain and Italy will be at the forefront of the rise in solar
Solar PV LCOEs vs 2019 forward prices in orange (€/MWh)
€ 65 |
|
|
|
|
|
|
|
€66 |
|
|
|
|
|
|
|
|
|
|
|
|
|
€67 |
|
|
|
|
|
|
|
||
€ 55 |
|
|
€61 |
|
|
|
|
|
|
|
|
|
€57 |
|
|
|
|
|
|
|
|
|
|
|
|
|
|
|
|
|
|
|
|
|
|
|
|
|
|
|
|
|
|
|
|
|
|
|
|
|
|
|
|
|
|
|
|
|
|
|
|||
|
|
|
|
|
|
|
|
|
|
|
|
|
|
|
|
|
|
|
|
|
|
|
|
|
|
|
|
|
|
|
|
|
|
|
|
|
|
|
|
|
|
|
|
|
|
|
|
|
|
|
|
|
|
|
|
|
|
|
|
|
|
|
|
|
|
|
|
|
|
|
|
|
|
|
|
|
|
|
|
|
|
|
|
|
|
|
|
|
|
|
|
|
|||
|
|
|
|
|
|
|
|
|
|
|
|
|
|
|
|
|
|
€52 |
|
|
€ 47 € 47 |
|
€ 48 |
||||||||
€ 45 |
|
|
|
|
|
|
|
|
|
|
|
|
|
|
|
|
|
|
|
|
|
|
|
|
|
|
|
€ 45 |
|||
|
|
|
|
|
|
|
|
|
|
|
|
|
|
|
|
|
|
|
|
|
|
|
|
|
|
|
|
|
|
|
|
|
|
|
|
|
|
|
|
|
|
|
|
|
|
|
|
|
|
|
|
|
|
|
|
|
|
|
|
|
|||
|
|
|
|
|
|
|
|
|
|
|
|
|
|
|
|
|
|
|
|
|
|
|
|
|
|
|
|
€41 |
|
||
|
|
|
|
|
|
|
|
|
|
|
|
|
|
|
|
|
€ 35 |
|
|
|
|
|
|
|
|
|
|
|
|||
€ 35 |
|
|
|
|
|
|
€ 32 |
|
|
|
|
|
|
|
|
€ 33 |
|
|
€ 33 |
||||||||||||
|
|
|
|
|
|
|
|
|
|
|
|
|
€ 31 |
|
|
|
|
||||||||||||||
|
|
|
|
|
|
|
|
|
|
|
|
|
|
|
|
|
|
|
|
|
|
|
|
|
|
|
|
|
|||
|
|
|
|
|
|
|
|
€ 27 |
|
€ 29 € 27 |
|
|
€ 25 |
|
|
|
|
|
|
|
|
|
|
|
|||||||
€ 25 |
|
€ 24 |
|
|
|
|
|
|
|
|
|
|
|
|
|
|
|
|
|
|
|
|
|
|
|
||||||
|
|
|
|
|
|
|
|
€ 22 |
|
|
|
|
|
|
|
|
|
|
|
|
|
|
|
|
|||||||
|
|
€ 22 |
|
|
€ 21 |
|
|
|
|
|
|
|
|
|
|
|
|
|
|
|
|
|
|
||||||||
|
|
|
|
|
|
|
|
|
|
|
|
|
|
|
|
|
|
|
|
|
|
|
|||||||||
|
|
|
€ 17 |
|
|
|
|
|
|
|
|
|
|
|
|
|
|
|
|
|
|
|
|
|
|
|
|
|
|
||
€ 15 |
|
|
|
|
|
|
|
|
|
|
|
|
|
|
|
|
|
|
|
|
|
|
|
|
|
|
|
|
|
|
|
€ 5 |
€ - |
|
|
|
|
|
|
|
|
|
|
|
|
|
|
|
|
|
|
|
|
|
|
|
|
|
|
||||
|
|
|
|
|
|
|
|
|
|
|
|
|
|
|
|
|
|
|
|
|
|
|
|
|
|
|
|||||
|
|
|
|
|
|
|
|
|
|
|
|
|
|
|
|
|
|
|
|
|
|
|
|
|
|
|
|
|
|
|
|
-€ 5 |
|
2019E 2023E 2030E |
|
2019E 2023E 2030E |
|
2019E 2023E 2030E |
|
2019E 2023E 2030E |
|
2019E 2023E 2030E |
|
2019E 2023E 2030E |
|
|
|||||||||||||||||
|
|
Spain |
|
|
Italy |
|
|
France |
|
|
Germany |
|
|
UK |
|
|
Nordic |
|
|
||||||||||||
|
|
|
|
|
|
|
|
|
|
|
|
|
|
|
|||||||||||||||||
Source: Goldman Sachs Global Investment Research, Bloomberg
3 December 2018 |
19 |