

vk.com/id446425943
Goldman Sachs
Global solar perspective
Power Shift 2019: Nextgen Power
For nearly 20 years, the solar industry has been growing at +c.50% CAGR. Yet currently solar PV accounts for a mere c.1.5% of the global power output. Estimates by the IEA (which has historically been too conservative) show that annual capacity additions globally could continue at a 10% pace until 2025-30. Even still, by then, solar PV would still account for a mere 6% of the total energy mix (based on capacity, it would be less than half on output).
Solar capacity additions: +c.50% pa since 2000
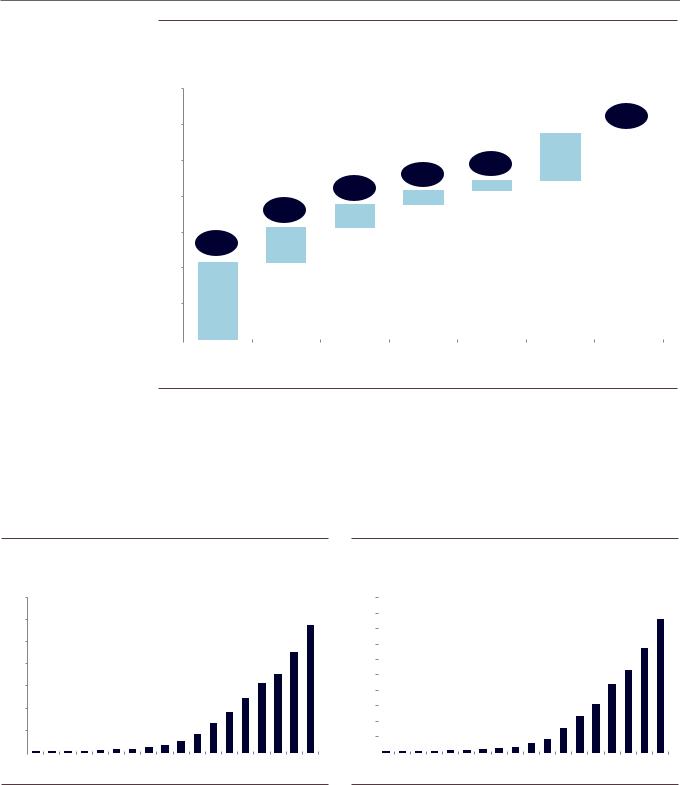
Global solar capacity has been growing at a +c.50% rate pa on average since 2000. Growth has slowed in recent years given the higher base but remains at a healthy c.30% per year. Since 2000, the global invested capital in solar has reached close to US$1tn in 2017.
Exhibit 43: Global PV capacity began growing exponentially in the |
|
Exhibit 44: ... transforming solar into a near US$1 tn industry |
|
|
|||||||||||||||||||||||||||||||||||||||
mid-2000s... |
|
|
|
|
|
|
|
|
|
|
|
|
|
|
|
|
|
|
Global invested capital in solar PV installations (US$ bn) |
|
|
|
|
|
|||||||||||||||||||
Cumulative solar capacity installed globally, GW |
|
|
|
|
|
|
|
|
|
|
|
|
|
|
|
|
|
|
|
|
|
|
|
|
|
|
|
|
|
|
|||||||||||||
450 |
|
|
|
|
|
|
|
|
|
|
|
|
|
|
|
|
|
|
401 |
|
1,200 |
|
|
|
|
|
|
|
|
|
|
|
|
|
|
|
|
|
|
|
|
|
|
|
|
|
|
|
|
|
|
|
|
|
|
|
|
|
|
|
|
|
|
|
|
|
|
|
|
|
|
|
|
|
|
|
|
|
|
|
|||||||
400 |
|
|
|
|
|
|
|
|
|
|
|
|
|
|
|
|
|
|
|
|
|
|
|
|
|
|
|
|
|
|
|
|
|
|
|
|
|
|
|
|
|
|
|
|
|
|
|
|
|
|
|
|
|
|
|
|
|
|
|
|
|
|
|
1,000 |
|
|
|
|
|
|
|
|
|
|
|
|
|
|
|
|
|
|
|
960 |
|
||
|
|
|
|
|
|
|
|
|
|
|
|
|
|
|
|
|
|
|
|
|
|
|
|
|
|
|
|
|
|
|
|
|
|
|
|
|
|
|
|
|
|||
350 |
|
|
|
|
|
|
|
|
|
|
|
|
|
|
|
|
|
|
|
|
|
|
|
|
|
|
|
|
|
|
|
|
|
|
|
|
|
|
|
|
|
||
|
|
|
|
|
|
|
|
|
|
|
|
|
|
|
|
|
301 |
|
|
|
|
|
|
|
|
|
|
|
|
|
|
|
|
|
|
|
|
|
|
814 |
|
|
|
300 |
|
|
|
|
|
|
|
|
|
|
|
|
|
|
|
|
|
|
|
800 |
|
|
|
|
|
|
|
|
|
|
|
|
|
|
|
|
|
|
|
|
|||
|
|
|
|
|
|
|
|
|
|
|
|
|
|
|
|
|
|
|
|
|
|
|
|
|
|
|
|
|
|
|
|
|
|
|
|
|
693 |
|
|
|
|||
|
|
|
|
|
|
|
|
|
|
|
|
|
|
|
|
|
|
|
|
|
|
|
|
|
|
|
|
|
|
|
|
|
|
|
|
|
|
|
|
|
|
|
|
250 |
|
|
|
|
|
|
|
|
|
|
|
|
|
|
|
|
226 |
|
|
|
600 |
|
|
|
|
|
|
|
|
|
|
|
|
|
|
|
|
604 |
|
|
|
|
|
200 |
|
|
|
|
|
|
|
|
|
|
|
|
|
|
|
177 |
|
|
|
|
|
|
|
|
|
|
|
|
|
|
|
|
|
|
|
517 |
|
|
|
|
|
||
|
|
|
|
|
|
|
|
|
|
|
|
|
|
|
|
|
|
|
|
|
|
|
|
|
|
|
|
|
|
|
|
|
|
|
418 |
|
|
|
|
|
|
||
|
|
|
|
|
|
|
|
|
|
|
|
|
|
|
137 |
|
|
|
|
|
|
|
|
|
|
|
|
|
|
|
|
|
|
|
|
340 |
|
|
|
|
|
|
|
150 |
|
|
|
|
|
|
|
|
|
|
|
|
|
|
|
|
|
|
|
400 |
|
|
|
|
|
|
|
|
|
|
|
|
|
|
|
|
|
|
|
|
|||
|
|
|
|
|
|
|
|
|
|
|
|
|
99 |
|
|
|
|
|
|
|
|
|
|
|
|
|
|
|
|
|
|
|
|
|
|
|
|
|
|
||||
100 |
|
|
|
|
|
|
|
|
|
|
|
|
70 |
|
|
|
|
|
|
|
|
|
|
|
|
|
|
|
|
|
|
|
|
235 |
|
|
|
|
|
|
|
|
|
|
|
|
|
|
|
|
|
|
|
|
|
|
|
|
|
|
|
|
|
|
|
|
|
|
|
|
|
|
|
|
129 168 |
|
|
|
|
|
|
|
|
||||
|
|
|
|
|
|
|
|
|
|
|
39 |
|
|
|
|
|
|
|
200 |
|
|
|
|
|
|
|
|
|
|
|
|
|
|
|
|
|
|
|
|||||
50 |
|
1 |
1 |
1 |
2 |
3 |
4 |
6 |
8 |
15 |
23 |
|
|
|
|
|
|
|
|
|
|
15 |
20 |
26 |
33 |
46 |
61 |
73 |
91 |
|
|
|
|
|
|
|
|
|
|||||
0 |
|
|
|
|
|
|
|
|
|
|
|
0 |
|
|
|
|
|
|
|
|
|
|
|
|
|
|
|
|
|||||||||||||||
|
|
|
|
|
|
|
|
|
|
|
|
|
|
|
|
|
|
|
|
|
|
|
|
|
|
|
|
|
|
|
|
|
|
|
|
|
|
|
|
|
|||
|
|
|
|
|
|
|
|
|
2008 |
|
|
|
|
|
|
|
|
|
|
|
|
|
|
|
|
|
|
|
|
|
|
2010 |
|
|
|
|
|
|
|
|
|||
2000 |
2001 |
2002 |
2003 |
2004 |
2005 |
2006 |
2007 |
2009 |
2010 |
2011 |
2012 |
2013 |
2014 |
2015 |
2016 |
2017 |
|
2000 |
2001 |
2002 |
2003 |
2004 |
2005 |
2006 |
2007 |
2008 |
2009 |
2011 |
2012 |
2013 |
2014 |
2015 |
2016 |
2017 |
|
||||||||
|
|
|
|
|
|
|
|
|
|
|
|
|
|
||||||||||||||||||||||||||||||
Source: Goldman Sachs Global Investment Research, BP, SolarPower Europe |
|
|
|
|
|
Source: Goldman Sachs Global Investment Research, BP, IRENA |
|
|
|
|
|
|
|
||||||||||||||||||||||||||||||
Europe has led the “solar revolution” and currently accounts for about one-third of the global PV installed base. Germany, Italy and – quite surprisingly given low irradiation levels – the UK have led the effort so far. Spain, as seen in Exhibit 45, has fallen behind.
3 December 2018 |
31 |
vk.com/id446425943
Goldman Sachs
Power Shift 2019: Nextgen Power
Exhibit 45: Europe accounts for about one-third of global solar capacity
European solar capacity additions in GW (bars) and as % of 2016 total generating capacity (ovals)
140
120 |
|
|
|
|
|
|
|
c.10% |
||
|
|
|
|
|
|
|
|
|
||
100 |
|
|
|
|
6% |
26 |
|
|
|
|
|
|
|
|
|
|
|
||||
|
|
|
|
6% |
|
|
|
|
||
|
|
|
|
6 |
|
|
|
|
||
80 |
|
|
16% |
8 |
|
|
|
|
||
|
|
|
|
|
|
|
|
|||
|
|
17% |
13 |
|
|
|
|
|
|
|
|
|
|
|
|
|
|
|
|
||
60 |
|
|
|
|
|
|
|
115 |
|
|
22% |
19 |
|
|
|
|
|
|
|||
|
|
|
|
|
|
|
||||
40 |
|
|
|
|
|
|
|
|
|
|
43 |
|
|
|
|
|
|
|
|
||
20 |
|
|
|
|
|
|
|
|
|
|
0 |
|
|
|
|
|
|
|
|
|
|
Germany |
Italy |
UK |
France |
Spain |
Other |
2016 Capacity |
||||
|
||||||||||
2010-2016 |
2010-2016 |
2010-2016 |
2010-2016 |
2010-2016 |
2010-2016 |
|
|
|
||
Source: BP, REE, Terna, RTE, DECC, BNetzA, Goldman Sachs Global Investment Research
Solar still just c.1.5% of global energy mix
Despite significant growth, solar remains a minor power generation technology globally. Solar capacity now accounts for 6% of total capacity; in terms of share of output, the global market share of solar is c.1.5%. In Europe, solar accounts for 9% of capacity and 2% of output.
Exhibit 46: Solar accounts for 6% of global installed capacity
Global solar PV capacity as a % of capacity
7.0%
6.0% |
|
|
|
|
|
|
|
|
|
6% |
|
|
|
|
|
|
|
|
|
|
|
5.0% |
|
|
|
|
|
|
|
|
|
5% |
|
|
|
|
|
|
|
|
|
|
|
4.0% |
|
|
|
|
|
|
|
|
|
4% |
|
|
|
|
|
|
|
|
|
|
3% |
3.0% |
|
|
|
|
|
|
|
|
|
2% |
|
|
|
|
|
|
|
|
|
|
|
2.0% |
|
|
|
|
|
|
|
|
|
2% |
|
|
|
|
|
|
|
|
|
1% |
|
|
|
|
|
|
|
|
|
|
|
|
1.0% |
|
|
|
|
|
|
|
|
|
1% |
|
|
|
|
|
|
|
|
0% |
0% |
|
0% |
0% |
0% |
0% |
0% |
0% |
0% |
0% |
|||
0.0% |
|
|
|
|
|
|
|
|
|
|
|
|
|
|
|
|
|
|
|
|
|
2000 2001 2002 2003 2004 2005 2006 2007 2008 2009 2010 2011 2012 2013 2014 2015 2016 2017
Exhibit 47: ...and c.1.5% of output
Global solar PV output as a % of total output
2.0% |
|
|
|
1.7% |
|
|
|||
1.8% |
|
|
|
|
1.6% |
|
|
|
|
1.4% |
|
|
|
1.3% |
|
|
|
|
|
1.2% |
|
|
|
1.1% |
|
|
|
|
|
1.0% |
|
|
|
0.9% |
|
|
|
|
|
0.8% |
|
|
|
0.6% |
|
|
|
|
|
0.6% |
|
|
|
0.5% |
|
|
|
|
|
0.4% |
|
|
|
0.3% |
0.2% |
|
|
|
0.2% |
|
0.0% |
0.1% |
0.1% |
|
0.0% |
|
|
|
|
|
|
|
|
|
|
|
|
|
|
2000 2001 2002 2003 2004 2005 2006 2007 2008 2009 2010 2011 2012 2013 2014 2015 2016 2017
Source: BP, IEA |
Source: BP, IEA |
3 December 2018 |
32 |

vk.com/id446425943
Goldman Sachs
Power Shift 2019: Nextgen Power
Exhibit 48: Solar accounts for 9% of European installed capacity... |
|
Exhibit 49: ...and c.2% of output |
|
|
|
|
|
|
|
|
|
|
|
|||||||||||||||||||||||||||||
European solar PV capacity as a % of capacity |
|
|
|
|
|
|
|
|
European solar PV output as a % of total output |
|
|
|
|
|
|
|
||||||||||||||||||||||||||
10.0% |
|
|
|
|
|
|
|
|
|
|
|
|
|
|
|
|
|
|
9% |
|
2.5% |
|
|
|
|
|
|
|
|
|
|
|
|
|
|
|
|
|
|
2.3% |
|
|
|
|
|
|
|
|
|
|
|
|
|
|
|
|
|
|
|
|
|
|
|
|
|
|
|
|
|
|
|
|
|
|
|
|
|
|
|
|
|
|
|
||
9.0% |
|
|
|
|
|
|
|
|
|
|
|
|
|
|
|
9% |
|
|
|
|
|
|
|
|
|
|
|
|
|
|
|
|
|
|
|
|
|
|
2.1% |
|
|
|
|
|
|
|
|
|
|
|
|
|
|
|
|
|
|
8% |
8% |
|
|
|
|
|
|
|
|
|
|
|
|
|
|
|
|
|
|
|
|
|
|
|
|||
8.0% |
|
|
|
|
|
|
|
|
|
|
|
|
|
|
8% |
|
|
|
|
2.0% |
|
|
|
|
|
|
|
|
|
|
|
|
|
|
|
|
|
|
|
|
||
|
|
|
|
|
|
|
|
|
|
|
|
|
|
|
|
|
|
|
|
|
|
|
|
|
|
|
|
|
|
|
|
|
|
|
|
|
|
|
||||
|
|
|
|
|
|
|
|
|
|
|
|
|
|
|
|
|
|
|
|
|
|
|
|
|
|
|
|
|
|
|
|
|
|
|
|
1.8% |
|
|
|
|||
|
|
|
|
|
|
|
|
|
|
|
|
|
|
|
|
|
|
|
|
|
|
|
|
|
|
|
|
|
|
|
|
|
|
|
|
|
|
|
|
|
|
|
7.0% |
|
|
|
|
|
|
|
|
|
|
|
|
|
7% |
|
|
|
|
|
|
|
|
|
|
|
|
|
|
|
|
|
|
|
|
|
|
|
|
|
|
|
|
6.0% |
|
|
|
|
|
|
|
|
|
|
|
|
5% |
|
|
|
|
|
|
|
1.5% |
|
|
|
|
|
|
|
|
|
|
|
|
|
|
|
1.3% |
|
|
|
|
|
|
|
|
|
|
|
|
|
|
|
|
|
|
|
|
|
|
|
|
|
|
|
|
|
|
|
|
|
|
|
|
|
|
|
|
|
|
|
|
|
|
||
5.0% |
|
|
|
|
|
|
|
|
|
|
|
|
|
|
|
|
|
|
|
|
|
|
|
|
|
|
|
|
|
|
|
|
|
|
|
|
|
|
|
|
|
|
4.0% |
|
|
|
|
|
|
|
|
|
|
|
3% |
|
|
|
|
|
|
|
|
1.0% |
|
|
|
|
|
|
|
|
|
|
|
|
|
|
|
|
|
|
|
|
|
|
|
|
|
|
|
|
|
|
|
|
|
|
|
|
|
|
|
|
|
|
|
|
|
|
|
|
|
|
|
|
|
|
|
|
|
|
|
|
|
|
|
|
3.0% |
|
|
|
|
|
|
|
|
|
|
|
|
|
|
|
|
|
|
|
|
|
|
|
|
|
|
|
|
|
|
|
|
|
|
|
|
0.6% |
|
|
|
|
|
2.0% |
|
|
|
|
|
|
|
|
|
|
2% |
|
|
|
|
|
|
|
|
|
0.5% |
|
|
|
|
|
|
|
|
|
|
|
|
|
0.4% |
|
|
|
|
|
|
|
|
|
|
|
|
|
|
|
|
1% |
|
|
|
|
|
|
|
|
|
|
|
|
|
|
|
|
|
|
|
|
|
|
|
|
|
|
|
|
|
||||
|
|
|
|
|
|
|
|
|
|
|
|
|
|
|
|
|
|
|
|
|
|
|
|
|
|
|
|
|
|
|
|
|
|
0.2% |
|
|
|
|
|
|
|
|
1.0% |
|
|
|
|
|
|
|
0% |
1% |
|
|
|
|
|
|
|
|
|
|
|
|
|
|
|
|
|
|
|
|
|
|
|
|
0.1% |
|
|
|
|
|
|
|
|
|
0% |
0% |
0% |
0% |
0% |
0% |
|
|
|
|
|
|
|
|
|
|
|
|
|
|
|
|
|
|
|
|
|
|
0.0% |
0.1% |
|
|
|
|
|
|
|
|
||||
0.0% |
|
|
|
|
|
|
|
|
|
|
|
|
|
|
|
|
|
|
|
|
0.0% |
|
|
|
|
|
|
|
|
|
|
|
|
|
|
|
|
|
|
|
|
|
|
|
|
|
|
|
|
|
|
|
|
|
|
|
|
|
|
|
|
|
|
|
|
|
|
|
|
|
|
|
|
|
|
|
|
|
|
|
|
|
|||
|
|
2000 |
2001 |
2002 |
2003 |
2004 |
2005 |
2006 |
2007 |
2008 |
2009 |
2010 |
2011 |
2012 |
2013 |
2014 |
2015 |
2016 |
2017 |
|
2000 |
2001 |
2002 |
2003 |
2004 |
2005 |
2006 |
2007 |
2008 |
2009 |
2010 |
2011 |
2012 |
2013 |
2014 |
2015 |
2016 |
2017 |
|
|||
|
|
|
|
|
|
|
|
|
|
|
|
|
|
|
|
|
|
|
|
|
|
|
|
|
|
|
|
|
|
|
|
|
|
|
|
|
||||||
Source: BP, IEA |
|
|
|
|
|
|
|
|
|
|
|
|
|
|
|
|
|
|
Source: BP, IEA |
|
|
|
|
|
|
|
|
|
|
|
|
|
|
|
|
|
||||||
Solar PV LCOE has fallen by 80% since 2010
The significant deflation in solar PV LCOE since 2010 has been driven by a combination of three key factors: (1) lower investment costs; (2) lower cost of capital; and (3) more efficient solar panels.
Exhibit 50: Solar LCOE has fallen 80% since 2010
Spain solar PV LCOE evolution, €/MWh
€ 140 |
|
|
|
|
|
|
|
|
€ 120 |
€ 131 |
|
|
|
|
|
|
|
|
|
|
|
|
|
|
|
|
€ 100 |
|
€ 98 |
|
|
|
|
|
|
|
|
|
|
|
|
|
|
|
€ 80 |
|
|
€ 77 |
|
|
|
|
|
€ 60 |
|
|
|
€ 63 |
|
|
|
|
|
|
|
|
|
|
|
|
|
€ 40 |
|
|
|
€ 41 |
|
|
|
|
|
|
|
|
€ 35 |
|
|
|
|
€ 20 |
|
|
|
|
€ 31 |
€ 30 |
€ 26 |
|
|
|
|
|
|
||||
|
|
|
|
|
|
|
|
|
€ - |
|
|
|
|
|
|
|
|
2010 |
2011 |
2012 |
2013 |
2014 |
2015 |
2016 |
2017 |
2018E |
Exhibit 51: Capex and cost of capital are the two main components of LCOE
Spain solar LCOE 2018 split by components €/MWh
30 |
|
|
|
26 |
|
|
|
|
|
25 |
|
|
|
|
20 |
|
|
10 |
|
|
|
|
|
|
15 |
|
|
|
|
|
|
6 |
|
|
10 |
|
|
|
|
5 |
10 |
|
|
|
0 |
|
|
|
|
|
Capex |
Opex |
Cost of capital |
LCOE |
Source: Goldman Sachs Global Investment Research, IRENA |
Source: Goldman Sachs Global Investment Research, IRENA |
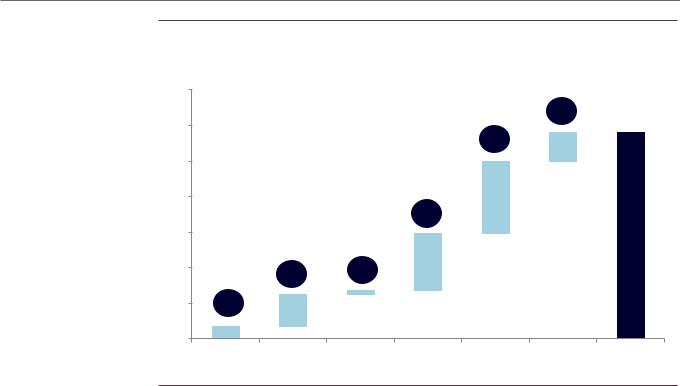
Lower module and installation expenses behind the 70% reduction in costs vs 2009
Exhibit 52 details the key drivers behind the c.70% investment cost reduction for utility-scale solar PV projects since 2009. Module prices and installation costs have on average accounted for 49% and 42% of the absolute cost reduction (in US$/kW) over that period.
3 December 2018 |
33 |

vk.com/id446425943
Goldman Sachs
Power Shift 2019: Nextgen Power
Exhibit 52: Solar investment costs have fallen c.70% vs 2009 on lower module and installation costs
Global investment cost (US$/kW) for utility-scale solar PV projects (GSe based on company and IRENA data)
$ / kW
2,500 |
|
|
2,161 |
|
|
|
|
|
|
|
|
|
|
|
|
|
|
|
|
|
|
|
|
|
|
|
|
|
|
|
|
|
|
|
|
|
|
|
|
|
|
|
|
|
|
|
|
|
|||
|
|
|
|
|
|
|
|
|
|
|
|
|
|
|
|
|
|
|
|
|
|
|
|
|
|
2,000 |
|
|
|
|
|
|
|
|
|
|
|
|
|
|
|
|
|
|
|
|
|
|
|
|
|
|
|
|
1,801 |
|
|
|
|
|
|
|
|
|
|
|
|
|
|
|
|
|
|
|
|
|
|
|
|
|
|
|
|
|
|
|
|
|
|
|
|
|
|
|
|
|
|
|
|
|
|
|
|
|
|
|
|
|
|
|
|
|
|
|
|
|
|
|
|
|
|
|
|
|
|
|
|
|
|
|
|
|
|
|
|
1,530 |
|
|
|
|
|
|
|
|
|
|
|
|
|
|
|
|
|
|
|
1,500 |
|
|
|
|
|
|
|
|
|
|
|
|
|
|
|
|
|
|
|
|
|
|
|
|
|
|
|
|
|
|
|
|
|
1,238 |
|
|
|
|
|
|
|
|
|
|
|
|
|
|
|
|
|
|
|
|
|
|
|
|
|
|
|
|
1,125 |
|
|
|
|
|
|
|
|
|
|
|
|
|
|
|
|
|
|
|
|
|
|
|
|
|
|
|
|
|
|
|
|
|
|
|
|
|
|
|
|
|
|
|
|
|
|
|
|
|
|
|
|
|
|
|
|
990 |
|
|
|
|
|
|
|
|
|
|
|
|
|
|
|
|
|
|
|
|
|
|
|
|
|
|
|
|
|
|
|||||
1,000 |
|
|
|
|
|
|
|
|
|
|
|
|
|
|
|
|
900 |
|
|
|
|
|
|
|
|
|
|
|
|
|
|
|
|
|
|
|
|
|
|
|
|
|
|
|
|
|
|
|
|
||
|
|
|
|
|
|
|
|
|
|
|
|
|
|
|
|
|
|
788 |
|
|
|
|
|
||
|
|
|
|
|
|
|
|
|
|
|
|
|
|
|
|
|
|
|
|
|
|
|
|
|
|
|
|
|
|
|
|
|
|
|
|
|
|
|
|
|
|
|
|
|
|
|
732 |
|
|
|
|
|
|
|
|
|
|
|
|
|
|
|
|
|
|
|
|
|
|
|
|
|
|
|
|
|
|
|
|
|
|
|
|
|
|
|
|
|
|
|
|
|
|
|
|
|
|
|
|
|
|
580 |
|
500 |
|
|
|
|
|
|
|
|
|
|
|
|
|
|
|
|
|
|
|
|
|
|
|
|
|
0 |
|
|
|
|
|
|
|
|
|
|
|
|
|
|
|
|
|
|
|
|
|
|
|
|
|
2009 |
2010 |
2011 |
2012 |
|
2013 |
2014 |
|
2015 |
2016 |
2017 |
|
2018E |
|||||||||||||
|
|
|
|
|
|
|
|
Module |
|
Inverter |
|
|
Installation |
|
|
|
|
|
|
|
|
||||
|
|
|
|
|
|
|
|
|
|
|
|
|
|
|
|
|
|
||||||||
|
|
|
|
|
|
|
|
|
|
|
|
|
|
|
|
|
|
||||||||
Source: Goldman Sachs Global Investment Research, Company data, IRENA
Panel efficiency has improved >30% in recent years
Since 2012, technological improvements have led to efficiency improvements ranging
between 50% (for lab modules) and 30% (for commercially available panels).
Exhibit 53: Module efficiency has significantly improved over the past five years
Solar PV module efficiency
26% |
|
|
|
|
|
|
|
|
|
|
|
|
24% |
24% |
|
|
|
|
|
|
|
|
|
|
22% |
22% |
|
22% |
|
|
|
|
21% |
|
|
|
|
|
|
||
|
|
|
20% |
|
|
|
|
|
|
|
|
|
|
20% |
|
19% |
|
|
19% |
|
|
|
|
|
|
||
|
|
|
18% |
|
|
|
|
|
|
|
|
|
|
18% |
17% |
|
17% |
|
17% |
17% |
|
|
|
|
|||
|
|
16% |
|
16% |
|
|
|
|
|
|
|
||
16% |
|
|
|
|
|
|
|
14% |
|
14% |
|
|
|
14% |
13% |
13% |
|
|
|
|
|
|
|
|
|
|
|
12% |
|
|
|
|
|
|
10% |
|
|
|
|
|
|
|
2012 |
2013 |
2014 |
2015 |
2016 |
2017 |
Record Lab Cell |
|
Record Lab Module |
|
First Solar Fleet Average |
|
|
Source: First Solar, IRENA
3 December 2018 |
34 |
vk.com/id446425943
Goldman Sachs
Power Shift 2019: Nextgen Power
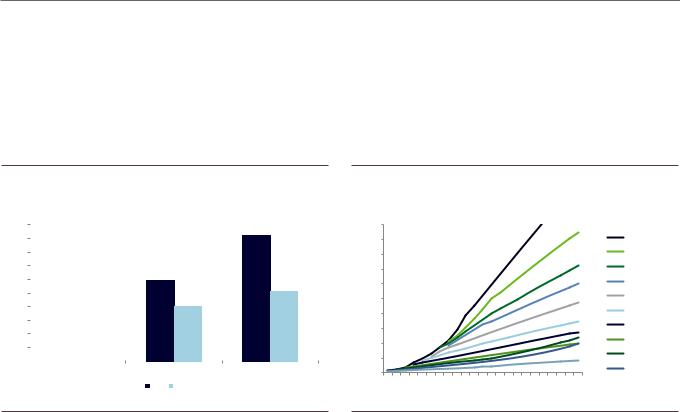
Growth to 2030 likely to still be 10% pa
Based on IEA forecasts, we expect sustained solar capacity growth to continue. The IEA expects 8%-13% solar capacity growth pa to 2030, mainly driven by growth outside of Europe. We see upside risks to IEA forecasts, especially in Europe given recent competitivity gains and announcements in Spain. We also show below that the IEA has historically been too conservative with renewable installation forecasts, and has meaningfully underestimated the pace of RES additions globally.
Exhibit 54: Global solar capacity to grow 10% pa to 2030
Global solar capacity forecasts, GW
2,000 |
|
|
|
|
|
1,846 |
|
|
|
|
|||
1,800 |
|
|
|
|
|
|
1,600 |
|
|
|
|
|
|
1,400 |
|
1,188 |
|
|||
1,200 |
|
|
||||
|
|
|
|
|
1,027 |
|
|
|
|
|
|
|
|
1,000 |
|
|
|
|
807 |
|
800 |
|
|
|
|
|
|
|
|
|
|
|
|
|
600 |
|
386 |
|
|
|
|
400 |
|
|
|
|
||
|
|
|
|
|
|
|
200 |
|
|
|
|
|
|
0 |
|
|
|
|
|
|
|
|
|
|
|
|
|
2017 |
|
2025 |
2030 |
|||
|
|
|
|
High |
Low |
|
Exhibit 55: Solar installations have far outpaced IEA forecasts
IEA annual solar forecasts to 2030, GW
1,000 |
|
|
|
|
|
|
|
|
|
|
|
|
|
|
|
|
|
|
|
|
|
|
900 |
|
|
|
|
|
|
|
|
|
|
|
|
|
|
|
|
|
|
|
|
|
Actual & 2017 |
|
|
|
|
|
|
|
|
|
|
|
|
|
|
|
|
|
|
|
|
|
|
forecasts |
800 |
|
|
|
|
|
|
|
|
|
|
|
|
|
|
|
|
|
|
|
|
|
2016 |
|
|
|
|
|
|
|
|
|
|
|
|
|
|
|
|
|
|
|
|
|
|
|
700 |
|
|
|
|
|
|
|
|
|
|
|
|
|
|
|
|
|
|
|
|
|
2015 |
|
|
|
|
|
|
|
|
|
|
|
|
|
|
|
|
|
|
|
|
|
|
|
600 |
|
|
|
|
|
|
|
|
|
|
|
|
|
|
|
|
|
|
|
|
|
2014 |
|
|
|
|
|
|
|
|
|
|
|
|
|
|
|
|
|
|
|
|
|
|
|
500 |
|
|
|
|
|
|
|
|
|
|
|
|
|
|
|
|
|
|
|
|
|
2013 |
|
|
|
|
|
|
|
|
|
|
|
|
|
|
|
|
|
|
|
|
|
|
|
400 |
|
|
|
|
|
|
|
|
|
|
|
|
|
|
|
|
|
|
|
|
|
2012 |
|
|
|
|
|
|
|
|
|
|
|
|
|
|
|
|
|
|
|
|
|
|
|
300 |
|
|
|
|
|
|
|
|
|
|
|
|
|
|
|
|
|
|
|
|
|
2011 |
|
|
|
|
|
|
|
|
|
|
|
|
|
|
|
|
|
|
|
|
|
|
|
200 |
|
|
|
|
|
|
|
|
|
|
|
|
|
|
|
|
|
|
|
|
|
2010 |
|
|
|
|
|
|
|
|
|
|
|
|
|
|
|
|
|
|
|
|
|
|
|
100 |
|
|
|
|
|
|
|
|
|
|
|
|
|
|
|
|
|
|
|
|
|
2009 |
|
|
|
|
|
|
|
|
|
|
|
|
|
|
|
|
|
|
|
|
|
|
|
0 |
|
|
|
|
|
|
|
|
|
|
|
|
|
|
|
|
|
|
|
|
|
2008 |
|
|
|
|
|
|
2015 |
|
|
|
|
|
|
|
2023 |
|
|
|
|
|
|
|
|
2008 |
2009 |
2010 |
2011 |
2012 |
2013 |
2014 |
2016 |
2017 |
2018 |
2019 |
2020 |
2021 |
2022 |
2024 |
2025 |
2026 |
2027 |
2028 |
2029 |
2030 |
Source: IEA |
Source: IEA |
Regional forecasts show Asia drives future solar growth
Although Europe has led the solar revolution, the region will take the back seat in the next decade representing only 6% of annual installations. Asia takes center stage with c.65% of the installations with China alone responsible for c.30% of installations, based on IEA forecasts.
3 December 2018 |
35 |
vk.com/id446425943
Goldman Sachs
Power Shift 2019: Nextgen Power
Exhibit 56: Solar installations to add up to >110GW pa over the next decade
Annual solar installations by region for the period 2020-2030, GW
140 |
|
|
|
|
|
|
|
|
|
|
|
|
|
1.5% |
116 |
120 |
|
|
|
|
3.3% |
|
|
|
|
|
|
|
16 |
|
|
100 |
|
|
|
|
|
|
|
|
|
|
|
|
|
|
|
80 |
|
|
|
|
41 |
|
|
|
|
|
|
2% |
|
|
|
60 |
|
|
|
|
|
|
|
40 |
|
1.5% |
0.6% |
32 |
|
|
|
|
|
|
|
|
|||
|
|
|
|
|
|
|
|
20 |
0.6% |
|
2 |
|
|
|
|
18 |
|
|
|
|
|
||
|
|
|
|
|
|
|
|
0 |
7 |
|
|
|
|
|
|
|
|
|
|
|
|
|
|
|
Europe |
US |
Latam |
China |
Other Asia |
Other |
Total |
Source: IEA, Goldman Sachs Global Investment Research
3 December 2018 |
36 |