

GS_The_European_Conviction_List_watermark
.pdfvk.com/id446425943
Goldman Sachs
Clariant (CLN.S): Portfolio high-grading the right move
GS Analyst
Theodora Lee Joseph
+44(20)7051-8362
theodoralee.joseph@
gs.com
Clariant forecasts synergies of SFr100 mn annually until the end of 2022, with implementation costs of SFr80 mn over the same period.
Investment thesis: Clariant has one of the strongest growth profiles in the EU Chemical sector on our estimates, driven by exposure to sub-segments that are inflecting from trough levels. In the last year, Clariant has consistently beaten company-compiled consensus earnings, as growth from Care Chemicals and Catalysis surprised to the upside. Clariant’s recently announced strategic combination with SABIC both at an operational and governance level is also likely to be a clear positive from here.
Portfolio high-grading: In our view, the latest reinvigoration of the board at Clariant removes uncertainty around the SABIC/Clariant relationship that has existed since SABIC took its stake in January 2018, with SABIC demonstrating that it intends to be a fully operational partner with Clariant with the control of four board seats. Overall, the new targets set by the company reflect our positive view on inflecting demand in end markets where Clariant is exposed. In our view the recent upgrade in guidance reflects the CHF100 mn of incremental sunliquid sales, with expected EBITDA margins exceeding 40% by 2021, which we believe is not yet reflected in consensus.
Strategic impact: The dual action of combining its higher-value Plastics & Coatings businesses with SABIC while divesting the commodity business will be accretive to Clariant’s EPS in the first year, in the high-teens range on our estimates. Furthermore, through this deal, we think Clariant will successfully manage to high-grade its portfolio and increase its downstream focus. Clariant expects the new division to grow above GDP and have higher margins than its existing base business.
What’s it worth? Our 12-month target price of CHF30 is comprised 85% weighting to our fundamental value (CHF28.5/sh based on 13.4x 2019E EV/DACF) and 15% M&A-based valuation of CHF37.5/sh (representing 12.5x 2019E EV/EBITDA).
Exhibit 10: We forecast a steady improvement in FCF yield
Clariant FCF yield and dividend yield
Clariant FCF yield |
|
Clariant Dividend Yield |
|
10%
8%
6%
4%
2%
0%
-2%
2014 |
2015 |
2016 |
2017 |
2018 |
2019 |
2020 |
2021 |
2022 |
Exhibit 11: Clariant has de-rated since the beginning of 2018
Consensus EV/EBITDA with median, max., and min.
Clariant 1 yr forward EVEBITDA |
|
Median |
|
Max |
|
Min |
|
|
|
12
10
8
6
4
2
0
Sep 18
May 18
Jan 18
Sep 17
May 17
Jan 17
Sep 16
May 16
Jan 16
Sep 15
May 15
Jan 15
Sep 14
May 14
Jan 14
Sep 13
May 13
Jan 13
Sep 12
May 12
Jan 12
Sep 11
May 11
Jan 11
Sep 10
May 10
Jan 10
Source: Company data, Goldman Sachs Global Investment Research |
Source: Datastream, Goldman Sachs Global Investment Research |
28 November 2018 |
11 |
vk.com/id446425943
Goldman Sachs
CNH Industrial (CNHI.MI): Exposure to the Ag Cycle with SOTP optionality
GS Analyst
Gungun Verma
+44 (20) 7774-6415
gungun.verma@gs.com
North American Ag revenues were +15% yoy in 3Q, supporting our thesis of a recovery
Earlier in 2018, S&P raised CNHi to investment grade BBB from BBB-
Investment thesis: CNHi is the No.2 player in the concentrated global agricultural equipment market. As such, we see the company as a clear beneficiary of the positively inflecting North American market, with recent organic growth improving and used equipment prices continuing to rise. We also see structural value creation optionality through a potential disposal/spin-off of the Commercial Vehicles and Powertrain divisions. Following weak YTD performance (the stock is c.30% below YTD highs) on concerns over trade and the CEO change, we see a compelling entry point.
Positive inflection in NA equipment demand: We believe that a cyclical recovery in the global Ag Equipment market is under way, especially in the high-profit NA Ag row crop segment, where sales fell c.20% pa for four years, before troughing in 2017.
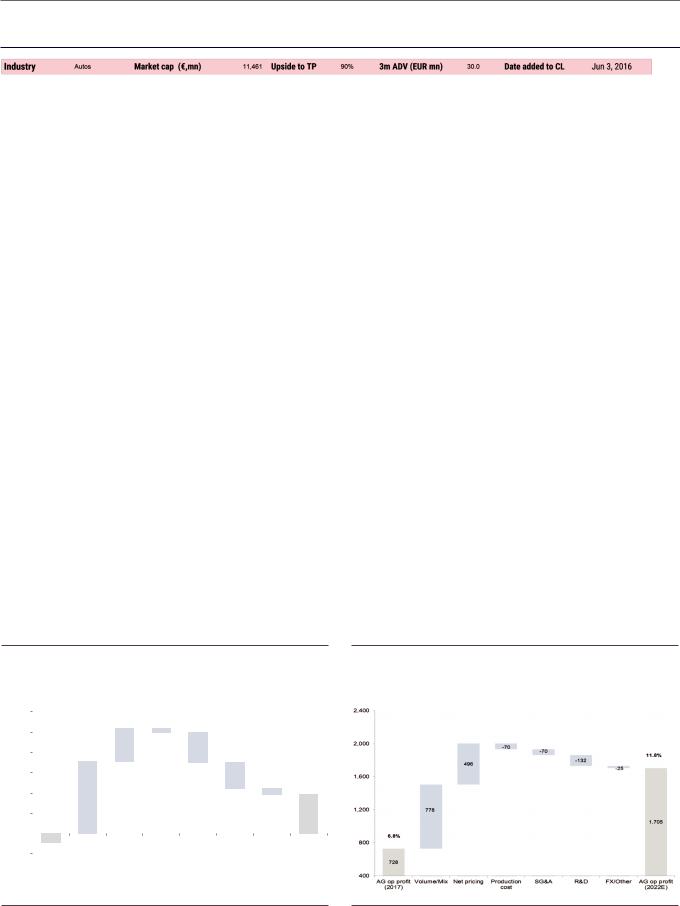
Multiple earnings drivers: Driven by the growth in key end markets, we forecast 10% average growth in CNHi’s EBIT over 2018-22, with a 2.1 pp margin expansion over the same period. In addition to improving profitability, lower interest expenses from de-leveraging and a normalising tax rate should contribute to the bottom line, driving a c.17% EPS CAGR over the next five years on our forecasts.
Debt-free by 2019E: We expect the improving operational performance to result in average FCF of US$810 mn over the forecast period, with CNHI turning debt-free by as early as 2019E: US$0.6 bn net cash vs. a 2017 net debt position of US$0.9 bn. Combined with an improved credit rating, this should enable CNHi to return excess cash to shareholders.
What’s it worth? We believe the creation of a global Ag pure-play through a potential disposal/spin-off of the Commercial Vehicle and Powertrain unit could offer significant upside to CNHi shares. We therefore value CNHi on a blend of SOTP (25%) and ROIC-based (75%) valuation metrics. Overall, our 12m price targets are €15.9/US$18.0 per ADR.
Exhibit 12: We see CNHI generating significant cash flow over the next four years…
in €, mn
12,000 |
|
|
|
|
|
|
|
-426 |
|
|
|
|
|
|
|
|
|
|
|||
10,000 |
|
|
|
|
|
|
|
|
|
|
8,000 |
|
|
|
|
|
|
3,282 |
-2,923 |
|
|
|
|
|
|
|
|
|
|
|
|
|
6,000 |
|
|
|
|
|
|
|
-2,548 |
|
|
|
|
|
|
|
|
|
|
|
|
|
4,000 |
|
|
|
7,934 |
|
|
-621 |
|
||
|
|
|
|
|
|
|
||||
|
|
|
|
|
|
|
|
|||
2,000 |
|
|
|
|
|
|
|
|
|
3,837 |
0 |
|
|
|
|
|
|
|
|
|
|
|
|
|
-861 |
|
|
|
|
|
|
|
-2,000 |
|
|
Net |
Net profit |
D&A |
Working Capex Dividend |
Other |
Net |
||
|
||||||||||
|
|
|
||||||||
|
|
|
industrial |
|
|
|
|
cap |
|
industrial |
|
|
|
cash |
|
|
|
|
change |
|
cash |
|
|
(2017) |
|
|
|
|
|
|
(2022E) |
|
Exhibit 13: …with AG margins climbing back towards previous peak-levels of 12%
Source: Company data, Goldman Sachs Global Investment Research |
Source: Goldman Sachs Global Investment Research |
28 November 2018 |
12 |
vk.com/id446425943
Goldman Sachs
Melrose (MRON.L): Multiple catalysts for value crystallization
GS Analyst
Jack O’Brien
+44(20)7552-2998
jack.obrien@gs.com
Melrose has also more recently announced a reassuring update for the 4 months to end October
Investment thesis: We believe Melrose can deliver 20p of EPS by 2020 (from c.10p in 2017), driven by restructuring, improved incentivisation, overcoming 2017’s one-offs, and supportive end markets. We see Melrose delivering at least 1.5x of value creation from recently-acquired GKN over the next 5 years, supporting our 12m SOTP-based price target of 240p. From here we see several catalysts including a strategic update and disposal of Ergonomics by end-2018; and the potential disposal of remaining Nortek, Brush, Powder Metallurgy and non-core GKN by end 2019.
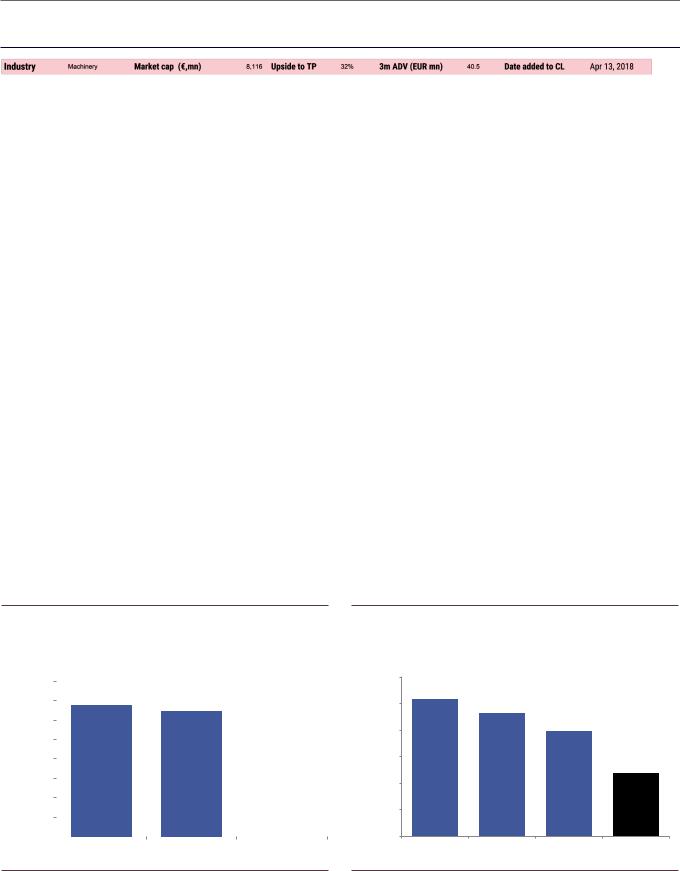
Undervalued incumbent assets…: We continue to believe that management is taking a conservative outlook for 2019/20; we see scope for Aerospace margin recovery to exceed current market expectations given historical margins, read-across from peers, a healthy end market backdrop and encouraging signs of improvement at US Aerostructures.
Restructuring potential: We believe Powder Metallurgy could be disposed of in 1H19, providing potentially the most important catalyst ahead of the FY18 results on March 7 and the CMD on April 3. By end 2019, we could also see Nortek, Brush and non-core GKN follow.
Promising 1H: In its 1H18 results, Melrose delivered a beat vs. our estimate of EBIT by over 10% and confirmed margin expectations for GKN. In particular, management expects at least 10% medium-term EBIT margins for GKN; we continue to see an 11+% margin as achievable by 2022.
What’s it worth? Our 240p 12-month price target is SOTP-based (25% peer trading multiples/75% transaction multiples based on precedent deals to reflect ongoing portfolio optimisation).
Exhibit 14: GKN Aerospace labour efficiency materially underperforms peers
Sales per employee (2017)
|
0.40 |
|
|
|
|
|
|
|
|
||
(£mn) |
0.35 |
|
|
|
|
0.30 |
|
|
|
|
|
Employeeper |
|
|
|
|
|
0.15 |
|
|
|
|
|
|
0.25 |
|
|
|
|
Sales |
0.20 |
|
|
|
|
0.10 |
|
|
|
|
|
|
0.05 |
|
|
|
|
|
0.00 |
|
|
|
|
|
|
|
|
|
Spirit Aerostructures Triumph Aerospace Structures |
GKN Aerospace |
Exhibit 15: Driveline is less profitable than peers (EBITDA margin), suggesting scope for improvement
2017 reported EBITDA margins versus peers
|
12.0% |
|
(2017) |
11.5% |
|
11.0% |
||
margin |
||
|
||
EBITDA |
10.5% |
|
10.0% |
||
|
9.5%
9.0%
Dana Group |
Dana Light Vehicle |
Magna |
GKN Driveline |
Source: Company data |
Source: Company data |
28 November 2018 |
13 |
vk.com/id446425943
Goldman Sachs
Rolls-Royce (RR.L): Preparing for FCF take-off
GS Analyst
Chris Hallam
+44(20)7552-2958
chris.hallam@gs.com
Any newsflow that eases investor concerns about the ongoing engine issues would be a key catalyst.
Rolls-Royce has announced £1.11 bn of asset disposals (L’Orange £610 mn and Commercial Marine £500 mn), so far in 2018
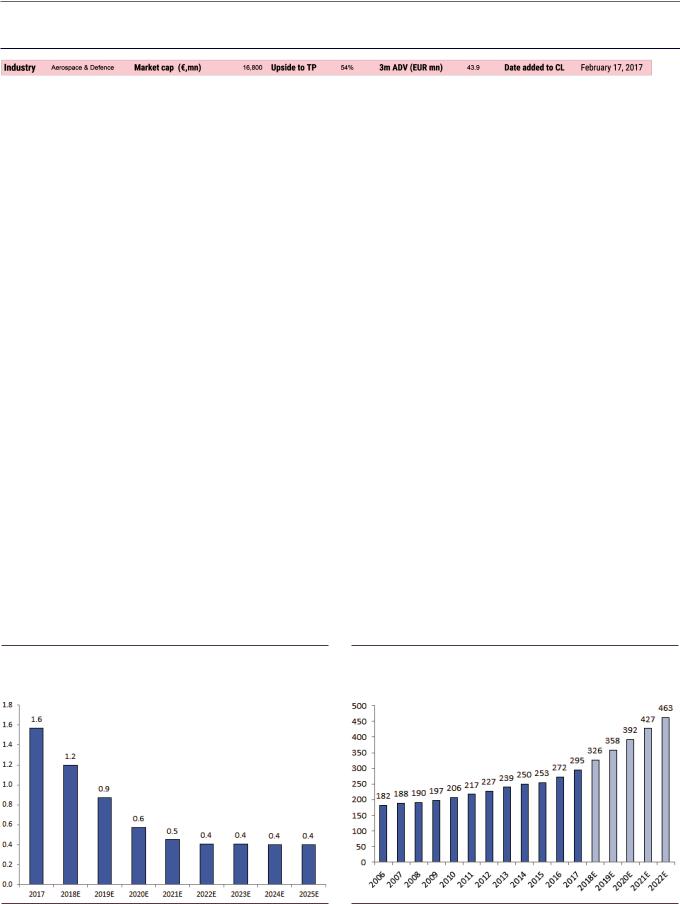
Investment thesis: We continue to believe Rolls-Royce can achieve >£1.3 bn of FCF by 2020. This growth, from just £273 mn last year, should be driven by falling OE losses, a larger installed base, richer flight hour payments, and cost control. Beyond 2020, we believe wide body cash margins will continue to grow, and at the same time RR could benefit from FX, if it shortens its hedging policy. We also believe that FCF could climb through the company’s £1.8 bn ‘mid-term’ ambition, to £2 bn in 2025E.
Past investment set to drive organic growth in wide body… Rolls-Royce has undergone a period of heavy investment in recent years, launching three new large engines and investing in three factories. Going forward, we believe the company is set to reap the benefits from this spending in OE: we expect wide body cash margin to reach £2.2 bn by 2022, with losses decreasing by £500 mn, despite higher deliveries.
…allowing Rolls to enter a ‘harvest phase’: We expect the R&D and capex burden at Rolls to ease in the coming years, allowing the company to reap the rewards of the improvement in wide body cash flows. Management has also unveiled a new cost-savings plan that aims to reduce headcount by 4,600, generating £400 mn of savings in the process. This gives credibility to the new medium-term target of >£1.8 bn of FCF, in our view, easing investors concerns on 2020 being a ‘peak’ cash flow year.
Restructuring momentum: The proceeds from simplification, coupled with underlying FCF growth in the business, drive down net debt/EBITDA from 0.3x in 2017 to -1.8x in 2025, on our estimates. At the June CMD, the company detailed its £400 mn cost savings plan and the group’s two key new FCF benchmarks: (1) > £1 bn of FCF in 2020; and (2) a ‘mid-term’ target of £1 per share of FCF (implying >£1.8 bn by 2023/24), give us confidence that the group is moving towards a more returns-oriented structure.
What’s it worth? Our 12-month EV/DACF-based price target is 1,255p, implying a >7% FCF yield in 2020E (vs. a sector average of c.6.7%).
Exhibit 16: Loss per engine is set to fall sharply as the Trent XWB improves...
Average loss per OE engine delivered (£ mn)
Exhibit 17: ...while we expect a 9% CAGR in installed base thrust, driving up aftermarket earnings
RR widebody installed thrust (lbs mn)
Source: Company data, Goldman Sachs Global Investment Research. |
Source: Company data, Goldman Sachs Global Investment Research. |
28 November 2018 |
14 |
vk.com/id446425943
Goldman Sachs
Deutsche Post DHL (DPWGn.DE): Robust structural growth opportunity
GS Analyst
Matija Gergolet
+44(20)7774-3023
matija.gergolet @gs.com
3Q18 results were 11% ahead of company-compiled consensus at the EBIT level, but in line with our estimates
Investment thesis: Deutsche Post DHL is the global leader in express deliveries, the market leader in German parcels and the incumbent German mail operator. We believe that DP DHL has now successfully positioned itself for structural growth in e-commerce, with the contribution from B2C/e-commerce parcels up from 7% of EBIT in 2010 to c.26% in 2018E. Further margin improvements in Global Forwarding, price increases and cost control all suggest that the risk/reward is skewed to the upside.
DP DHL has built up a pan-European parcel network through organic investment, acquisitions and partnerships, leveraging its brand and home-grown expertise. As e-commerce continues to grow, both domestically and internationally, we view DP DHL as well positioned to continue benefiting from high B2C parcels growth.
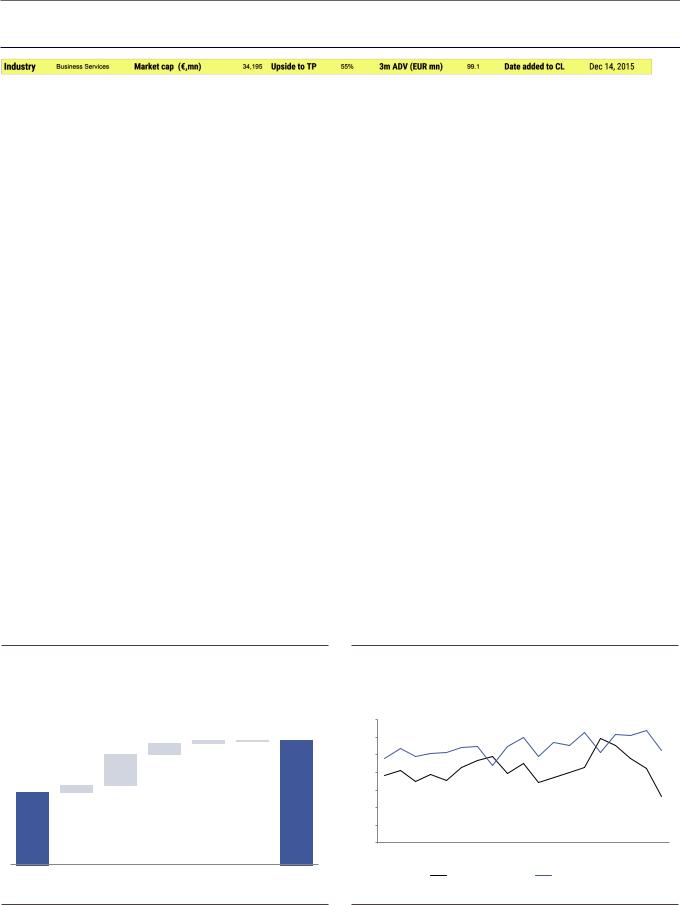
Turnaround gaining momentum: Deutsche Post achieved a good overall performance in 3Q18, with signs of a turnaround in Mail & Parcels and momentum in Global Forwarding. From here, we forecast 11% EBIT growth over 2019-21, as the company benefits from growth in Express and B2C parcels/e-commerce and the turnaround of Mail & Parcels and Global Forwarding gains momentum.
We expect stronger EBIT growth in Mail & Parcels, backed by price increases in
mid 2019: Deutsche Post is targeting a price increase in parcels well ahead of inflation in 2019, to compensate for higher costs which impacted its 2018 margin. Given tight capacity in the system, we expect this to be successful. Regarding the delay in the regulated mail price increase (from January 2019 to mid 2019), we believe that valuation does not capture the fact that Deutsche Post will be financially compensated.
What’s it worth? Our 12-month price target is €43 and values Deutsche Post DHL on a SOTP, resulting in a blended 12.5x 2019E EV/EBIT (discounted back one year by 10%). We also add the potential value from uses of cash – we calculate in excess of €5 bn of spare balance sheet capacity by end-2019E.
Exhibit 18: We expect Express and Global Forwarding to be the |
Exhibit 19: Though Express volumes weakened in 3Q18, owing to |
main drivers for profit growth |
tough comps, the margin has been resilient over time |
EBIT evolution, 2017-2020E (€ mn) |
Group TDI daily volumes % change vs margins |
|
|
|
|
14% |
|
|
|
|
12% |
265 |
58 |
-25 |
|
10% |
|
|
|
||
|
|
|
|
|
756 |
|
|
|
8% |
164 |
|
|
|
6% |
|
|
|
4980 |
4% |
|
|
|
|
|
3741 |
|
|
|
2% |
|
|
|
|
|
|
|
|
|
0% |
2017 |
PeP |
Express |
Global |
Global Supply Central costs |
2020E |
|
|
|
Forwarding |
Chain |
|
1Q14 |
2Q14 |
3Q14 |
4Q14 |
1Q15 |
2Q15 |
3Q15 |
4Q15 |
1Q16 |
2Q16 |
3Q16 |
4Q16 |
1Q17 |
2Q17 |
3Q17 |
4Q17 |
1Q18 |
2Q18 |
3Q18 |
|
|
|
|
Group TDI daily volumes |
|
Express Margins |
|
|
|
|
||||||||
Source: Company data, Goldman Sachs Global Investment Research |
Source: Company data, Goldman Sachs Global Investment Research. |
28 November 2018 |
15 |
vk.com/id446425943
Goldman Sachs
Elis SA (ELIS.PA): Cleaning Up
GS Analyst
Matija Gergolet
+44(20)7774-3023
matija.gergolet @gs.com
At its 3Q18 results, the company stated that Berendsen’s integration is progressing to plan and guided for group organic revenue growth in 4Q18 to be up by 2.5%.
Investment thesis: Following the acquisition of Berendsen, Elis has become the leading industrial laundry and textile rental company in Europe and Latin America, benefiting from ongoing outsourcing trends. We expect Elis to improve margins as it extracts synergies from the deal, while FCF generation will be reinvested to further strengthen its position. With c.85% of debt at fixed rates, and no material refinancing needs until 2022, market concerns about Elis’s leverage are overdone, in our view.
Synergies and scale: Elis has closed three acquisitions ytd (representing €42mn in annualised revenues) as it continues to consolidate its markets. We believe synergies from recent deals should lead to >11% pa EPS growth over 2018-20E, with more potentially being added from further accretive M&A, which we estimate could add 6%-8% pa to EPS growth over the two years (assuming 3x net debt/EBITDA, per management’s target).
Refinancing risk reduced: The issuance of two bonds earlier this year to repay the Berendsen bridge loan (a 5y €650 mn issue at 1.875% and an 8y issue of €350 mn at 2.875%; a blended coupon of 2.2%) leaves Elis with no material refinancing needs over the next four years, which we view as a positive for Elis, as it can use its FCF to pursue growth via M&A.
M&A - to build leading market positions: The combination with Berendsen should offer a series of new countries in which it can lead consolidation (i.e. Northern Europe and the UK), while Elis has also identified other countries (i.e. in LatAm) where outsourcing is still low and organic growth and M&A opportunities could be material.
What’s it worth? Our 12-month price target for Elis of €28 is based 85% on 7.25x EV/EBITDA, applied to 2019E, to which we add the expected value from uses of cash (i.e. Elis pursuing further M&A) and 15% on an M&A-based valuation (at 18x EV/EBIT, based on historical transaction multiples in the subsector).
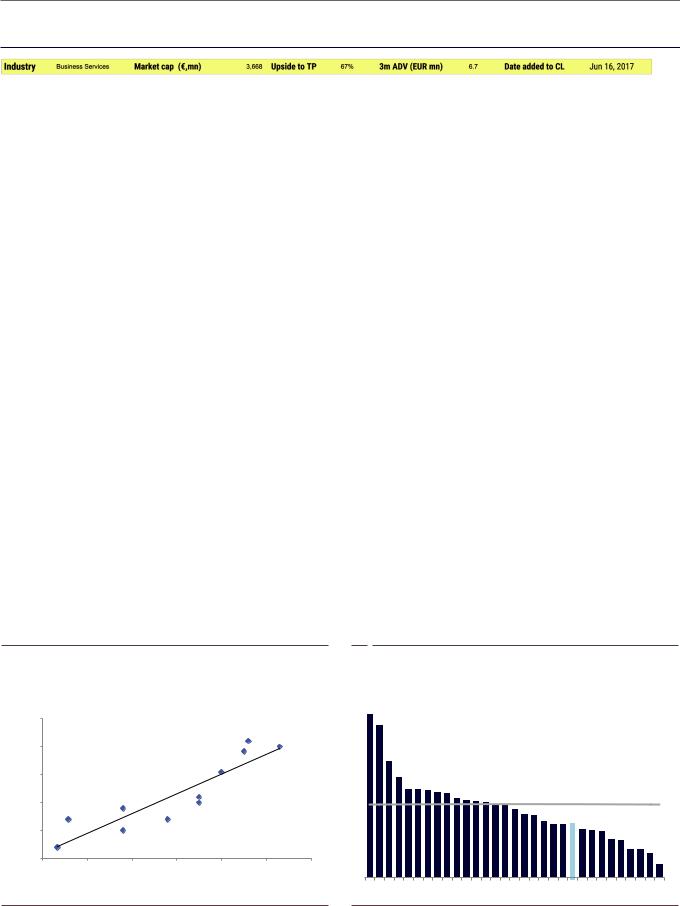
Exhibit 20: Elis EBIT margin correlates strongly with local market shares (EBIT margin and market share by geography)
|
25% |
|
|
|
|
|
|
|
|
|
|
|
|
Sweden (2017E) |
|
margin |
20% |
|
|
|
France (2017E) |
Denmark (2017E) |
|
|
|
|
|
|
|||
|
|
|
|
Portugal (2017E) |
|
||
15% |
|
|
|
|
|
|
|
EBIT |
|
|
|
|
|
|
|
|
|
|
|
Switzerland (2017E) |
|
||
Adjusted |
10% |
|
UK (2016)* |
|
|
||
|
|
Brazil (2017E) |
|
||||
Germany (2017E, BRSN) |
Spain (2017E) |
|
|
||||
|
|
|
|
|
|||
5% |
|
UK (2017E) |
|
|
|
|
|
|
|
|
|
|
|
||
|
|
Germany (2017E, Elis) |
|
|
R† = 0.8202 |
||
|
0% |
|
|
|
|
||
|
|
|
|
|
|
|
|
|
0% |
10% |
20% |
30% |
40% |
50% |
60% |
Market share
Exhibit 21: Elis’s growth-adjusted valuation is among the most attractive in the sector
(Business Services PEG ratio: 2018E P/E vs. 2018-20E EPS CAGR)
1.3x
ELIS.PA
Source: Company data, Goldman Sachs Global Investment Research. |
Source: Goldman Sachs Global Investment Research |
28 November 2018 |
16 |
vk.com/id446425943
Goldman Sachs
Eurofins Scientific (EUFI.PA): Positive test results for the growth story
GS Analyst
Matija Gergolet
+44(20)7774-3023
matija.gergolet @gs.com
Eurofins is now guiding for €5 bn of revenues and €1 bn of adjusted EBITDA in 2020.
Investment thesis: Eurofins is a pure-play testing company specialising in food, pharma, environment and healthcare-related verticals. We view Eurofins as a strong compounding growth story via organic growth and M&A, delivering a >20% EPS CAGR over 2018-20E. We note that Eurofins has an EBITDA margin target of 20% in 2020, while mature labs at Eurofins can deliver EBITDA margins above 30%, once they reach good productivity levels, thus offering material upside potential for the medium term, in our view.
Doubling revenues via organic routes… We believe Eurofins’ end markets of food, pharma and environmental testing remain attractive and offer secular GDP+ growth rates. Eurofins delivered over 5% organic growth in 3Q18 and is guiding for €5 bn of revenues in 2020. We expect capex/sales to decrease from >8% in 2018 to 7% by 2020, and stay at 6% thereafter; combined with the EBITDA margin expansion, this should lead to significant growth in its FCF and a fast deleveraging to 3.0x net debt/EBITDA by 2020E.
…and inorganic opportunities: Over the last six months, Eurofins has closed two material acquisitions - Covance (in the food business) and TestAmerica Environmental Services LLC (environmental testing). While we believe that the company will be able to continue undertaking small bolt-on acquisitions, we also expect that over the next year it should be able to deliver significant synergies from its recent larger acquisitions.
What’s it worth? Our 12-month price target of €660 is based on 16x 2019E EBITDA, and includes uses of excess cash and an M&A component (at 18x EV/EBITDA, in line with historical transactions, 15% weight).
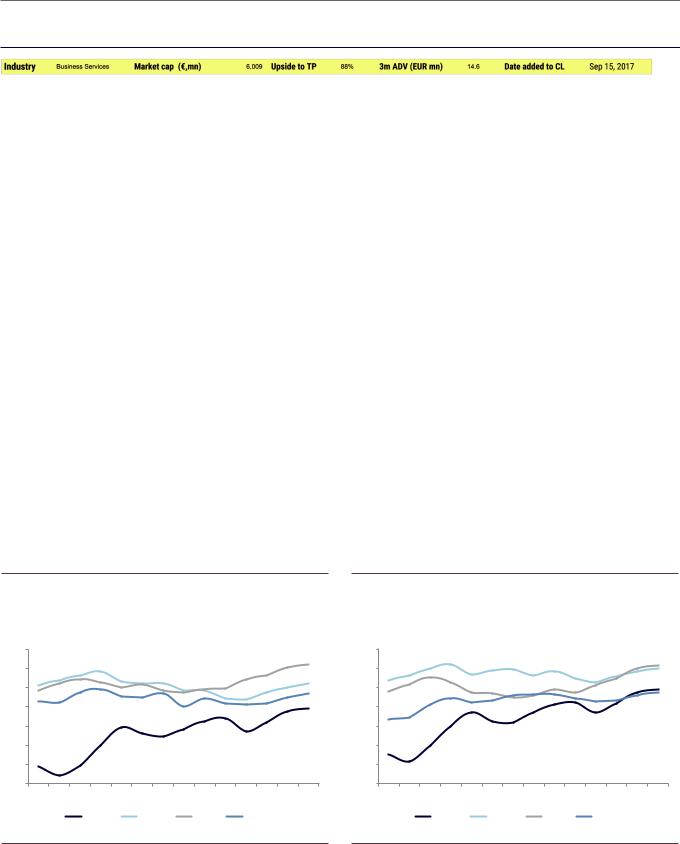
Exhibit 22: Eurofins’ EBITA margin has been converging towards |
Exhibit 23: ...as has its EBITDA margin, a trend which we expect to |
||||||||||||||||||||||||||
competitors’... |
|
|
|
|
|
|
|
|
|
|
|
|
continue |
|
|
|
|
|
|
|
|
|
|
|
|
|
|
EBITA margin, 2007-20E |
|
|
|
|
|
|
|
|
|
|
EBITDA margin, 2007-20E |
|
|
|
|
|
|
|
|
|
|
||||||
0.2 |
|
|
|
|
|
|
|
|
|
|
|
|
|
0.24 |
|
|
|
|
|
|
|
|
|
|
|
|
|
0.18 |
|
|
|
|
|
|
|
|
|
|
|
|
|
0.22 |
|
|
|
|
|
|
|
|
|
|
|
|
|
0.16 |
|
|
|
|
|
|
|
|
|
|
|
|
|
0.2 |
|
|
|
|
|
|
|
|
|
|
|
|
|
0.14 |
|
|
|
|
|
|
|
|
|
|
|
|
|
0.18 |
|
|
|
|
|
|
|
|
|
|
|
|
|
0.12 |
|
|
|
|
|
|
|
|
|
|
|
|
|
0.16 |
|
|
|
|
|
|
|
|
|
|
|
|
|
0.1 |
|
|
|
|
|
|
|
|
|
|
|
|
|
0.14 |
|
|
|
|
|
|
|
|
|
|
|
|
|
0.08 |
|
|
|
|
|
|
|
|
|
|
|
|
|
0.12 |
|
|
|
|
|
|
|
|
|
|
|
|
|
0.06 |
|
|
|
|
|
|
|
|
|
|
|
|
|
0.1 |
|
2009 |
2010 |
2011 |
2012 |
2013 |
2014 |
2015 |
2016 |
2017 |
2018 |
2019 |
2020 |
2007 |
2008 |
2009 |
2010 |
2011 |
2012 |
2013 |
2014 |
2015 |
2016 |
2017 |
2018 |
2019 |
2020 |
2007 |
2008 |
||||||||||||
|
|
|
EUFI.PA |
|
SGSN.S |
|
ITRK.L |
|
BVI.PA |
|
|
|
|
EUFI.PA |
|
SGSN.S |
|
ITRK.L |
|
BVI.PA |
|
|
|||||
Source: Company data, Goldman Sachs Global Investment Research. |
|
|
|
|
Source: Company data, Goldman Sachs Global Investment Research. |
|
|
|
|
||||||||||||||||||
28 November 2018 |
17 |

vk.com/id446425943
Goldman Sachs
Experian (EXPN.L): Accelerating organic growth
GS Analyst
Matija Gergolet
+44(20)7774-3023
Matija.gergolet @gs.com
The decisioning segment showed 13% organic growth in 1H, while Data grew by 7%.
Experian 1H19 EBIT was up 7% yoy in USD, and 10% in constant currency.
Investment thesis: We believe that the growth acceleration at Experian (evident in the 4Q18, 1Q19 and 2Q19 results) is not fairly reflected in its multiples. Thanks to several recent new product launches, we expect organic revenue growth to remain around 8% over the next three years (from 4%-5% in recent years). As we benchmark Experian’s growth and multiples to peers in Information Services, we believe there is a compelling valuation opportunity at current levels.
B2B product launches: In recent years, Experian has seen a marked acceleration of growth in its decisioning tools (software) segment, with Decision Analytics growth approaching double-digit levels. Experian recently eported its third consecutive quarter of 8% organic growth, driven by a strong performance of its North American business, which grew 10% organically (driven by 11% growth in B2B).
B2C is also improving: New product launches are also driving improving growth in B2C, with recently launched identity protection services a key driver. 1H19 B2C organic revenue growth reached 5%, with Experian adding another 40,000 clients for its identity protection product (now 280,000 memberships).
What’s it worth? We value Experian on 26x calendar 2019E P/E, consistent with the valuation of peers across a wide range of sectors including both businesses services and information technology. Our 12-month, P/E-based price target is 2,400p, which also includes a 15% M&A weighting, based on 18x 1-year forward EV/EBITDA.
Exhibit 24: Valuation looks compelling against the appropriate peer group of Information Services companies
Company Name |
Market cap |
Revenues |
EBIT |
EBIT |
EBIT margin |
EV/EBITDA |
P/E 2019E |
FCF Yield |
EPS |
EPS |
(USD mn) |
Growth |
Margin |
Margin |
volatility |
2019E |
2019E |
growth |
growth |
||
|
2020E |
2018E |
5yrs Vol |
(CoV) |
|
2019E |
2020E |
|||
|
|
|
|
|
||||||
|
|
|
|
|
|
|
|
|
|
|
Fair Isaac Corporation |
5,782 |
7.9% |
20.0% |
0.1% |
0.1% |
18.6 |
27.9 |
2.8% |
12.2% |
15.7% |
TransUnion |
12,543 |
8.7% |
34.1% |
0.6% |
0.3% |
18.2 |
27.4 |
4.2% |
14.8% |
15.9% |
IHS Markit |
21,256 |
6.1% |
34.0% |
2.6% |
0.3% |
17.3 |
23.1 |
5.1% |
13.9% |
13.9% |
CoStar |
13,286 |
16.6% |
32.0% |
0.6% |
0.3% |
30.1 |
45.7 |
2.7% |
21.8% |
20.1% |
Gartner |
13,074 |
12.0% |
14.5% |
0.9% |
0.2% |
21.4 |
36.9 |
4.0% |
12.6% |
17.7% |
Dun & Bradstreet |
5,305 |
2.6% |
26.2% |
0.2% |
0.0% |
12.3 |
17.7 |
7.4% |
5.1% |
4.7% |
Equifax |
12,736 |
6.2% |
29.4% |
1.4% |
0.2% |
13.0 |
18.3 |
5.4% |
5.3% |
7.9% |
FactSet Research |
8,626 |
5.1% |
30.0% |
0.4% |
0.1% |
17.7 |
23.2 |
4.5% |
12.0% |
11.3% |
Nielsen Holdings |
9,515 |
3.9% |
21.0% |
1.0% |
0.1% |
9.6 |
12.4 |
9.6% |
28.8% |
27.2% |
Verisk Analytics |
19,451 |
7.2% |
40.5% |
0.9% |
0.1% |
19.2 |
27.7 |
4.0% |
7.2% |
11.4% |
Experian |
21,695 |
7.8% |
27.8% |
0.4% |
0.0% |
13.1 |
20.5 |
5.2% |
11.9% |
13.8% |
Amadeus |
31,036 |
8.8% |
29.2% |
1.6% |
0.1% |
13.8 |
27.3 |
3.9% |
12.2% |
10.8% |
|
|
|
|
|
|
|
|
|
|
|
Average |
14525 |
7.7% |
28.2% |
0.9% |
0.2% |
17.0 |
25.7 |
4.9% |
13.2% |
14.2% |
Median |
12905 |
7.5% |
29.3% |
0.7% |
0.1% |
17.5 |
25.2 |
4.3% |
12.2% |
13.9% |
Based on calendarized numbers, as of November 1st.
Source: Company data, Goldman Sachs Global Investment Research.
28 November 2018 |
18 |
vk.com/id446425943
Goldman Sachs
Ferrovial SA (FER.MC): Momentum in contracting; SOTP optionality
GS Analyst
Patrick Creuset
+44(20)7552-5960
patrick.creuset @gs.com
FER reported 3Q EBITDA 4% ahead of our estimate and 6% ahead of company-compiled consensus, driven by a beat in toll roads.
According to a recent regulatory filing (16/10/18), Ferrovial has hired an external consultant “to explore the potential divestment of all or part of the assets of the Services division”.
Investment thesis: Ferrovial has been a notable share price laggard in the strongly-performing infrastructure sector in recent years, owing to persistent earnings downgrades in its Contracting divisions (Services & Construction). The resulting de-rating has been so great that the discount to our SOTP is now larger than the value we attribute to Contracting. We see two catalysts for valuation to rebound from here: (1) portfolio simplification; and (2) a significant increase in FCF (supported by a rebound in Contracting) in 2019/20E.
Scope for FCF inflection: Recent EPS downgrades hide a significant improvement in FCF quality, in our view. We now expect Infrastructure to contribute 70%-90% of 2018-22E FCF, vs. c.50% in 2011-14. This raises medium-term growth potential, given Infra’s higher growth profile and cyclical trough margins in Contracting. We forecast FCF nearly doubling through 2018-20, half driven by a step-up in CFs from Infra as the Managed Lanes start up-streaming dividends, and half from a margin recovery in Contracting.
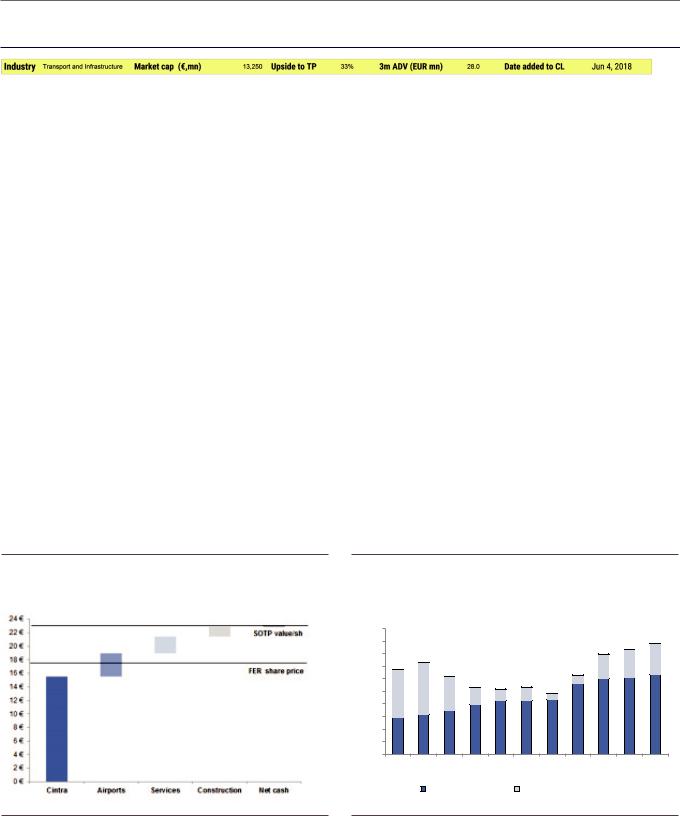
Portfolio simplification: Ferrovial comprises four parts: Cintra, the toll road division (mainly urban assets in Toronto and Dallas), Airports (mainly Heathrow), Services (mainly public sector outsourcing), and Construction (mainly civil). From here, we see potential for simplification via a potential sale of the Budimex stake and a divestment of services (see, Back to the future, June 4, 2018). Ferrovial divested €48 mn worth of assets in Services and Construction during 1H18.
What’s it worth? Our 12-month DCF-based SOTP price target is €24.0.
Exhibit 25: We believe the current discount to the SOTP value is greater than the full value of the Services and Construction businesses.
Exhibit 26: We forecast FCF to almost double in the coming years with Managed Lanes being the key driver from 2019E
Ferrovial parent-level FCF by source, € mn
1,000 |
|
|
|
|
|
|
|
|
|
|
900 |
|
|
|
|
|
|
|
|
|
|
800 |
|
|
|
|
|
|
|
|
|
|
700 |
|
|
|
|
|
|
|
|
|
|
600 |
|
|
|
|
|
|
|
|
|
|
500 |
|
|
|
|
|
|
|
|
|
|
400 |
|
|
|
|
|
|
|
|
|
|
300 |
|
|
|
|
|
|
|
|
|
|
200 |
|
|
|
|
|
|
|
|
|
|
100 |
|
|
|
|
|
|
|
|
|
|
- |
|
|
|
|
|
|
|
|
|
|
2012 |
2013 |
2014 |
2015 |
2016 |
2017 |
2018E |
2019E |
2020E |
2021E |
2022E |
|
|
Infra Divis (recurring) |
Contracting & Holding FCF |
|
|
|||||
Source: Company data, Goldman Sachs Global Investment Research. |
Source: Company data, Goldman Sachs Global Investment Research. |
28 November 2018 |
19 |

vk.com/id446425943
Goldman Sachs
Vinci (SGEF.PA): Building success
GS Analyst
Patrick Creuset
+44(20)7552-5960
patrick.creuset @gs.com
Vinci offers an 8% 2018E FCF yield, and should grow FCF by 10% pa (2019-22E).
Our analysis suggests that Vinci is one of the least exposed infrastructure assets to rising yields as better pricing should offset rising rates in an inflationary environment.
Investment thesis: Vinci is the world’s largest infrastructure group, with toll roads, airports and construction assets. Vinci’s relatively strong balance sheet and financial firepower (2x net debt/EBITDA in 2018E, >€3 bn annual FCF, 2018-21E) also create optionality for accretive inorganic growth or capital returns, in our view. On our estimates, Vinci yields 8% in 2018E (FCF), and is likely to grow FCF by 10% p.a. (2019-22). Adjusting for remaining concession life (24y = -4% p.a.), this should translate into c.14% TSR p.a. (Vinci has delivered 16% p.a. in the past 4 years at a constant 15x P/E multiple); highly attractive for a company deriving 80% of its FCF from monopolistic and inflation-linked assets.
Balance sheet firepower & French reforms: We see the Vinci’s strong balance sheet (€13 bn HoldCo net cash) as a competitive advantage, enabling it to win new concessions. Importantly, Vinci management does not see the need to raise equity capital even for potential double-digit billion EV transactions in brownfield infra assets. Vinci is also set to be a beneficiary of announced economic reform measures in France. Cuts to corporate taxes would be a clear tailwind and, with c.80% of the group’s value derived from France (on our SOTP estimates), we would expect the company to also be a major beneficiary of any improvement in the medium-term domestic growth outlook.
Cyclical construction tailwinds: French construction activity inflected from historically low levels in 2016. The ongoing ramp-up of works on the various ‘Grand Paris’ projects (first awards in 2016) is likely to provide an ongoing boost to growth. This underpins our forecast for a turnaround in Vinci Contracting growth, from a -4% EBITDA CAGR in 2012-16 to +5% in 2017-21E. We also believe Vinci is one of the few global groups to have leading positions in both infrastructure management and construction. This is supported by the company’s 2Q18 earnings beat, driven by higher-than-expected margins in Construction and Energies, a positive after four years of flat margins.
What’s it worth? Our SOTP-based valuation drives a 12-month price target of €104.
Exhibit 27: 4Q airline capacity outlook in Portugal suggests a sequential improvement in traffic growth
Vinci Portuguese airport traffic vs. airline seat capacity growth, yoy%
25% |
|
|
|
|
|
|
|
|
|
|
|
|
|
|
|
|
|
|
|
|
|
|
|
20% |
|
|
|
|
|
|
|
|
|
|
|
|
|
|
|
|
|
|
|
|
|
|
|
15% |
|
|
|
|
|
|
|
|
|
|
|
|
|
|
|
|
|
|
|
|
|
|
|
10% |
|
|
|
|
|
|
|
|
|
|
|
|
|
|
|
|
|
|
|
|
|
|
|
5% |
|
|
|
|
|
|
|
|
|
|
|
|
|
|
|
|
|
|
|
|
|
|
|
0% |
|
|
|
|
|
|
|
|
|
|
|
|
|
|
|
|
|
|
|
|
|
|
|
-5% |
|
|
|
|
|
3Q-14 |
|
|
|
|
|
|
|
|
|
|
|
|
|
|
|
|
|
1Q-13 |
2Q-13 |
3Q-13 |
4Q-13 |
1Q-14 |
2Q-14 |
4Q-14 |
1Q-15 |
2Q-15 |
3Q-15 |
4Q-15 |
1Q-16 |
2Q-16 |
3Q-16 |
4Q-16 |
1Q-17 |
2Q-17 |
3Q-17 |
4Q-17 |
1Q-18 |
2Q-18 |
3Q-18 |
4Q-18 |
ANA pax traffic |
|
ANA seat capacity yoy% |
|
Exhibit 28: Contracting order intake suggests a strong 2019 ahead
Vinci Contracting new orders -1Y vs. revenues, € mn
40,000 |
|
|
|
|
|
|
|
|
|
|
|
|
38,000 |
|
|
|
|
|
|
|
|
|
|
|
|
36,000 |
|
|
|
|
|
|
|
|
|
|
|
|
34,000 |
|
|
|
|
|
|
|
|
|
|
|
|
32,000 |
|
|
|
|
|
|
|
|
|
|
|
|
30,000 |
|
|
|
|
|
|
|
|
|
|
|
|
28,000 |
|
|
|
|
|
|
|
|
|
|
|
|
26,000 |
|
|
|
|
|
|
|
|
|
|
|
|
24,000 |
|
|
|
|
|
|
|
|
|
|
|
|
22,000 |
|
|
|
|
|
|
|
|
|
|
|
|
20,000 |
|
|
|
|
|
|
|
|
|
|
|
|
2007 |
2008 |
2009 |
2010 |
2011 |
2012 |
2013 |
2014 |
2015 |
2016 |
2017 |
2018E |
2019E |
|
|
|
|
New orders |
|
Revenues |
|
|
|
|
||
Source: Company data, OAG. |
Source: Company data, Goldman Sachs Global Investment Research. |
28 November 2018 |
20 |