

GS_The_European_Conviction_List_watermark
.pdfvk.com/id446425943
Goldman Sachs
ASML (ASML.AS): Leading position in a structurally growing market
GS Analyst
Alexander Duval
+44(20)7552-2995
alexander.duval@ gs.com
ASML guided for 33 EUV shipments in 2020 vs 30 units in 2019 and 18 units in 2018
ASML’s 2025 targets call for gross margin meaningfully above 50% (GSe 51.1%).
Investment thesis: ASML is a leading manufacturer of chip-making equipment, building lithography machines used in the production of semiconductors. We believe ASML’s unique industry position should allow it to command pricing power and capitalise on the value it can deliver to customers during tech transitions. A central pillar of this is the move towards EUV technology where it is the dominant player, and ASML’s strong recent progress on reliability (and the receipt of orders) for these machines underpins our confidence.
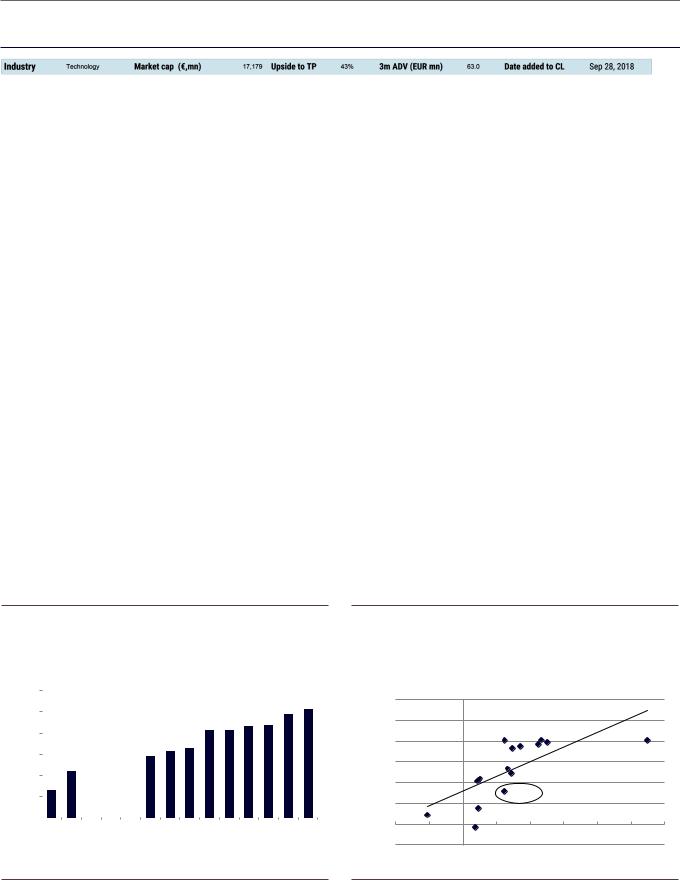
Market structure & EUV ramp: We believe ASML is one of the best-positioned assets in our European Tech coverage, with a c.70% share in the overall lithography market. The company is currently developing its next-generation EUV systems (“High NA”), which should enable industry innovation well into the next decade. At its CMD, ASML gave a positive update on EUV reliability and expects its next model of EUV systems (the 3400C) to deliver higher productivity (170 WPH in 2H19 and 185WPH in 1H20). As such, we estimate that ASPs on 3400Cs shipping in 2020 should be 25%-50% higher than the €100 mn ASP seen last year.
HMI acquisition: In our view, the acquired HMI asset (which provides inspection/ monitoring of chip production) can help ASML to create a genuinely differentiated offering. Given HMI’s gross margin of c.70%, significantly above the group average, we believe this will also be a positive driver of long-term profitability improvement and earnings momentum.
What’s it worth? ASML trades on 15.2x 2020E P/E (GSe 2020 EPS of €9.82) which we see as attractive in light of its monopoly status and earnings growth potential. Our 12-month price target of €221 is based on 26x 2019E P/E multiple plus a special dividend (€11 per share).
Exhibit 29: We believe that ASPs can continue to rise as ASML delivers more value to its customers through EUV tools and High NA later
2025E ASP (€ mn)
 € 61mn
2025EASP |
|
|
|
€ 270mn |
|
|
|
||
€ 40mn |
€ |
140mn |
||
|
|
|||
|
|
|
|
|
 € 20mn
€ 0mn |
€ 40mn |
€ 80mn |
€ 120mn |
€ 160mn |
€ 200mn € 240mn |
|
|
Global Blended ASP |
High NA |
EUV |
Immersion |
Dry |
|
Exhibit 30: HMI and EUV contribute meaningfully to profit growth
Gross margin bridge analysis (€ mn)
25000
51.1%
20000 45.0%
15000
10000
5000
0
Source: Company data, Goldman Sachs Global Investment Research. |
Source: Company data, Goldman Sachs Global Investment Research. |
28 November 2018 |
21 |
vk.com/id446425943
Goldman Sachs
Capgemini (CAPP.PA): Organic growth consistency coming to the fore
GS Analyst
Mohammed Moawalla
+44(20)7774-1726
mohammed.moawall
a@gs.com
Capgemini recently raised FY18 revenue growth guidance to above +7.5% yoy ex FX implying c.4%+ organic growth in 4Q18.
Our 12-month price target is €145, based on 18x 2019E PF EPS.
Investment thesis: We believe the core elements of Capgemini’s growth story remain underpinned by a strong market backdrop, share gains and continued strong execution. In our view, Capgemini is well positioned to benefit from the secular theme of digitisation across industries, supporting broad-based growth across geographies and reducing top-line cyclicality.
Unwarranted sell-off: Despite good 3Q18 results, with org. growth >6%, Capgemini has underperformed global IT service peers in recent months, which creates an attractive entry point in our view, as the structural growth story remains intact, driven by strong market dynamics. From here, the ramp up of contracts and impact of the HMRC contract roll-off fading away should support continued organic growth momentum.
Strong organic growth: 3Q18 marked another quarter of strong organic revenue growth, coming in at +6.3% yoy, ahead of company-compiled consensus forecast of +5.8% and our estimate of +5.4%. Capgemini reiterated its medium targets of 5%-7% organic revenue growth and 12.5%-13.0% operating margin. It also expects SMAC/Digital to grow at a 15% CAGR, increasing from c.25% of the total market to c.50% by 2025.
Digitisation beneficiary: We view the digitisation of manufacturing industries as a key investment area, with IoT and Factory 4.0 coming to the fore, and believe Capgemini will be a key beneficiary. Coupled with this, we view the recent series of acquisitions and partnerships as incrementally positive for its SMAC/digital business.
What’s it worth? At c.13x CY19E P/E, Capgemini trades at a 15% discount to Global IT services peers (at c.15x CY19E P/E), which we believe is unjustified in the context of its c.15% 2017-20E PF EPS CAGR, vs. 10% for the peer group.
Exhibit 31: In our view, Capgemini is undervalued vs. its European peers on a FCF basis
CY20E EV/FCF for EU software/IT services coverage
|
30x |
|
|
|
|
|
|
|
|
|
|
|
|
|
|
|
24.3x25.6x |
||
|
|
|
|
|
|
|
|
|
|
|
|
|
|
|
|||||
|
25x |
|
|
|
|
|
|
|
|
|
|
|
|
|
|
|
|||
|
|
|
|
|
|
|
|
|
|
|
|
20.5x20.5x21.6x21.9x |
|
||||||
(CY20E) |
15x |
|
|
|
|
|
|
|
|
|
|
|
|
||||||
|
|
|
|
|
|
13.7x14.4x15.6x16.5x |
|
|
|
|
|
||||||||
|
20x |
|
|
|
|
|
|
|
|
|
|
|
|
|
|
|
|
|
|
EV/FCF |
10x |
|
6.4x |
11.0x12.1x12.2x |
|
|
|
|
|
|
|
|
|
|
|||||
|
|
|
|
|
|
|
|
|
|
|
|||||||||
|
|
|
|
|
|
|
|
|
|
|
|
|
|
|
|
||||
|
|
|
|
|
|
|
|
|
|
|
|
|
|
|
|
|
|||
|
|
|
|
|
|
|
|
|
|
|
|
|
|
|
|
|
|
|
|
|
5x |
|
|
|
|
|
|
|
|
|
|
|
|
|
|
|
|
|
|
|
0x |
|
|
|
|
|
|
|
|
|
|
|
|
|
|
|
|
|
|
|
|
|
ATOS.PA |
SOWGn.DE |
CAPP.PA |
EVRY.OL |
MCRO.L |
SGE.L |
HEXAb.ST |
IDR.MC |
WLN.PA |
DAST.PA |
SAPG.DE |
WDIG.DE |
AVV.L |
SIM.CO |
|||
|
|
|
|
||||||||||||||||
Source: Company data, Goldman Sachs Global Investment Research, Thomson Reuters, Datastream.
Exhibit 32: We believe Capgemini’s accelerating growth dynamics are not reflected in its valuation
CY20E FCF yield vs. 2017-22E organic revenue Capgemini vs. EU
Software/IT services/Payments coverage |
|
|
|
|
||||||
|
0% |
|
|
|
|
|
|
|
|
|
|
|
|
|
|
|
|
|
|
R† = 51% |
|
|
2% |
|
|
|
|
|
|
|
|
|
|
4% |
|
|
AVV.L |
|
TEMN.S |
DAST.PA |
|
|
|
yield |
|
|
SAPG.DE |
|
WDIG.DE |
|
||||
|
|
|
WLN.PA |
SIM.CO |
|
|
|
|||
6% |
|
|
|
|
|
|
|
|||
|
|
SGE.L |
|
|
|
|
|
|||
FCF |
|
|
|
|
|
|
|
|||
|
|
IDR.MC |
|
|
|
|
|
|
|
|
8% |
SOWGn.DE |
|
HEXAb.ST |
|
|
|
|
|||
2020 |
|
|
|
|
|
|||||
10% |
|
|
|
CAPP.PA |
|
|
|
|
||
|
|
|
EVRY.OL |
|
|
|
|
|
||
|
|
MCRO.L |
|
|
|
|
|
|||
|
12% |
|
|
|
|
|
|
|
||
|
|
|
ATOS.PA |
|
|
|
|
|
||
|
|
|
|
|
|
|
|
|
||
|
14% |
|
|
|
|
|
|
|
|
|
|
-10% |
-5% |
0% |
5% |
|
10% |
15% |
20% |
25% |
30% |
2017-22E organic revenue CAGR
Source: Datastream, Company data, Goldman Sachs Global Investment Research.
28 November 2018 |
22 |
vk.com/id446425943
Goldman Sachs
Orange (ORAN.PA): The winner in a competitive market
GS Analyst
Andrew Lee
+44(20)7552-9383
andrew.j.lee @gs.com
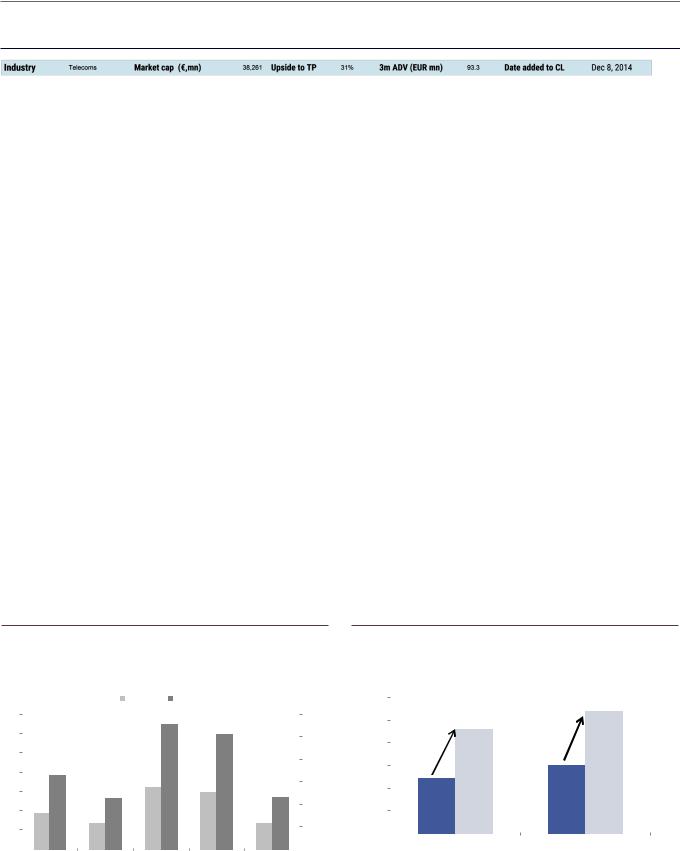
In the event of market consolidation, we see c.50% upside. In the absence of a deal, we believe Orange could return c.50% of its market cap over four years.
Investment thesis: In our view, Orange offers attractive upside with or without consolidation in the French telecoms sector. ORAN has greater regulatory and capex clarity than European incumbent peers, in our view, as well as better growth (c.3% EBITDA CAGR 2018-22E). Despite this, it trades at a c.7% FY19E FCF yield. From here, the group is growing via product differentiation (out-investing competitors, superior network and customer perception), while cutting costs through digitalisation.
French inflection and digitalisation… Despite fierce competition in France and Spain, Orange is growing its top-line in both markets. Sustained cost-execution and revenue mix improvement mean EBITDA margin grew 1 pp yoy and EBITDA was +3% in 3Q18. With scope for a positive catalyst from materially value-accretive French consolidation, as well as earnings momentum into FY19, and with the shares trading at a 5.5% unlevered 2019E FCF yield, we see Orange as compelling value, relative to the sector.
…with lower leverage… At a time when rising bond yields and regulatory uncertainty have driven a material de-rating for the telco sector, overall we believe that Orange is well insulated, given its relatively low gearing at 1.8x 2018E net debt/EBITDA.
…and better clarity on capex and regulation: Guidance suggests that capex is set to fall from 2019, and France has one of the clearest regulatory outlooks in Europe (it is the only market where the regulator has required operators to roll out fibre-to-the-home).
With multiple operators rolling out network in most areas, the regulator believes competition is incentivising investment and therefore less regulation is needed, which is a clear positive in our view.
What’s it worth? Orange offers greater regulatory and capex clarity than European incumbent peers, as well as better growth (3% EBITDA CAGR, 2018-22E) with less leverage, for a c.7% FY19E FCF yield. Our 12-month ROIC-based price target is €19.2.
Exhibit 33: We estimate that French consolidation could create |
|
|
Exhibit 34: Digitally-enabled cost cutting is helping to drive |
|
|||||||||||||
significant value (driving up to 50% upside for ORAN) |
|
|
margins higher (Orange revenue and EBITDA growth) |
|
|||||||||||||
Summary of our French consolidation analysis, € bn |
|
|
|
|
|
|
|
|
|
|
|
|
|||||
35 |
|
|
at low-end |
at high-end |
|
|
60% |
3.0% |
|
|
|
|
|
|
|
||
|
|
|
|
|
|
|
|
|
|
||||||||
|
|
|
32 |
|
|
2.5% |
|
|
|
|
|
|
|
||||
|
|
|
|
|
|
|
|
|
|
|
|
||||||
|
|
|
|
|
51% |
|
|
|
|
|
|
|
|
|
|
||
30 |
|
|
|
|
|
|
50% |
|
|
|
|
|
|
|
|
|
|
|
|
|
|
|
|
|
2.0% |
|
|
|
|
|
1.8x |
|
|||
|
|
|
|
|
|
|
|
|
|
|
|
|
|
||||
25 |
|
|
|
|
|
|
|
|
|
|
|
|
|
|
|||
|
|
|
|
|
|
|
40% |
|
|
|
1.8x |
|
|
|
|||
|
|
19 |
|
|
|
|
|
1.5% |
|
|
|
|
|||||
20 |
|
|
|
|
|
|
|
|
|
|
|
|
|
|
|||
|
|
|
16 |
|
|
|
30% |
|
|
|
|
|
|
|
|
|
|
|
|
|
13 |
25% |
23% |
|
1.0% |
|
|
|
|
|
|
|
|||
15 |
|
|
|
|
|
|
|
|
|
|
|
||||||
|
|
|
|
|
|
|
|
|
|
|
|
|
|||||
10 |
|
9 |
7 |
|
|
11% |
|
20% |
0.5% |
|
|
|
|
|
|
|
|
|
|
|
|
|
|
|
|
|
|
|
|
|
|||||
|
|
|
|
|
|
|
|
|
|
|
|
|
|
|
|
||
5 |
|
|
|
|
|
|
|
10% |
0.0% |
|
|
|
|
|
|
|
|
|
|
|
|
|
|
|
|
|
|
|
|
|
|
|
|
||
0 |
|
|
|
|
|
|
|
0% |
2017 |
|
2018-22E CAGR (Gse) |
|
|||||
|
|
|
|
|
|
|
|
|
|
|
|
Revenue |
|
Adjusted EBITDA |
|
||
|
Market repair |
Cost synergies |
Total |
Total as % of |
Total as % of |
|
|
|
|
|
|
|
|||||
|
|
|
|
|
|
|
|
|
|
||||||||
|
|
|
|
|
|
|
|
|
|
||||||||
|
|
benefits |
|
|
market cap |
enterprise value |
|
|
|
|
|
|
|
|
|
|
|
|
|
|
|
|
|
|
|
|
|||||||||
Source: Goldman Sachs Global Investment Research. |
|
|
|
|
Source: Company data. |
|
|
|
|||||||||
28 November 2018 |
23 |
vk.com/id446425943
Goldman Sachs
SAP (SAPG.DE): S4 HANA gets into its stride
GS Analyst
Mohammed Moawalla
+44(20)7774-1726
mohammed.moawall
a@gs.com
Customers continue to migrate to the S4HANA platform with 2000 go-lives and 3000 ongoing implementation projects in 2018
Investment thesis: While the market is likely disappointed by the further push-out in the trajectory of margin expansion (announced at Q3 results), in our view the company is ‘crossing the chasm’ faster on the top-line towards a more recurring, subscription-led business model which carries higher lifetime value. The accelerated decline in on-premise licenses that we expect going forward is likely to weigh on operating margin expansion, but the core levers of the margin expansion story remain intact - notably cloud gross margin expansion and opex discipline.
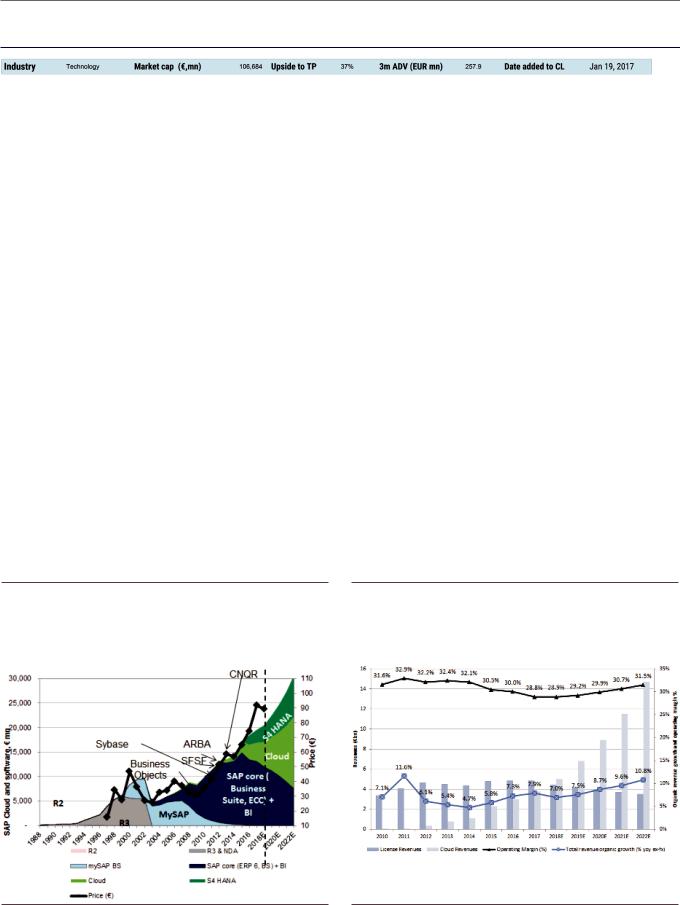
Product cycle: At our recent German Corporate Conference, SAP highlighted that it continues to see growth momentum in the S4HANA product cycle, with c.9000 customers in its fourth year of operations. SAP’s recent 3Q18 results also confirmed the core elements of our top-line thesis: accelerating growth in cloud subscriptions and momentum in the S4 HANA product cycle. We believe our estimate of a c.31% revenue CAGR (2017-22E) is underpinned by SAP’s broad competitive portfolio in cloud, through both its organic development in salesforce automation, services and marketing automation as well as its acquisitions of Hybris (ecommerce and customer engagement), Gigya (customer profiles of over 1 bn users that are GDPR compliant) and Callidus (specification and pricing).
What’s it worth? Valuation remains attractive, with our reverse DCF indicating the market is pricing in c.6% revenue growth on flat margins, which we view as conservative. In our view, this underestimates the growth prospects from the S4HANA product cycle and HANA Cloud Platform opportunity, and cross-selling synergies driving sustained growth in cloud. Our 12-month price target is €122 (ADR: US$142) and is based on 26x 2019E PF EPS.
Exhibit 35: We expect the next leg in SAP’s equity story to be driven by continued momentum in cloud and S4HANA
SAP revenue (€ mn), share price progression (1997-2018)
Exhibit 36: We expect operating margin to inflect in 2019 as cloud gross margin improvement and S&M cost discipline more than offset the negative impact from licenses decline
SAP’s License and Cloud revenue (€ mn) and organic revenue growth
(%) & operating margin (%)
Source: Bureau of Economic Analysis, Goldman Sachs Global Investment Research. |
Source: Company data, Goldman Sachs Global Investment Research. |
28 November 2018 |
24 |
vk.com/id446425943
Goldman Sachs
Telenet (TNET.BR): Top cable pick with digitalisation tailwind
GS Analyst
Michael Bishop
+44(20) 7552-4248
michael.bishop@gs.com
At its CMD on 5th December, we expect longer term growth guidance, further efficiency targets and a longer term shareholder remuneration framework.
In 3Q18, Telenet has increased EBITDA growth guidance to +8-8.5% for FY18 (vs +7-8% previously).
Investment thesis - risks increasingly priced in: The outlook for regulation in Belgium continues to lack clarity in our view. Coupled with ongoing competitive pricing action (e.g. Orange Belgium in mobile), this has led to a period of underperformance for Telenet. In our view, however, Telenet’s recent 3% price increase was supportive and at current valuation levels (6.5% 2019E unlevered FCF yield), we believe regulatory uncertainty is priced in. We also believe that the risk of a new entrant in Belgian mobile is ultimately low. At our recent conference, Telenet highlighted that it still believes there are drivers of top-line growth from more product segmentation, continued pricing power and B2B. This, coupled with continued cost savings and falling capex, can drive material FCF growth from 2019E.
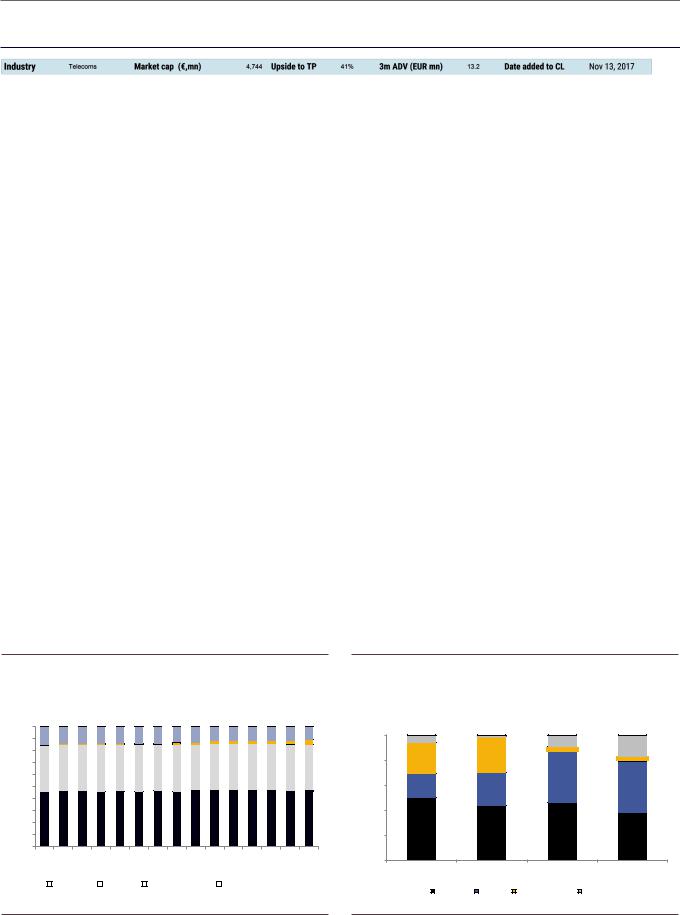
Structural quality and digitalisation potential: Telenet scores top of our telecom team’s structural framework, based on its strong fixed/convergent exposure, attractive (three-player) market structure and low B2B exposure, all further supporting the company’s structural position. We view Telenet as the cable player most exposed to digitalisation as it moves to a new IT platform and increasingly converges its fixed/mobile offerings following the acquisition of mobile operator BASE in 2016. In conjunction with a material fall in capex from 2019E, as Telenet finishes its fixed and mobile upgrades, we expect strong FCF growth +10% (18-20E) supporting a 12% recurring dividend yield.
Consolidation potential: We note that the recent press reports regarding the potential for further market consolidation in the Belgian market, potentially involving ORAB/TNET and Voo, could not only offer material synergies to Telenet but also potential regulatory relief if Orange Belgium were to acquire Voo (link).
What’s it worth? Our 12-month price target is €58.0. We assign a 70% weighting to a fundamental valuation (DCF-based) of €58.0, and a 30% weighting to an M&A component at the same valuation.
Exhibit 37: Telenet continues to maintain its market share in a competitive landscape
Broadband market share
100% |
|
|
|
|
|
|
|
90% |
|
|
|
|
|
|
|
80% |
|
|
|
|
|
|
|
70% |
|
|
|
|
|
|
|
60% |
|
|
|
|
|
|
|
50% |
|
|
|
|
|
|
|
40% |
|
|
|
|
|
|
|
30% |
|
|
|
|
|
|
|
20% |
|
|
|
|
|
|
|
10% |
|
|
|
|
|
|
|
0% |
|
3Q15 |
4Q15 |
1Q16 |
2Q16 |
|
|
1Q15 |
2Q15 |
3Q16 |
4Q16 |
1Q17 |
2Q17 |
3Q17 |
4Q17 |
1Q18 |
2Q18 |
3Q18 |
|
Proximus |
|
Telenet |
|
Orange Belgium |
|
Other/elimination |
|
|
|
|
Exhibit 38: Telenet is a strong fixed/convergent player in an attractive (three-player) market structure
Market share by product in 2018
100% |
|
5% |
9% |
|
|
|
17% |
||
|
|
28% |
|
|
80% |
25% |
|
|
|
|
|
|
||
60% |
|
|
41% |
|
19% |
26% |
|
41% |
|
40% |
|
|
|
|
20% |
50% |
44% |
46% |
38% |
|
||||
|
|
|||
0% |
Mobile |
Postpaid |
Broadband |
Pay-TV |
|
Proximus |
Telenet |
Orange Belgium |
Other |
Source: Company data. |
Source: Company data |
28 November 2018 |
25 |

vk.com/id446425943
Goldman Sachs
Telia (TELIA.ST): Best-in-class ‘digital divergence’ cost cutter
GS Analyst
Andrew Lee
+44(20) 7774-1383
andrew.j.lee@gs.com
We look to an expected strategic update early in 2019 to provide detail on the multi-year cost-cutting opportunity.
Investment thesis - Telia offers standout FCF growth and shareholder returns while largely avoiding the risks and complexities that plague the sector. FTTH coverage in Sweden and fibre overbuild of Telia’s incumbent network are among the highest in Europe, while Telia has the lowest domestic broadband market share of any incumbent. We argue this means limited capex, as well as lower regulatory and overbuild-related competitive risks going forward; in addition, Telia has lower-than-average B2B exposure and financial leverage.
Superior returns and growth profile: Falling capex, combined with best-in-class ‘digital divergence’ cost-cutting, drives a 9% EBITDA-capex CAGR over 2017-22E and sees returns (ROIC) rising by a third over the next five years, on our forecasts. With the shares trading at a c.7% 2019E unlevered FCF yield, a 10% discount to the sector, and offering a 9% 20109E capital returns yield (dividends + buybacks), we see a compelling opportunity.
Simpler structures, avoiding sector banana skins – Recent asset sales mean that Telia’s group structure has become simpler in recent years and now largely avoids the risks associated with complexity elsewhere in the sector. In addition, Telia (along with Telenor) is in our view a best-in-class ‘digital divergence’ cost-cutter, with a large cost base and relatively simple execution. We believe the market underestimates the scale and sustainability of these savings opportunities.
Our Telia EBITDA forecasts are 3%/5% ahead of 2019/20 company-compiled consensus and our Buy case is non-consensual, driven by an attractive combination of cost-cutting, limited competitive, capex and regulatory risk, low B2B exposure and low gearing.
What’s it worth? Our 12-month, ROIC-based price target is Skr54.
Exhibit 39: Versus the sector, Telia offers fewer risks, higher growth and positive earnings momentum in our view; Telia trades at a 10% discount to the sector on unlevered 2019E FCF yield and offers sector-leading shareholder returns
Fixed-line simplicity |
|
Growth, returns and momentum |
Attractive valuation vs. sector |
|||||
High overbuild |
Pain already taken |
Low capex risk |
Higher growth: cost |
Improving returns |
Positive earnings |
Discount to sector |
High shareholder returns |
|
|
Telia Sector |
|
cutting & peaking capex |
|
momentum |
Telia |
Sector |
9.3% |
|
|
|
|
|
||||
|
|
|
|
|
|
|
|
|
|
|
|
|
|
|
Telia |
|
|
2022E |
|
7.0% |
|
|
|
|
|
|
|
|
|
|
|
6.0% |
5.7% |
|
|
|
|
|
|
|
|
|
2017 |
|
|
||
|
|
|
|
|
|
|
Sector |
|
|
2020E |
|
|
|
|
|
|
|
|
|
|
|
|
|
||
|
|
|
|
|
|
|
|
|
|
2019E |
|
|
64% |
30% |
45% |
68% |
84% |
43% |
9% |
5% |
6.0% |
8.1% |
3% |
5% |
|
FTTH coverage by |
Broadband market |
Total FTTH coverage |
EBITDA-capex CAGR |
Telia ROIC |
Telia EBITDA |
Unlevered FCF yield 2019E |
Buyback + dividend yield 2019E |
non-incumbents |
share (retail + |
at country level |
2018-22E |
|
GS vs. consensus |
|
|
|
wholesale) |
|
|
|
|
|
|
Source: Goldman Sachs Global Investment Research, Company compiled consensus, FactSet.
28 November 2018 |
26 |
vk.com/id446425943
Goldman Sachs
Wirecard (WDIG.DE): Wired for growth
GS Analyst
Mohammed Moawalla
+44(20)7774-1726
mohammed.moawall
a@gs.com
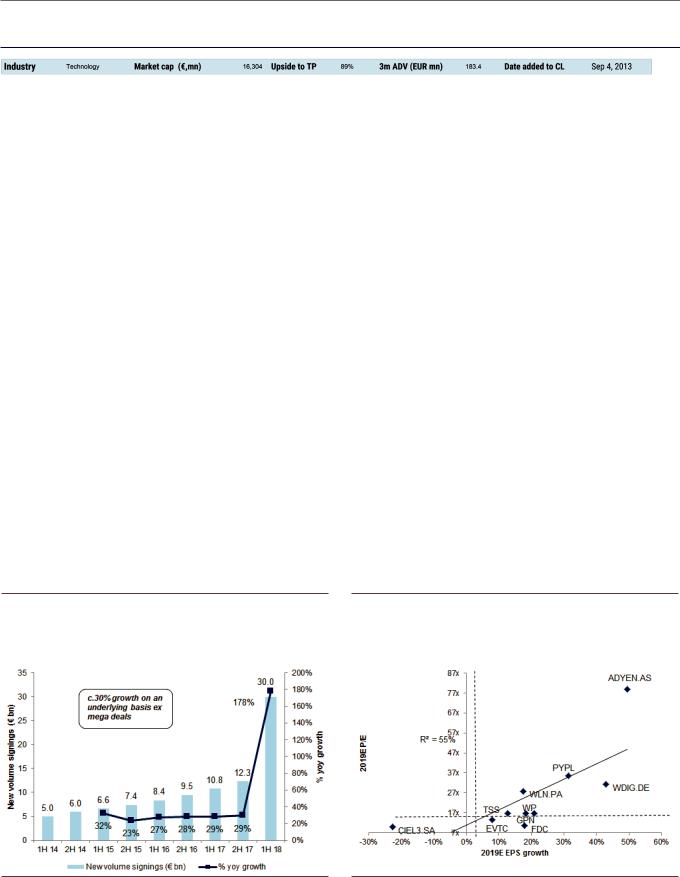
We forecast Wirecard can sustain c.25%+ organic revenue growth over the next 2-3 years
We expect industry consolidation to underpin the strategic value of high-quality assets like Wirecard.
Investment thesis: The complex payments landscape is moving online faster than ever and Wirecard, as an online-first leader, is well positioned to capitalise on this industry growth. Wirecard is also expanding its geographic footprint in the fast-growing Asian markets, and has additional cross-selling and upselling opportunities as it integrates recent acquisitions into its business. These three factors underpin our forecast that Wirecard’s consistent c. 25% organic revenue growth is sustainable in the medium term.
Structural growth: Only 15% of global transactions are electronic, of which only c.8% are fully digitised. We therefore expect market growth of c.15% pa over the next three years, with Wirecard well positioned in fast-growing markets such as Asia, LatAm, and Africa through recent acquisitions. Partnerships, for example with AliPay and WeChatPay, also give Wirecard exposure to Chinese tourist spend, further expanding its reach.
Vision 2025: Wirecard announced its 2025 financial targets at its recent CMD (transaction volume of at least €710 bn, revenue of €10 bn+ and EBITDA of €3.3 bn+, >65% FCF conversion of EBITDA) which imply c.25%+ 2020-25E transaction volume, revenue and EBITDA CAGRs. In our view, this indicates the sustainability of above-market growth for Wirecard over the long term, given continued market share gains, and would be viewed positively.
What it’s worth? Our 12-month price target is €250, based on a 70% weighting to our core PEG-based valuation of €235/share (implied 55.5x 2019E PF EPS) and a 30% weighting to our M&A value of €285/share (12.5x 2019E EV/sales, towards the top end of the M&A transactions in the payments space).
Exhibit 40: Contract win traction, especially post large contract wins such as Credit Agricole, should start being reflected in new volume signings, a forward indicator of top-line growth
New volume signings (half yearly), € bn and % yoy growth
Exhibit 41: Wirecard trades at a discount to payment peers as well as global high-growth tech players, despite stronger growth momentum
Source: Company data, Goldman Sachs Global Investment Research. |
Source: Company data, Bloomberg, Goldman Sachs Global Investment Research. |
28 November 2018 |
27 |
vk.com/id446425943
Goldman Sachs
Anglo American Plc (AAL.L): Improved commodity mix
GS Analyst
Eugene King
+44(20)7774-2447
eugene.king@gs.com
On delivery of production from the Quellaveco project, Anglo’s earnings profile will become more copper-weighted (starting FY22/23E).
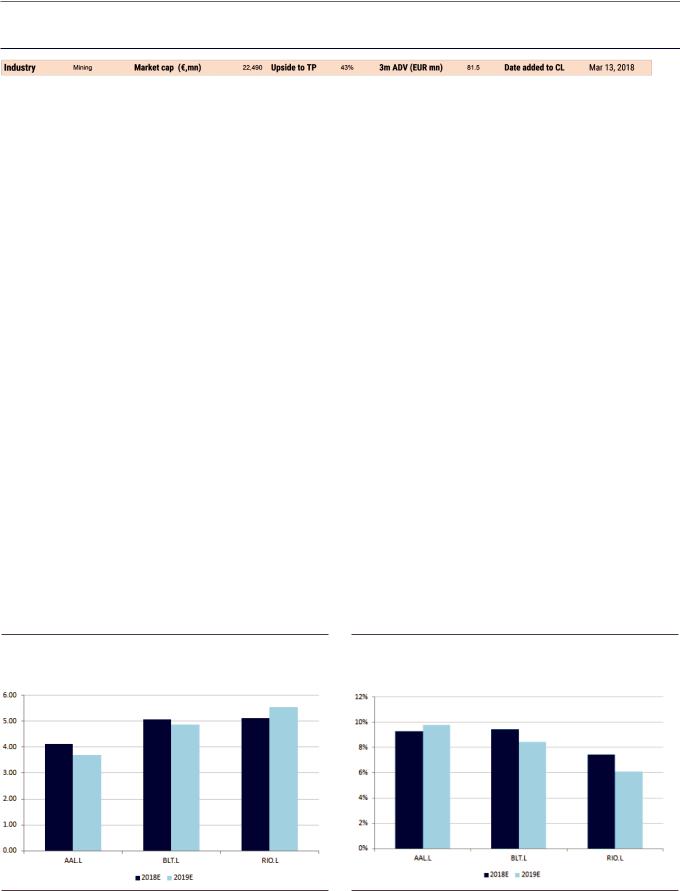
Investment thesis: Our upgrade of Anglo earlier this year was a function of higher commodity forecasts, improved sentiment towards South Africa following the election of President Cyril Ramaphosa, and the rationalization of Anglo’s portfolio (from 45 assets in 2015 to <30 now) with disposal of Tier 4/low-margin assets. At current levels the stock is also compelling from a valuation perspective. AAL currently trades at 3.8x 2019E EV/EBITDA vs. peers on an average 4.6x. We consider this discount unwarranted given the strong FCF generation / returns potential of the company and its attractive commodity mix.
Commodity mix to strengthen: Anglo American generates more than 50% of its earnings (2019E EBITDA) from bulk commodities, iron ore and coal. While investors remain bearish on these commodities in our view, it is notable that iron ore and met coal prices have remained strong in recent months, despite trade tensions. Copper, a metal on which we are relatively positive, is the next largest contributor to earnings (at c.25% of 2019E EBITDA). As it relates to its copper production, Anglo recently announced plans to start construction of its Quellaveco project.
Mind the EM risk: Investing in Anglo American carries unavoidable exposure to generic South Africa risk. This is a reflection of the significant contribution to Anglo’s earnings made by assets located in South Africa (c. 50% of EBITDA), and the high proportion of its balance sheet liquidity that resides there (subject to exchange controls). As such, any investor concerns relating to EM growth tend to be accompanied by EM equity outflows, often impacting Anglo American’s share price, at least in the short term. This is also a potential positive for the company, i.e. if sentiment towards EM improves, EM flows tends to help Anglo’s share price, irrespective of mining fundamentals.
What’s it worth? We value the shares at 5x 2019E EV/EBITDA, with a 12-month price
target of 2,250p.
Exhibit 42: Anglo has one of the lowest EV/EBITDA multiples in the sector
(x)
Exhibit 43: …and is also trading at a discount to peers on FCFy
(%)
Source: Company data, Goldman Sachs Global Investment Research. |
Source: Company data, Goldman Sachs Global Investment Research. |
28 November 2018 |
28 |
vk.com/id446425943
Goldman Sachs
ArcelorMittal (MT.AS): A value opportunity with earnings momentum
GS Analyst
Eugene King
+44(20)7774-2447
eugene.king@gs.com
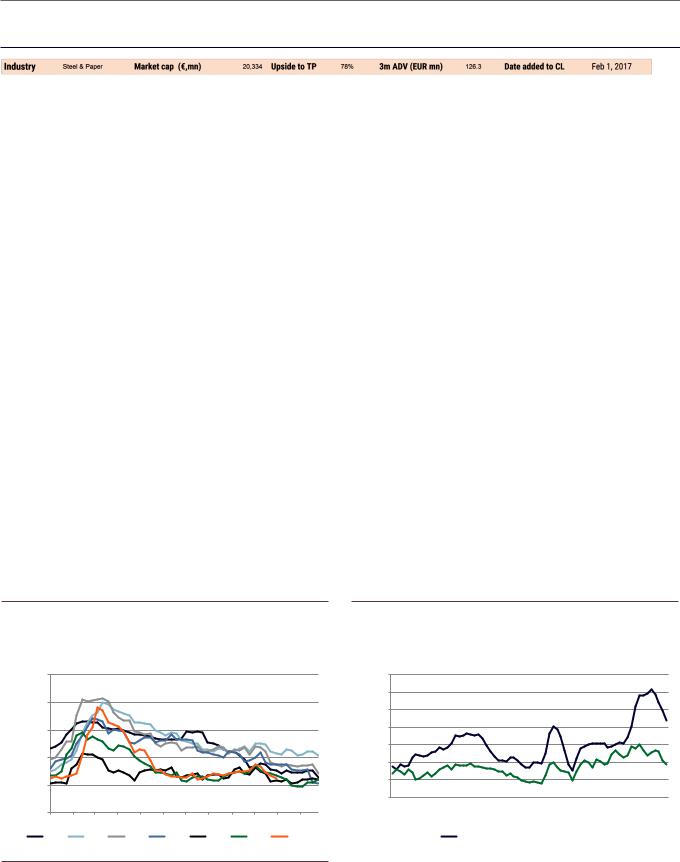
Our analysis shows the market is valuing the carbon sector on a peak earnings multiple but using a less than peak EBITDA number for 2019.
Investment thesis: Global steel prices and spreads have declined from the 2018 peak but remain healthy in a historical context owing to: (1) China supply discipline and solid onshore demand reducing exports; (2) regional tariffs (mainly US and Europe); and (3) global GDP remaining at healthy levels (albeit slowing into 2019). From here, the Brazilian steel market (important for Mittal) should continue to improve in 2019, in our view: the election is over and our economists expect growth to accelerate.
Constructive on steel…the set-up: Steel equities have underperformed in 2018, despite Bloomberg consensus FY18 EBITDA estimates for our carbon steel coverage having been revised up by 8% on average ytd. We believe that the sector’s underperformance has been driven by heightened trade tensions between the US and China, increasing concerns of a China slowdown and, most recently, concerns around auto demand. Fundamentals, however, remain largely unchanged compared to our expectations and with potential for improvement in some regions.
Fundamental strength remains: From here, we expect demand to remain broadly stable, and Chinese supply discipline to remain intact, supporting healthy steel prices and spreads. Given the Chinese government’s initiatives to control air pollution for 2018-2020, our China Basic Materials team sees risk of more supply disruption, estimated at a further 5% decline in effective steel capacity – a positive read-across to European steel equities.
What’s it worth? Taking the view that 2019 EBITDA will be lower (i.e. in a falling steel price environment), we would expect the shares to trade closer to a c.6x mid-cycle multiple (vs. just 3.9x 2018E EV/EBITDA), implying meaningful upside. We value ArcelorMittal on a 5.5x 2019E EV/EBITDA. Our 12-month price target is €35.5.
Exhibit 44: Despite exports from China being down ytd, Chinese |
Exhibit 45: Even though margins are down from peak levels, they |
steel inventories remain low |
are healthy in a historical context |
China steel inventory at mill and traders (kt) |
(Europe and USBF steel margins $/t) |
(kt) |
40,000 |
|
|
|
|
|
|
|
|
|
|
|
800 |
|
|
|
|
|
|
|
|
|
|
|
|
700 |
|
inventory (mill+trader) |
|
|
|
|
|
|
|
|
|
|
|
|
|
35,000 |
|
|
|
|
|
|
|
|
|
|
Spread in US$/t |
600 |
|
|
|
|
|
|
|
|
|
|
|
|
|||
30,000 |
|
|
|
|
|
|
|
|
|
|
500 |
||
|
|
|
|
|
|
|
|
|
|
|
|||
|
|
|
|
|
|
|
|
|
|
|
400 |
||
25,000 |
|
|
|
|
|
|
|
|
|
|
300 |
||
|
|
|
|
|
|
|
|
|
|
|
|||
steel |
20,000 |
|
|
|
|
|
|
|
|
|
|
|
200 |
China |
|
|
|
|
|
|
|
|
|
|
|
|
|
|
|
|
|
|
|
|
|
|
|
|
|
100 |
|
15,000 |
|
|
|
|
|
|
|
|
|
|
|
|
|
|
|
|
|
|
|
|
|
|
|
|
|
|
|
|
Jan |
Feb |
Mar |
Apr |
May |
Jun |
Jul |
Aug |
Sep |
Oct |
Nov |
Dec |
|
|
2012 |
|
2013 |
|
2014 |
2015 |
2016 |
|
2017 |
|
2018 |
|
|
Jan-13 |
Jun-13 |
Nov-13 |
Apr-14 |
Sep-14 |
Feb-15 |
Jul-15 |
Dec-15 |
May-16 |
Oct-16 |
Mar-17 |
Aug-17 |
Jan-18 |
Jun-18 |
Spot |
US HRC Spread |
|
EU HRC Spread |
|
Source: Goldman Sachs Global Investment Research, Mysteel, CISA. |
*HRC price minus (1.6*iron ore+0.6*Coal +0.2*Scrap). |
|
|
|
|
|
Source: SBB. |
28 November 2018 |
29 |
vk.com/id446425943
Goldman Sachs
BP Plc (BP.L): Approaching a FCF sweetspot; higher cash returns ahead
GS Analyst
Michele Della Vigna
+44 20 7552-9383
michele.dellavigna@gs.co m
In 3Q18, BP’s downstream business delivered strong operating income, +25% above consensus, helped by wider WCS-WTI differentials
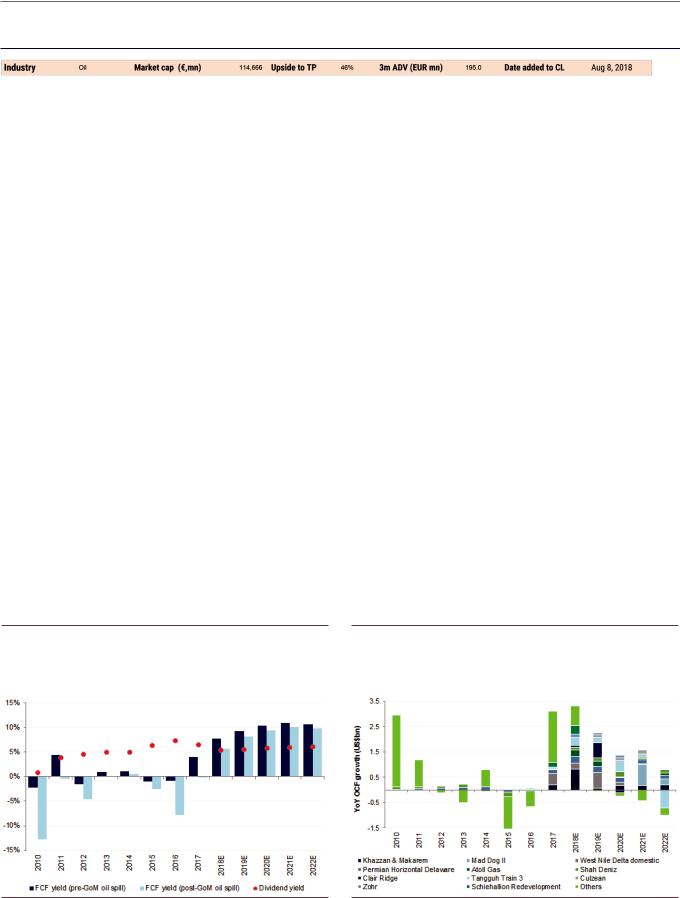
Investment thesis: BP is on the cusp of delivering one of the industry’s strongest pipelines of new oil & gas projects, with sector-leading production growth, FCF improvement and unproductive capital release from mega-projects over 2018-22E. Overall, we believe that BP offers one of the most interesting turnaround stories in the sector.
Strong 3Q18 with strong FCF: We identify BP as a structural winner based on the materiality and potential profitability of its portfolio of projects and cash flow. BP delivered strong 3Q18 results with beats across all divisions and FCF generation coming in especially strong at US$3.6 bn. Overall, FCF so far this year has been US$9.6 bn, a higher level than full year FCF for most of the past decade. We expect BP’s OCF to reach its sweetspot by 2020, particularly once Macondo related cash payments falls to US$1 bn pa.
On the cusp of delivery: Over the past 12 months, BP has delivered six major oil & gas upstream developments, yielding c.241 kboe/d of production growth in 2018 (vs. 2017). An additional three projects are expected to come online by 2018 year-end; we expect these nine major developments to contribute c.755 kboe/d of production growth once at full capacity, around 2020.
Well-positioned downstream business: With 1.9 mn b/d of refining capacity and 15.1 mtpa of petrochemicals capacity globally, BP has among the most robust and diversified downstream businesses within EU Big Oils. In addition, BP’s US refineries should benefit through 2020E from wider WCS-WTI differentials, in our view positioning it well to benefit from the tightening IMO regulations on marine fuel from 2020.
What’s it worth? Our 12-month price target of 750p is based on 7.7x EV/DACF (20-year historical average) applied to 2019E cash flow. Our ADR price target is US$61.
Exhibit 46: After almost a decade of weak FCF, BP approaches its FCF sweetspot...
BP FCF yield pre-GoM oil spill payments, post, and dividend yield
Exhibit 47: BP should benefit from material Top Projects output growth in the coming years, which should translate into a significant cash flow uplift
BP Top Projects, yoy operating cash flow growth, 2010-21E, US$ bn
Source: Company data, Goldman Sachs Global Investment Research. |
Source: Company data, Goldman Sachs Global Investment Research. |
28 November 2018 |
30 |