

GS_The_European_Conviction_List_watermark
.pdfvk.com/id446425943
Goldman Sachs
Fresnillo Plc (FRES.L): Attractive entry point post recent sell-off
GS Analysts
Eugene King
+44(20)7774-2447
eugene.king @gs.com
Investment thesis: Fresnillo remains one of our top picks in the precious metals space. Our thesis is based on the its strong growth pipeline, potential dividend growth, mixed gold/silver exposure and attractive valuation vs. history which is basically unchanged. Additionally, once Randgold is de-listed post its merger with Barrick (delisting is scheduled for Jan 2, 2019) - Fresnillo will be the only listed precious metals company in the FTSE 100 which should see additional investor interest.
Preference for returns-focus: Fresnillo screens as very attractive in our investment framework which favours companies with strong balance sheets/FCF generation and shareholder returns as shown in Exhibit 48 shows.
Return of ‘fear’ to support gold price: Our commodities team still sees solid fundamentals for gold especially on increasing concern about the US expansion cycle. However, they see short-term headwinds from volatility in EM currencies, the CNY in particular. Their forecasts, based on their Fear and Wealth framework, are driven by: (1) the expectation that low US unemployment rate combined with slowing growth and rising inflation will boost “fear” related DM gold demand; (2) a rebound in EM dollar GDP to strengthen EM gold demand through the “wealth” channel; and (3) rising geopolitical tensions create upside risk to central bank gold demand.
Catalyst: While the shares have been weak recently due to: (i) reports about tougher mining regulations in Mexico and; (ii) the company’s cut to silver guidance due to operational challenges, we believe the share price reaction has been overdone. With the expected delisting of Randgold, Fresnillo remains one of the best positioned gold stocks listed in the UK and among the few offering an avenue for UK-based investors to participate in the space.
What’s it worth? We value Fresnillo on a 50/50 blend of 25x 2019E P/E and 1x NAV to derive our 12m price target of 1,475p.
Exhibit 48: Attractive dividend yield and solid balance sheet... |
Exhibit 49: ...against a background of strong production |
Source: Company data, Goldman Sachs Global Investment Research |
Source: Company data, Goldman Sachs Global Investment Research |
28 November 2018 |
31 |
vk.com/id446425943
Goldman Sachs
Naturgy Energy Group (NTGY.MC): Attractive income; SOTP optionality
GS Analyst
Manuel Losa
+44(20)7774-8817
manuel.losa @gs.com
For 2021 we are now c.40% ahead of Bloomberg consensus on EPS.
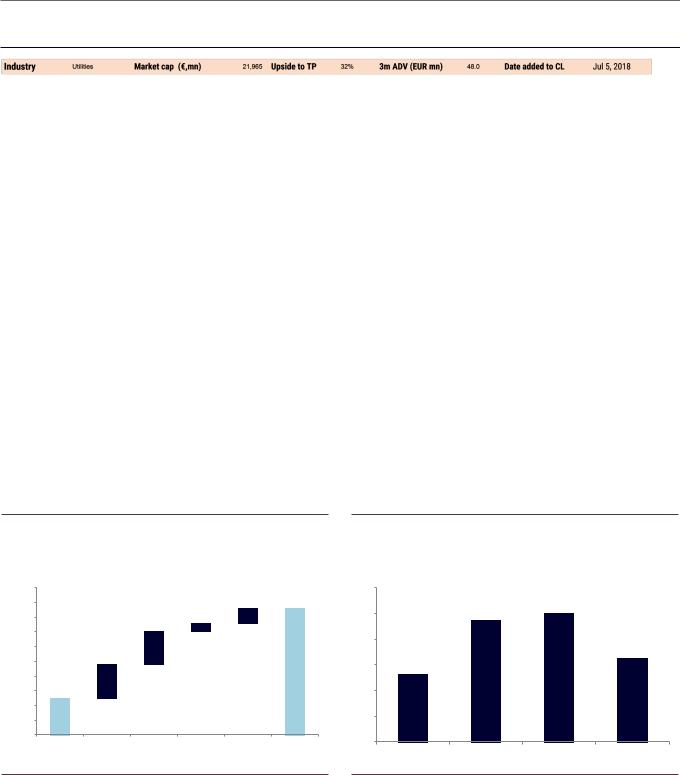
Investment thesis: We continue to believe that Naturgy will deliver an industry-leading level of organic growth over the coming years. We expect the company to use the proceeds of better operating performance (and any disposals) to increase shareholder remuneration, in the form of higher dividends and share buy-backs. Overall, we believe nearly 40% of the company’s market cap could be returned to shareholders in cash over the next five years. We also see significant upside potential from portfolio simplification.
Value creation for shareholders: Cost cutting, organic growth in the regulated business and recovery in the liberalized activities (gas supply and electricity generation) will be the main drivers of 4% annual EBITDA growth for the group out to 2022E. Given the large discrepancy between public and private transaction valuations, we also see potential for portfolio rationalisation which could realise value.
Getting paid to wait for value crystallization: Within its new dividend policy, management has said that the DPS floor in 2018 will be €1.3, which will grow by 5% pa over 2018-22. The combination of dividends (min. of €6.6 bn over 2018-22) and buybacks (€2 bn over 2018-22) implies that shareholders will receive c.38% of market cap over the next five years.
What’s it worth? Our 12-month price target of €29 is based 30% on an M&A valuation of €32/sh (based on our transaction-based SOTP) and 70% on a fundamental valuation, based on 60% P/E (€30/sh) and 40% DDM (€26/sh).
Exhibit 50: SOTP valuation suggests incremental value of c.€12 |
Exhibit 51: We are c.20% ahead of consensus on 201922E net |
over current peer trading multiples |
income on average |
Incremental value over trading multiples-based SOTP |
Net income - GS forecasts vs. Reuters consensus |
|
35 |
|
|
|
30% |
|
33 |
|
|
|
|
|
31 |
|
2 |
32 |
25% |
|
|
|
|||
|
29 |
|
1 |
|
|
|
4 |
|
|
20% |
|
|
27 |
|
|
||
|
|
|
|
|
|
€/sh |
25 |
5 |
|
|
15% |
|
23 |
|
|
|
|
|
|
|
|
|
|
|
21 |
|
|
|
10% |
|
19 |
20 |
|
|
|
|
17 |
|
|
|
5% |
|
|
|
|
|
|
|
15 |
|
|
|
|
Trading |
Spain gas |
Spain elec. |
Latam elec. |
Other |
Transaction |
0% |
multiple SOTP |
distribution |
Distribution |
Distribution |
|
multiple SOTP |
|
25%
24%
16%
13%
2019 |
2020 |
2021 |
2022 |
Source: Goldman Sachs Global Investment Research |
Source: Thomson Reuters, Goldman Sachs Global Investment Research |
28 November 2018 |
32 |
vk.com/id446425943
Goldman Sachs
Randgold Resources (RRS.L): Poised for success
GS Analyst
Eugene King
+44(20)7774-2447
eugene.king@gs.com
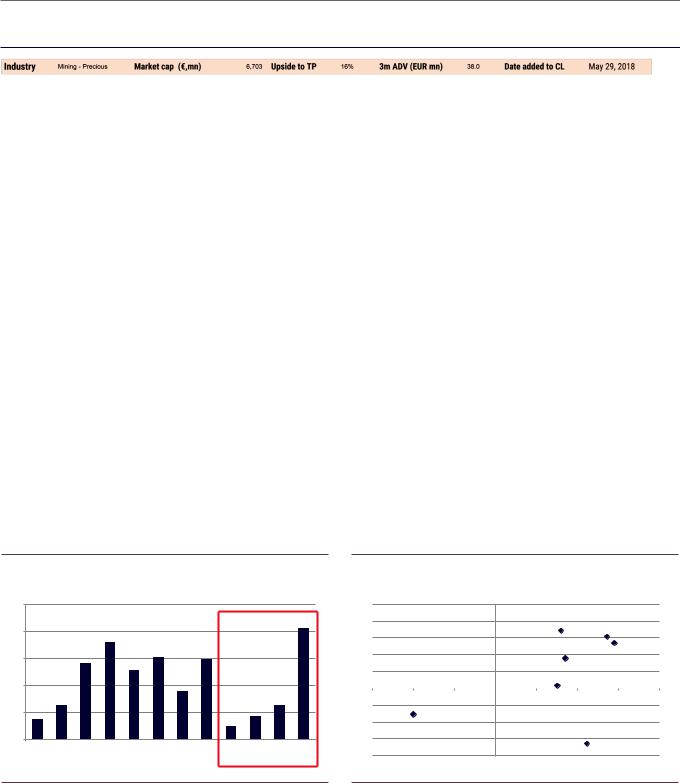
Investment thesis: Post closure of the Randgold/Barrick merger (the merger has received all necessary approvals and is expected to be closed by January 1, 2019, after which the combined entity will start to trade in the US/Canada) the new company will be the biggest publicly listed gold company with a majority of its assets in the first/second quartile of the cost curve. According to management, the new entity will focus on returns/deleveraging and will allocate capital only to the best projects in the company’s portfolio. Note that the company will be led by Randgold CEO Mark Bristow - in our view, one of the most respected CEOs in the gold industry.
Focus to remain on returns - According to management, the focus of the new company will remain on returns i.e. the company will only allocate capital to Tier 1 projects and the remaining cash flow will be returned to shareholders. Also - as part of the deal being closed - a number of smaller/higher cost mines from the combined entities are likely to be sold (according to the company management) which should generate significant cash inflow - likely to be utilised for deleveraging and ramping up returns.
Catalyst: We believe that Randgold remains the best positioned company in terms of balance sheet/asset quality across our precious mining coverage. With the merger almost complete, this sets up an attractive investment opportunity for investors given the high quality of both the company and management.
What’s it worth? We value Randgold using a 50/50 blend of 25x 2019E P/E and 1x NAV to derive our 12-month price target of 7500p.
Exhibit 52: FCF improved, see significant improvement in 2H18
4Q18 GSe
250
200
150
100
50
0 


 1Q16 2Q16 3Q16 4Q16 1Q17 2Q17 3Q17 4Q17 1Q18 2Q18 3Q18 4Q18
 FCF (US$ mn)
Exhibit 53: We believe Randgold has one of the best combinations of strong balance sheet and growing dividends in our coverage
|
|
|
|
2.50 |
|
|
|
|
|
|
|
|
|
|
2.00 |
|
|
Polyus |
Polymetal |
|
|
(2018E) |
|
|
1.50 |
|
|
|
|
|||
|
|
|
|
|
|
|
||||
|
|
|
|
|
|
AngloGold |
||||
|
|
|
|
|
|
|
|
|||
EBITDAto |
|
|
1.00 |
|
|
Gold Fields |
|
|
||
|
|
|
|
|
|
|
||||
|
|
0.00 |
|
|
Fresnillo |
|
|
|
||
|
|
|
|
0.50 |
|
|
|
|
|
|
-30% |
-20% |
-10% |
0% |
10% |
20% |
30% |
40% |
|||
Netdebt |
|
Centamin |
|
-0.50 |
|
|
|
|
|
|
|
|
-1.00 |
|
|
|
|
|
|
||
|
|
|
|
|
|
|
|
|||
|
|
|
|
-1.50 |
|
|
|
Randgold |
|
|
|
|
|
|
-2.00 |
|
|
|
|
|
|
|
|
|
|
|
|
|
|
|
|
|
|
|
|
|
DPSCAGR(17-19E) |
|
|
|
|
||
Source: Company data, Goldman Sachs Global Investment Research |
Source: Company data, Goldman Sachs Global Investment Research |
28 November 2018 |
33 |
vk.com/id446425943
Goldman Sachs
RWE (RWEG.DE): Five routes to a re-rating
GS Analyst
Alberto Gandolfi
+44 20 7552-2539
alberto.gandolfi@gs.com
A confirmation of the government’s phase out strategy (due at the beginning of December) should be a positive for the stock.
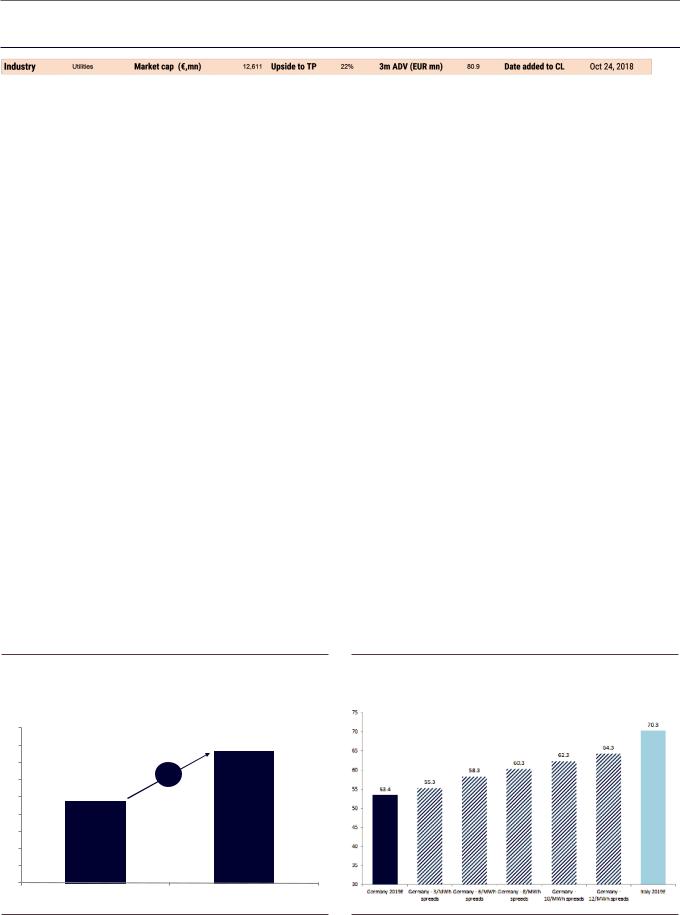
Investment thesis: We see five routes to a re-rating at RWE: (1) Renewables - RWE is the only wind/solar developer that (by 2020E) would trade on a single-digit P/E; (2) Restructuring - becoming a pure renewables player and stripping out the legacy generation business could unlock >30% of value; (3) Running low on lights - over a quarter of German baseload capacity will retire by 2025, tightening the power market and supporting power prices/spreads; (4) Reaction to the Hambach lignite mine issue appears overdone - we estimate the net impact from a permanent closure at <€1 bn, before any potential compensation. And (5) rates hedge - each 100bp increase in real rates would lower economic net debt by >€ 1bn on our estimates.
Renewable focus, restructuring optionality. We believe RWE encapsulates renewable growth and restructuring optionality at an attractive entry point. Its renewable “core” - which on our estimates makes up 90% of the company’s equity value - trades at c.7.5x 2020E EBITDA, a significant discount to peers. Separating it from the legacy generation business - whose liability-driven negative equity is more than offset by the value of RWE’s financial stake in E.ON - could unlock >30% of value.
More constructive on power prices. Over the past decade, power prices in Germany have declined c.80%, owing to rising oversupply; only higher commodities were recently able to help power prices on the way up. Germany is now set to reverse this trend, with over a quarter of the country’s baseload capacity due to retire by 2025. We expect a gradual decommissioning of coal and lignite to support margin expansion and provide c.€200-250 mn upside to EBITDA. Due to similar offsets, we see the reaction to the recent halt at Hambach mine as overdone, and estimate a potential net impact of <€1 bn excluding any potential compensation.
What’s it worth? Our 12-month price target of €23.1 is derived from a 50/50 combination of our SOTP (€25.3/sh) and a P/E relative valuation in line with the sector average at 15x 2019E (€21.0/sh).
Exhibit 54: A separation of core and legacy activities could unlock c.30% of value
(€ per share)
28 |
|
26 |
25.3 |
24 |
|
22 |
+30% |
|
20 19.5
18
16
14
12
10
Share price |
SOTP fair value |
Exhibit 55: While thermal closures might be seen a negative, we expect to see offsets in the form of rising dark/spark spreads
Germany 2019E forward curve, assuming rising dark spreads (€/MWh)
Source: Goldman Sachs Global Investment Research |
Source: Bloomberg, Goldman Sachs Global Investment Research |
28 November 2018 |
34 |
vk.com/id446425943
Goldman Sachs
Voestalpine (VOES.VI): Value in Carbon Steel
GS Analyst
Eugene King
+44 20 7774-2447
eugene.king@gs.com
EU HRC prices have recovered to their current level of c.€550/t, an increase of c.3% ytd.
We forecast 7% EBITDA growth in CY2019 for Voestalpine, well above our carbon steel coverage average of c.1%.
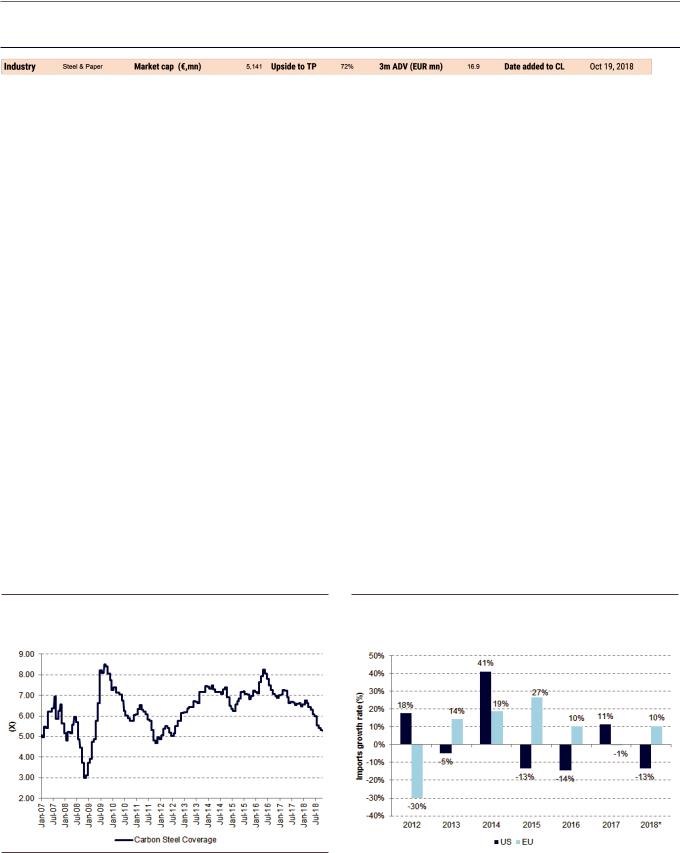
Investment thesis: We believe Voestalpine offers attractive risk-reward now that the Linz relining is completed. Recent share price underperformance (the stock is >30% below YTD highs) has been driven by a broader sector de-rating, concerns over the Linz relining and most recently investor worries around European and Chinese autos. From here, we expect earnings to benefit from: 1) the steel relining cost headwinds reversing, 2) emission test related costs not recurring in the next fiscal year, and; 3) further ramp-up of the US automotive plant and HBI plant. We also view the company’s exposure to the oil & gas-related heavy plate and seamless tube markets as a positive given our oil teams’ expectations for increasing capex.
Steel fundamentals remain solid: The underperformance of our steel coverage has been mainly driven by investor concerns around trade tensions, FX volatility, the macro backdrop and a turn in the auto cycle, leading to de-rating of multiples. We see this as overdone and believe the sector’s fundamentals remain solid. The EU safeguard investigation’s preliminary response has also been announced, and has been able to address rising imports into Europe post the Section 232 tariffs.
Attractive entry point: We believe the underperformance of the shares has been partly driven by the general sector de-rating, exacerbated by weaker (Bloomberg) consensus earnings expectations for Voestalpine compared with the rest of the sector, owing to the significant relining of its Linz facilities, which was guided to cost €180mn at the EBIT level in the fiscal year ending in March 2019. We view the company’s exposure to the oil & gas-related heavy plate and seamless tube markets as a positive given the recent oil price rally, which will likely lead to higher capex from these end markets.
What’s it worth? Our target EV/EBITDA multiple of 6.5x implies a 12m PT of €50.5.
Exhibit 56: We have seen an extensive multiple de-rating since 2016 for carbon steel...
Average EV/EBITDA multiple for our carbon steel coverage
Exhibit 57: ...however, US imports of carbon steel are down 13% ytd, carbon steel imports into EU are up 10% ytd
Source: Datastream |
* refers to Jan - Aug period |
|
|
|
|
|
Source: Goldman Sachs Global Investment Research, Datastream, Bloomberg, Eurofer, US |
|
Census Bureau |
28 November 2018 |
35 |
vk.com/id446425943
Goldman Sachs
Anheuser-Busch InBev (ABI.BR): Brewing up a storm
GS Analyst
Mitch Collett, CFA
+44 20 7774-1060
mitch.collett@gs.com
The company’s recent dividend cut increases the pace of de-gearing to 0.6x per annum and with only a 40% payout ratio in FY19 the company offers a DY of 2.6%, in-line with staples average.
Investment thesis: ABI offers above-sector average EBITDA and EPS growth, supported by strong end-market concentration levels. From here, we expect ABI to continue driving growth through acquisitions, with our forecasts including an assumed US$80 bn acquisition in 2020, driving 27% EPS growth (and implying a 2020E P/E of 14.9x). We also believe the current share price fails to capture the company’s organic growth advantage (FY18-20E organic sales growth 5.3% vs. sector 4%), margin expansion opportunity, advantaged market positioning/structure and FCF conversion.
Strong positioning: With high market shares (revenue-weighted average market share of 49% post SAB deal), significant end-market concentration (HHI of 0.44 vs. 0.21 sector average) and high gross margins (61% in 2016 vs. sector at 52%), ABI is one of the most strongly positioned stocks in the global Consumer Staples space, in our view. While 3Q18 results were below expectations, the company’s 4.6% organic sales growth and 7.7% organic EBIT growth (for 9M18) remains towards the top of European Staples.
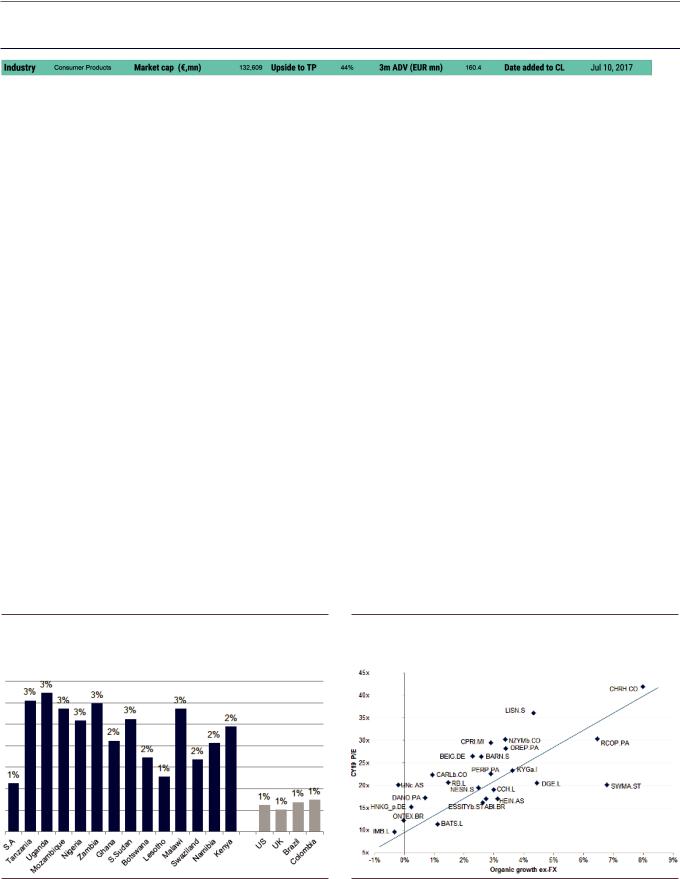
Key drivers of current growth: With 60% of sales in emerging markets, ABI should be able to deliver organic sales growth that is consistently higher than the sector. ABI sees Africa as a material long-term growth opportunity driven by population growth, low current beer PCC and in some markets scope for share gain while also discussing the company’s Category Expansion Framework. We recognise that this EM exposure brings with it increased FX volatility which combined with multiple contraction has driven recent underperformance.
What’s it worth? Our 12m price target of €97 is based on a DCF methodology (assuming a 7.1% WACC and 2% terminal growth), implying a P/E of 17.1x on our CY20 forecasts. ABI trades at a c.26% discount to European Staples on 2019E P/E despite offering above-sector-average EBITDA and EPS growth and better FCF conversion.
Exhibit 58: Population growth should support beer volume growth |
Exhibit 59: ABI screens as one of the cheapest stock in our |
Estimated population growth FY17-22 |
coverage vs. its expected organic growth ex-FX |
|
ECY19 P/E vs. organic growth ex-FX FY20-22 scatter |
Source: Euromonitor |
Source: Company data, Goldman Sachs Global Investment Research |
28 November 2018 |
36 |
vk.com/id446425943
Goldman Sachs
JUST EAT (JE.L): A double order of growth
GS Analyst
Rob Joyce
+44(20)7051-1089
rob.joyce@gs.com
JE is trading on 3.6x 2019E EV/Sales vs Takeaway.com on 7.0x and Delivery Hero 5.7x
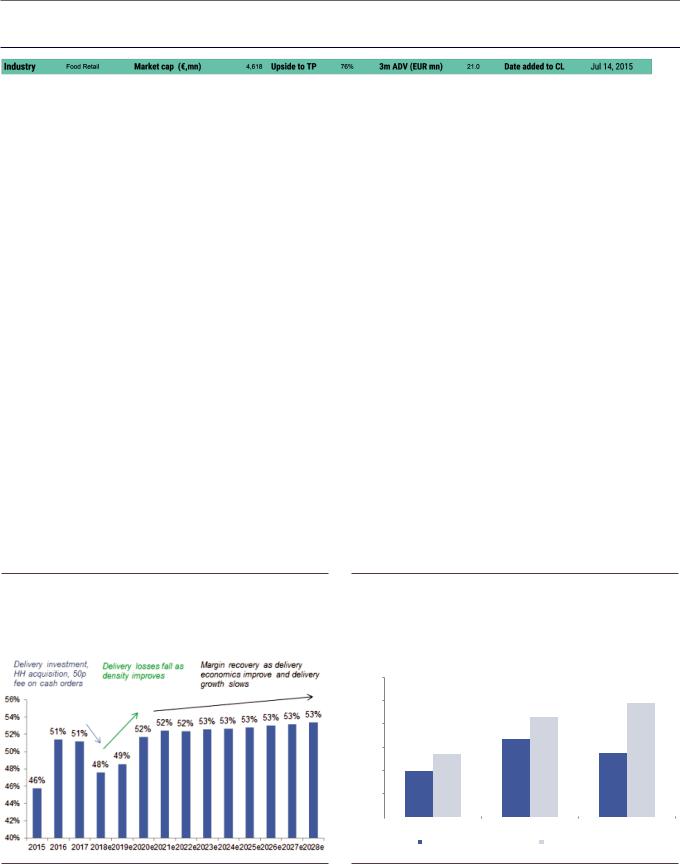
Investment thesis: Just Eat is a leading online takeaway aggregator, with a network of >93,000 restaurants and c.24 mn customers in 13 markets. We see this as a ‘winner takes most’ industry structure, where network effects drive a virtuous circle of increasing restaurants, customers and data. Recent investments in delivery have weighed on the shares, but we see Just Eat’s decision to invest in delivery as the correct one and ultimately believe delivery will constitute only single digit % of orders in the UK, leaving our forecasts for long-run UK EBITDA margins above 50%.
UK Delivery - a key debate: While our base case is for delivery losses of £10-20mn p.a. at the EBITDA level from 2020-28E, we consider the investment into delivery necessary to deepen the moat around Just Eat’s business and ensure it fully captures the highly profitable marketplace opportunity (marketplace EBITDA drop-through margin of 74% in 2017). We forecast delivery reaching only 5% of UK orders by 2023 and UK EBITDA margins returning to >50% (48% in 2018).
Compelling valuation: We continue to believe that the market undervalues Just Eat’s highly profitable core UK marketplace and International businesses. When separately valuing JE’s stake in its JV iFood, the leading online takeaway marketplace in Brazil (which we value at c.£750mn), Just Eat is trading on 3.7x 2019 EV/sales vs. Delivery Hero at 4.9x, GrubHub 5.4x and Takeaway.com 6.3x for similar levels of top-line growth vs. European peers.
What’s it worth? Our 12-month price target of £10.6 is based 85% on our DCF valuation (£9.8/sh) and 15% on an M&A valuation (£15.1/sh) based on 13.2x NTM sales (using the Q1/Q2 average of recent industry transactions).
Exhibit 60: Although we forecast delivery continuing to be loss-making, margins improve with scale and despite a fall in margins in FY18E driven by delivery investments, we forecast UK margins returning to >50% by 2020, driven by UK marketplace
Just Eat UK total EBITDA margin
Exhibit 61: Just Eat trades at a discount to peers on both EV/sales and EV/gross profit despite similar levels of top-line growth
2019E EV/sales, 2019E EV/gross profit (based on GS estimates)
12.0x
9.8x
10.0x
|
|
8.5x |
|
|
8.0x |
|
6.6x |
|
|
|
|
|
||
6.0x |
5.3x |
|
5.5x |
|
4.0x |
3.9x |
|
|
|
|
|
|
||
2.0x |
|
|
|
|
0.0x |
|
|
|
|
JUST EAT |
Takeaway.com |
Delivery Hero |
||
|
||||
|
2019e EV/Sales |
2019e EV/Gross profit |
||
Source: Company data, Goldman Sachs Global Investment Research |
Source: Goldman Sachs Global Investment Research |
28 November 2018 |
37 |
vk.com/id446425943
Goldman Sachs
Kering (PRTP.PA): Bags of Value
GS Analyst
Louise Singlehurst
+44 20 7051-4068
louise.singlehurst@gs.com
We forecast 39.5% EBIT margin by 2020
Gucci’s CEO Mr. Marco Bizzarri has highlighted plans to convert key e-tailers to ‘virtual concessions’, mirroring our E-concessions framework
Despite a tough comparable base, Gucci saw growth of 35% cFX compared to consensus of 28% (GSE +26%) in 3Q18.
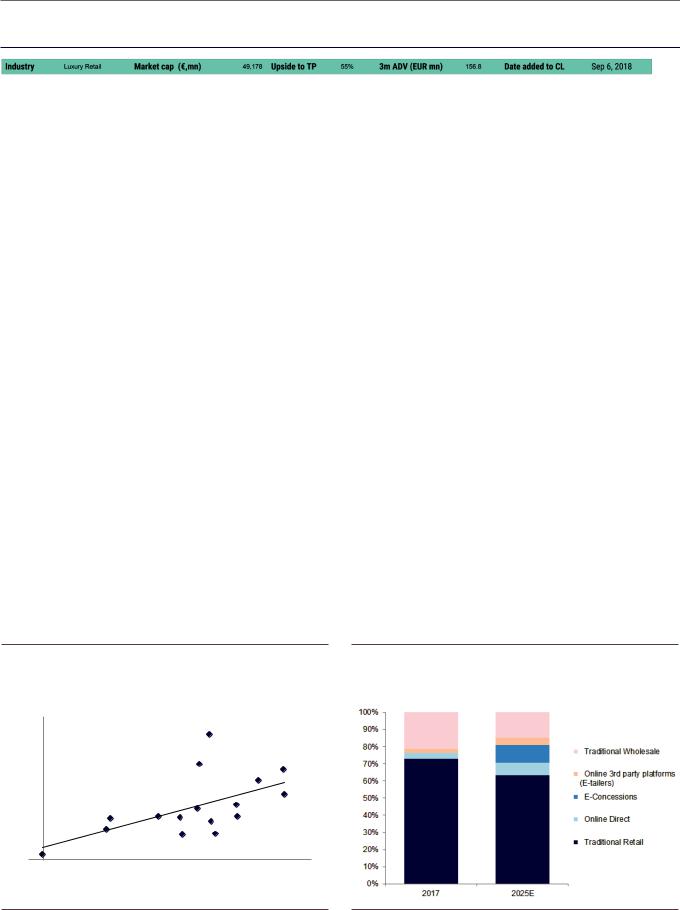
Investment thesis: While we expect industry growth to moderate in 2H18, Gucci brand outperformance is set to continue in our view and can drive a +12% group EPS CAGR in 2019-22E. We see strong brand momentum, with new distribution initiatives (including E-Concessions) driving >30% growth in online sales over the next four years. While we expect offline sales growth to decelerate from 31% in 2018 to 7.5% pa on average to 2022, we think the market underestimates support from digital.
An excellent entry point to a high-quality growth story: While we expect industry growth to moderate in 2H18, Gucci brand outperformance is set to continue, in our view, and can drive a +12% EPS CAGR in 2019-22E. At 13.7x 2020E P/E (vs. peers’ 19x) this presents an attractive opportunity. We see much support from online over the forecast period, with Kering ranking highly on our E-concession theme. Ultimately, we believe this can help to drive Gucci brand margins towards the brand’s long-term 40% EBIT margin objective.
E-concessions: E-Concessions is our term for a new distribution channel we see emerging for the luxury peers, which represents retail structural agreements with third-party online marketplaces and multi-brand platforms. Interestingly, at Gucci, while millennials account for c.56% total sales, its online sales contribution from its own brand.com channel was just 5% in 2017: we forecast this growing to nearer 6% in 2018. We forecast 39.5% EBIT margin by 2020.
Gucci brand strength underestimated: For Gucci, we see sales from E-Concessions capable of delivering a margin of c.45%. We believe the strong growth at Gucci has also enabled a significant amount of reinvestment back into the brand (€497 mn in 2018 on our estimates).
What’s it worth? We use a DCF-based price target methodology and cross reference using peer group multiples and a SOTP analysis. Our 12-month price target is €605.
Exhibit 62: Kering’s discount to its peers looks unmerited given the superior forecast profit profile the company now offers...
EBIT growth vs. multiples
|
31.0 |
|
|
|
|
|
|
|
|
|
Brunello Cucinelli |
|
|
(trading) |
26.0 |
|
|
|
|
|
|
|
|
HermŁs |
Ferragamo |
||
21.0 |
|
|
|
Prada |
||
EV/EBIT |
|
|
|
|
||
16.0 |
Hugo Boss |
LVMH |
Burberry |
Tiffany |
Moncler |
|
C2018 |
|
|
|
Kering |
|
|
|
|
|
|
|
||
11.0 |
|
Tod’s |
Richemont |
|
||
|
Ralph Lauren |
|
|
|
|
|
|
|
Swatch |
Tapestry |
|
|
|
|
|
Pandora |
|
|
||
|
6.0 |
|
|
|
|
|
|
|
|
|
|
|
|
|
-1% |
4% |
9% |
|
14% |
19% |
|
|
EBIT growth C2018-20E |
|
|
||
Exhibit 63: ...which should be helped by the margin accretive E-concessions channel
Channel split for Gucci Group, 2017 vs. 2025E
Source: Company data, Goldman Sachs Global Investment Research |
Source: Company data, Goldman Sachs Global Investment Research |
28 November 2018 |
38 |
vk.com/id446425943
Goldman Sachs
Novo Nordisk (NOVOb.CO): Embarking on a new compounding cycle
GS Analyst
Keyur Parekh
+44(20)7774-1383
keyur.parekh @gs.com
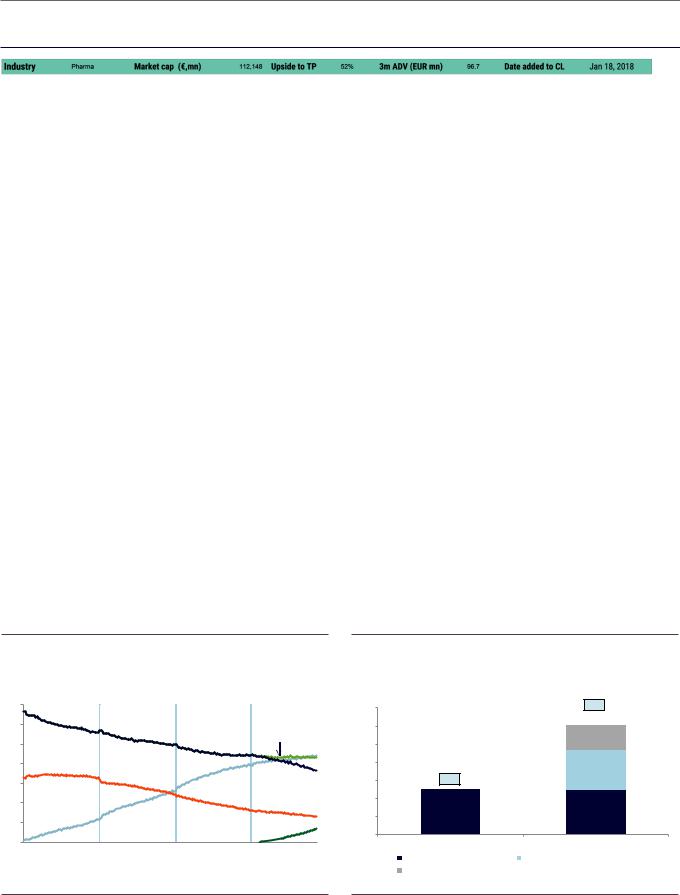
We forecast 44% of 2023 revenue to be driven by GLP-1 products.
We forecast a 2018-23 revenue CAGR of c.7% for Novo vs. our coverage at 4%
Investment thesis: After a relatively slow growth period, we see Novo embarking on a new period of high compounding revenue/EPS growth post 2018 driven by its GLP-1 franchise. While we acknowledge concerns around GLP-1 pricing and potential competition from LLY’s GLP1-GIP product (in clinical development), we do not see any near-term shift in the structure of this high growth market which could catalyse a significant price reduction. Overall we expect Novo’s GLP-1 franchise to re-position it onto a compounding earnings cycle.
From a dominant insulin player to the market leader in an expanding GLP-1
market: Novo’s sales grew at a CAGR of 11% over 2005-15, making it a dominant player in the global insulin market. While its product mix has been evolving since the 2010 launch of its GLP-1 (Glucagon-like peptide-1) product, we believe Novo has only scratched the surface in terms of realising the potential of the GLP-1 class. We believe the recent launch of Ozempic, and, more importantly, oral semaglutide (expected in 2020) will drive most of the growth over the next 5-6 years, transitioning Novo from a dominant insulin player to a dominant GLP-1 player.
Oral sema’s strong PIONEER studies gaining momentum: We believe that oral sema’s impressive data in this year’s PIONEER trials supports our above-consensus (company-compiled) revenue estimate for oral sema ($5 bn in 2023). In particular, we believe that the superior (and consistent) blood glucose reduction (HbA1c) and weight loss seen in patients in the PIONEER trials potentially establishes the drug as the superior oral anti-diabetic treatment.
What’s it worth? Our 12m price target of Dkr450 is based on 22x 2020E EPS, discounted back by a year (WACC of 7.5%, in line with our coverage). We believe Novo’s higher-than-peer group growth outlook post 2018 warrants a significant premium to its peer group.
Exhibit 64: Ozempic’s launch has helped Novo increase its GLP-1 |
Exhibit 65: Oral sema significantly expands Novo’s addressable |
market share modestly |
market |
TRx share in the GLP-1 market |
Volume share in the US diabetes market, 2017 |
0.7 |
|
|
|
|
|
|
|
|
|
|
|
|
|
|
|
|
|
|
|
|
|
|
|
70% |
|
61% |
0.6 |
|
|
|
|
|
|
|
|
|
|
|
|
|
|
|
|
|
|
|
|
|
Novo's |
|
60% |
|
|
0.5 |
|
|
|
|
|
|
|
|
|
|
|
|
|
|
|
|
|
Victoza |
|
|
|
franchise |
|
50% |
|
14% |
|
|
|
|
|
|
|
|
|
|
|
|
|
|
|
|
|
|
|
|
|
|
|
|
|||
0.4 |
|
|
|
|
|
|
|
|
|
|
|
|
|
|
|
|
|
|
|
|
|
|
|
40% |
|
22% |
|
|
|
|
|
|
|
|
|
|
|
|
|
|
|
|
|
|
Trulicity |
|
|
|
|
|
30% |
25% |
|
0.3 |
|
|
|
|
|
|
|
|
|
|
|
|
|
|
|
|
|
|
|
|
|
|
|
|||
|
|
|
|
|
|
|
|
|
|
|
|
|
|
|
|
|
|
|
|
|
|
|
|
|
|
|
0.2 |
|
|
|
|
|
|
|
|
|
|
|
|
|
|
|
|
|
|
|
|
Other GLP-1s |
|
20% |
|
|
|
|
|
|
|
|
|
|
|
|
|
|
|
|
|
|
|
|
|
|
|
|
|
25% |
25% |
|||
|
|
|
|
|
|
|
|
|
|
|
|
|
|
|
|
|
|
|
|
|
|
|
|
10% |
||
0.1 |
|
|
|
|
|
|
|
|
|
|
|
|
|
|
|
|
|
|
|
|
|
|
|
|
|
|
|
|
|
|
|
|
|
|
|
|
|
|
|
|
|
|
|
|
|
|
|
Ozempic |
|
|
|
||
|
|
|
|
|
|
|
|
|
|
|
|
|
|
|
|
|
|
|
|
|
|
0% |
|
|
||
0 |
|
|
|
|
|
|
|
|
|
|
|
|
|
|
|
|
|
|
|
|
|
|
|
Pre oral sema |
Post oral sema |
|
20/02/15 |
10/04/15 |
29/05/15 |
17/07/15 |
04/09/15 |
23/10/15 |
11/12/15 |
29/01/16 |
18/03/16 |
06/05/16 |
24/06/16 |
12/08/16 |
30/09/16 |
18/11/16 |
06/01/17 |
24/02/17 |
14/04/17 |
02/06/17 21/07/17 08/09/17 |
27/10/17 |
15/12/17 |
02/02/18 |
23/03/18 11/05/18 29/06/18 17/08/18 |
05/10/18 |
|
|||
02/01/15 |
|
Branded orals (DPP-4s, SGLT-2s) |
Generic orals (excluding Metformin) |
|||||||||||||||||||||||
|
|
|
|
|
|
|
|
|
|
|
|
|
|
|
|
|
|
|
|
|
|
|
|
|
Injectables (insulin, GLP-1) |
|
Source: IQVIA |
Source: Company data, Goldman Sachs Global Investment Research |
28 November 2018 |
39 |
vk.com/id446425943
Goldman Sachs
Novartis (NOVN.S): Firing on all cylinders
GS Analyst
Keyur Parekh
+44(20)7774-1383
keyur.parekh @gs.com
We ultimately see a more focused company with higher returns and growth, meriting a premium valuation to large-cap EU pharma.
Investment Thesis: We see Novartis entering a period of sustained top-line growth, driven by a reinvigorated pharma business. This improved outlook is driven both by recently launched products and a more bullish outlook for several late-stage pipeline assets. With 80% of incremental pharma revenues through 2018-22E likely to be sourced from high-margin specialty products, we believe the pharma business’ margin profile will benefit disproportionately. More holistically, we see Novartis executing on other fronts (corporate structure) and pulling other levers (capital allocation, M&A) to lift TSR, including Alcon’s planned spin-off.
A more positive outlook for the pharma business: Our deep dive into Novartis’ pharma pipeline (AVXS-101, RTH258, Aimovig), the recently launched products and potential for greater stability of the base business make us more constructive on the growth outlook for this business. We forecast that 80% of Novartis’ incremental pharma revenues will be sourced from specialty medications like Cosentyx and AVXS-101 – which are likely to have margin contributions ahead of the base pharma business. We forecast Novartis’ pharma margins to grow from 32.8% in 2018 to 37.0% in 2022, putting our 2022 margin assumptions c.200bp ahead of company-compiled consensus.
Using other levers to improve shareholder returns: Novartis is also using other levers (corporate simplification, capital allocation) to enhance the longer-term growth outlook and, more meaningfully, its return profile. The announced spin off of Alcon (1H19E completion) creates some room for incremental bolt-on transactions to supplement pharma growth.
What’s it worth? We value Novartis on a SOTP basis and assign a target EV/EBITDA multiple to each of the divisions (and valuing the Roche minority stake at market value). We then apply a 5% conglomerate discount to derive to our 12m price target of SFr110.
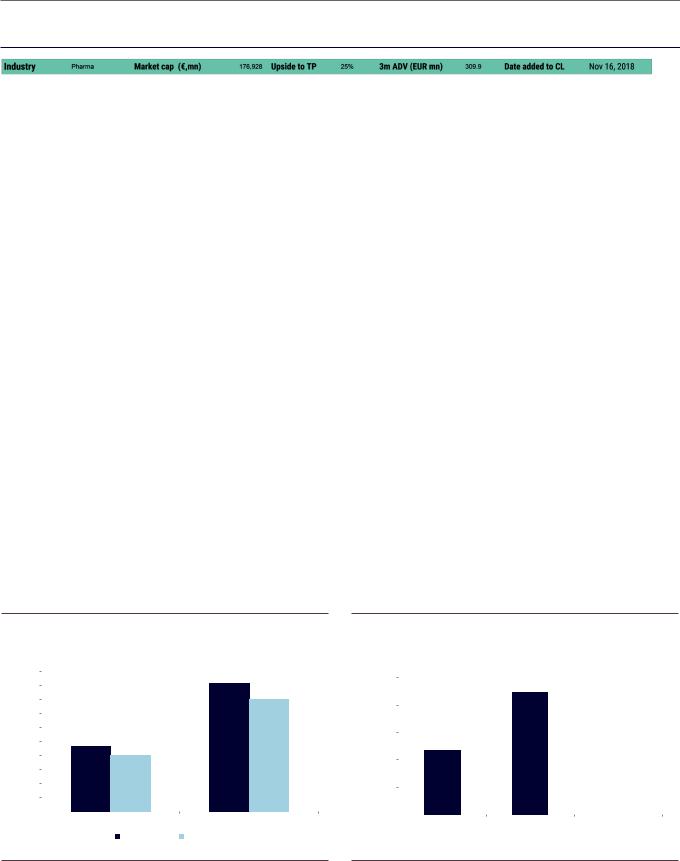
Exhibit 66: We forecast a superior earnings growth outlook for
Novartis relative to its peer group...
|
10% |
|
|
|
9% |
|
|
|
|||
|
9% |
|
|
|
8% |
|
8% |
|
|
|
|
|
|
|
|
|
|
(%) |
7% |
|
|
|
|
6% |
|
|
|
|
|
CAGR |
|
|
5% |
|
|
5% |
|
|
|
||
-22 |
4% |
|
|
4% |
|
|
|
|
|
||
'18 |
|
|
|
|
|
3% |
|
|
|
|
|
|
|
|
|
|
|
|
2% |
|
|
|
|
|
1% |
|
|
|
|
|
0% |
|
|
|
|
|
|
|
Pharma Revenues |
EPS |
|
|
|
|
|
||
|
|
|
|
Novartis (current) |
EU Pharma |
Exhibit 67: …and see scope for higher returns post corporate simplification measures
|
25% |
|
|
|
22% |
|
|
|
|
|
|
|
|||
|
|
|
|
|
|
|
|
|
20% |
|
|
|
|
|
|
CROCI |
15% |
|
|
12% |
|
15% |
|
|
|
|
|
|
|||
2018 |
|
|
|
|
|
|
|
10% |
|
|
|
|
|
|
|
|
5% |
|
|
|
|
|
|
|
0% |
|
|
|
|
|
|
|
|
|
Novartis (current) |
Novartis (ex Alcon) |
EU Pharma |
|
|
|
|
|
|
|
Source: Goldman Sachs Global Investment Research |
Source: Goldman Sachs Global Investment Research |
28 November 2018 |
40 |