

GS_The_European_Conviction_List_watermark
.pdfvk.com/id446425943
Goldman Sachs
Philips (PHG.AS): In improving health
GS Analyst
Veronika Dubajova
+44(20)7774-1901
veronika.dubajova
@gs.com
Philips has been delivering consistent margin improvement for 11 quarters in a row; we see scope for further improvements
Our 2020E adjusted EBITA margin sits 40bp ahead of consensus
Investment thesis: In recent years, Philips has successfully transitioned from a diversified industrial conglomerate to a more focused healthcare and consumer business, with revenues from healthcare increasing from less than 10% of group sales in 2000 to >65% today. From here, we see scope for significant margin improvement via self-help measures, leading Philips to deliver the highest EPS CAGR in our EU MedTech coverage out to 2022E. We also expect a reduction in leverage and higher profitability to support a >100% increase in FCF over the forecast horizon (to 2022E).
November CMD confirmed margins on track: Philips continues to target 100bp of adjusted EBITA margin improvement pa until 2020. Specifically, the company is now targeting cumulative savings of >€1.8bn by 2020 vs. €1.2bn by 2019 previously, with procurement savings, manufacturing footprint reduction, and overhead cost reduction the key sources of efficiencies. We see the increase to the savings target as incrementally positive; we forecast 2020E EBITA margins of 15.2% vs. company-compiled consensus of 14.8%.
FCF to more than double: As management focus switches from portfolio streamlining to operational performance, we expect FCF to increase by more than 100% by 2020E, as improving profitability is supplemented by a reduction in leverage and modestly declining capex intensity. Philips expects to generate >€1.5bn FCF by 2020 (GSe €1.9bn).
What’s it worth? We expect Philips to deliver the highest EPS CAGR within our EU MedTech coverage (18% CAGR 2018-22E vs. EU Medtech at 10.5%), yet the stock currently trades at one of the lowest EV/EBITDA multiples of the group: 9.8x vs. 13.5x for EU MedTech (2019E). Our 12-month price target of €42 values Philips at 11.5x 2019E EV/EBITDA.
Exhibit 68: Philips generates the lowest margins within its |
Exhibit 69: … driving a >100% increase in FCF |
healthcare peer group; we forecast a 360 bp margin uplift until |
Philips FCF (€, mn), cash conversion (2015-22E) |
|
|
|
||||||||||||||||||
2022E… |
|
|
|
|
|
|
|
|
|
|
|
|
|
|
|
|
|
|
|
|
|
|
Philips EBIT margin vs. peers, FY17 |
|
|
|
|
|
|
|
|
|
|
|
|
|
|
|
|
|
|||||
|
|
|
|
|
|
|
|
|
|
|
|
|
3,000 |
|
|
|
|
|
|
|
95% |
|
|
35% |
|
|
|
|
|
|
|
|
|
|
|
|
|
|
|
|
94% |
94% |
96% |
100% |
|
|
|
30.7% |
|
|
|
|
|
|
|
|
|
2,500 |
|
|
|
|
2,382 |
|||||
|
30% |
|
|
|
|
|
|
|
|
|
|
|
|
78% |
|
|
|
2,159 |
||||
|
|
|
|
|
|
|
|
|
|
|
andFCFPhilipsCash conversion (2015-2022E) |
|
|
|
67% |
|
|
|
|
|||
FY17EBIT margin |
|
Philips |
Hologic |
MedSurgStryker |
Healthineers |
RomHill |
Varian |
Elekta |
|
|
peer average. |
|
-73% |
2016 |
2017 |
2019E |
2020E |
2021E |
2022E |
|
||
|
|
|
|
2018E |
|
|||||||||||||||||
|
25% |
|
|
22.0% |
|
|
|
|
|
|
|
|
2,000 |
|
64% |
|
|
|
1,911 |
|
|
|
|
20% |
|
|
|
16.7% |
|
|
|
|
|
|
|
|
|
|
|
|
1,662 |
|
|
|
50% |
|
|
|
|
|
16.6% |
15.9% |
14.2% |
|
|
|
1,500 |
|
|
|
|
|
|
|
|
|
||
|
15% |
10.6% |
|
|
|
|
|
|
|
13.2% |
10.9% |
|
|
|
|
1,011 |
951 |
|
|
|
|
|
|
10% |
|
|
|
|
|
|
|
|
|
|
|
1,000 |
|
642 |
|
|
|
|
|
|
0% |
|
5% |
|
|
|
|
|
|
|
|
|
|
|
|
|
|
|
|
|
|
|
||
|
|
|
|
|
|
|
|
|
|
|
|
500 |
|
|
|
|
|
|
|
|
|
|
|
0% |
|
|
|
|
|
|
|
|
|
|
|
|
|
|
|
|
|
|
|
|
|
|
|
|
|
|
|
|
|
|
GEHC |
Getinge |
|
|
2015 |
|
|
|
|
|
|
|
|
|
|
|
|
|
|
|
|
|
|
|
|
0 |
|
|
|
|
|
|
|
-50% |
|||
|
|
|
|
|
|
|
|
|
|
|
|
|
|
|
|
|
|
|
|
|
||
|
|
|
|
|
|
|
|
|
|
|
|
|
|
|
|
|
|
|
|
|
|
|
|
|
|
|
|
|
|
|
|
|
|
|
|
-500 |
-375 |
|
|
|
|
|
|
|
|
|
|
|
|
|
|
|
|
|
|
|
|
|
|
|
|
|
|
|
|
|
|
|
|
|
|
|
|
|
|
|
|
The dotted line represents the |
|
|
|
|
|
|
|
|
|
|
|
||
|
|
|
|
|
|
|
|
|
|
|
|
|
-1,000 |
|
Free Cash Flow (LHS) |
Cash conversion (RHS) |
-100% |
|||||
Source: Company data, Goldman Sachs Global Investment Research |
Source: Company data, Goldman Sachs Global Investment Research |
28 November 2018 |
41 |
vk.com/id446425943
Goldman Sachs
AEDAS Homes (AEDAS.MC): Quality exposure to Spanish housing
GS Analyst
Alex Fries
+44(20)7552-5797
alex.fries@gs.com
See our recent deep dive for more: ‘Spain Home Builders: Higher costs offset by stronger demand’ (October 19)
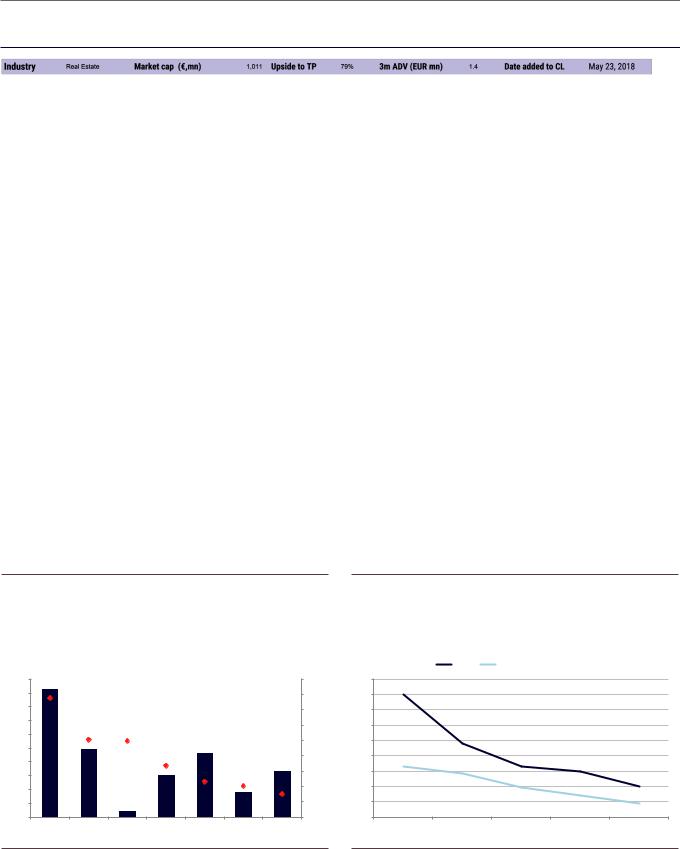
Investment thesis: Aedas is a pure-play Spanish homebuilder with a high-quality land bank, exposed to high-growth regions such as Madrid and Barcelona. With house price appreciation outpacing construction cost inflation, we forecast growing margins for Aedas. Spanish macro data also supports demand, with GDP growth ahead of other major European economies, and rising employment. We also view management targets for deliveries as conservative, having announced at 3Q results that they are ahead of schedule on some sites, implying upside risk to forecasts.
Significant operational progress, ramp-up on track: At 3Q results, Aedas reported that they had delivered more homes than we had forecast, and stated that there is upside risk to full year company targets. We take this as further evidence that Aedas is executing on its ramp-up plan; this is particularly important in the context of Aedas’ two closest peers cutting their delivery targets earlier in 2018.
Pricing power is strong, margins are growing: Construction cost inflation has been higher than anticipated by any of the national listed home builders, causing investors to question the sustainability of margins. These cost increases have been mitigated by Aedas’ high-quality land portfolio that is concentrated in a small number of provinces in Spain where house price growth is in excess of the National average. Consequently, Aedas recently reported gross margins 300bp ahead of company targets, and we view margins as sustainable.
What’s it worth? Our 12m DCF-based price target is €37.7, which implies c.80% upside. Aedas is currently trading at a 30% discount to its last reported Net Asset Value, and at 5.9x 2020E EV/EBITDA – levels that we view as attractive.
Exhibit 70: AEDAS has a concentrated land bank in regions of high price growth such as Madrid...
Portfolio exposure by region (units) and corresponding house price appreciation (%)
Exhibit 71: ...enabling pricing power to outstrip cost inflation in every year of our forecast period, and causing margins to expand
House price appreciation and cost inflation, yoy growth %
 Units
Units  YoY Growth, 1H18
5,000
4,500
4,000
3,500
3,000
2,500
2,000
1,500
1,000
500
0
Madrid Malaga Balearics Alicante Catalonia Valencia Seville
|
|
|
HPA |
Weighted average cost inflation |
|
|
18% |
9% |
|
|
|
|
|
16% |
8% |
|
|
|
|
|
14% |
7% |
|
|
|
|
|
12% |
6% |
|
|
|
|
|
10% |
5% |
MarginExpansion |
|
|
|
|
8% |
4% |
|
|
|
||
|
|
|
|
|
||
6% |
3% |
|
|
|
|
|
4% |
2% |
|
|
|
|
|
2% |
1% |
|
|
|
|
|
0% |
0% |
2018E |
2019E |
2020E |
2021E |
2022E |
|
|
|||||
Source: Tinsa , Company data, Goldman Sachs Global Investment Research |
Source: Company data, Goldman Sachs Global Investment Research |
28 November 2018 |
42 |
vk.com/id446425943
Goldman Sachs
Aviva (AV.L) : Balance sheet focus could pay dividends
GS Analyst
Johnny Vo
+44 20 7552-5785
johnny.vo@gs.com
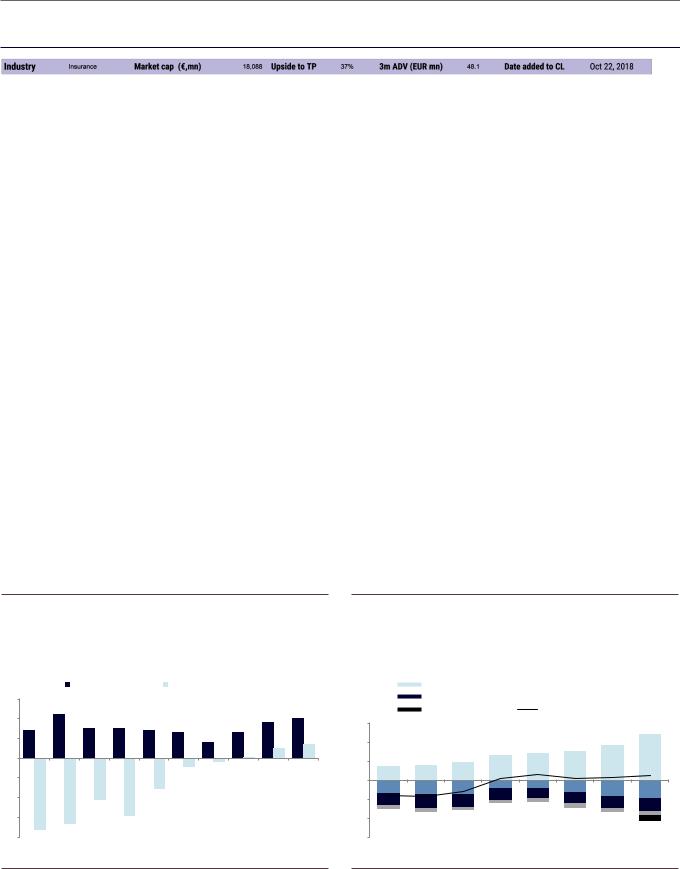
Investment thesis: Despite robust earnings and dividend progression, Aviva has been unable to sustain a valuation re-rating. We believe this has been a function of the group’s relatively weak balance sheet, as typified by its high leverage ratio. An increased focus on growing central liquidity and reducing debt leverage (over growing capital returns) would enable the group to achieve a more sustainable re-rating, in our view. Aviva also has the option of optimising its MA-eligible annuity back-book. While this would not result in an immediate increase in economic value, it could increase the group’s solvency capital and support subsidiary remittances overtime.
Focus on re-building balance sheet strength: We believe that growing capital generation in the UK annuity business will be a key determinant of the group’s ability to fund remittances. In aggregate, we find that Aviva’s dividend coverage from a capital generation perspective is reasonable at c.1.4x (2019E), indicating excess capital can be retained to build balance sheet strength. However, if the group continues to conduct buy-backs, its capital returns coverage based on underlying capital generation is likely to be more limited.
Potential management catalyst: Any potential moves by a new CEO towards building central liquidity and/or de-leveraging could be near-term catalysts. In addition, the group has a number of relatively lowly capitalised entities, at risk of potentially requiring capital injections, that could be further de-risked or sold, in our opinion.
What’s it worth? We view Aviva’s current valuation (c.7.2% 2019E dividend yield) as attractive given its underlying capital generation. We assume an unchanged 10% cost of equity capital and calculate a 9% adjusted return on Unrestricted Tier 1 capital. Our 12-month RoC-based price target is 560p.
Exhibit 72: Historically, Aviva’s ‘unencumbered liquidity’ position has been relatively modest...
Aviva reported central liquidity vs. GS estimated unencumbered liquidity (£bn)
Reported central liquidity |
Unencumbered Liquidity (GSe) |
3
2
1
0
-1
-2
-3
-4
2008 |
2009 |
2010 |
2011 |
2012 |
2013 |
2014 |
2015 |
2016 |
2017 |
Exhibit 73: ... however, increasing remittances have enabled Aviva to begin growing central resources
Summary cash-flow statement for Aviva’s holding companies (£bn)
Remittances from subs |
|
External dividend (paid basis) |
|
||
External debt costs |
|
Central costs |
|
||
Share buy-back |
|
Net operational surplus/deficit |
3 |
|
|
|
|
|
|
|
|
2 |
|
|
|
|
|
|
|
|
1 |
|
|
|
|
1.4 |
1.5 |
1.8 |
2.4 |
|
|
0.9 |
1.3 |
|
||||
|
0.7 |
0.8 |
|
|
||||
0 |
|
|
|
|
|
|||
-0.7 |
-0.7 |
-0.8 |
-0.4 |
-0.4 |
-0.6 |
-0.9 |
|
|
|
-1.0 |
|||||||
|
-0.6 |
-0.5 |
||||||
-1 |
-0.7 |
-0.8 |
-0.7 |
-0.6 |
-0.6 |
|
||
|
|
-0.7 |
||||||
|
|
|
|
|
|
|
|
|
-2 |
|
|
|
|
|
|
|
-0.3 |
-3 |
2010 |
2011 |
2012 |
2013 |
2014 |
2015 |
2016 |
2017 |
|
Source: Company data, Goldman Sachs Global Investment Research |
Source: Company data, Goldman Sachs Global Investment Research |
28 November 2018 |
43 |
vk.com/id446425943
Goldman Sachs
AXA (AXAF.PA): Value in restructuring
GS Analyst
Johnny Vo
+44 20 7552-5785
johnny.vo@gs.com
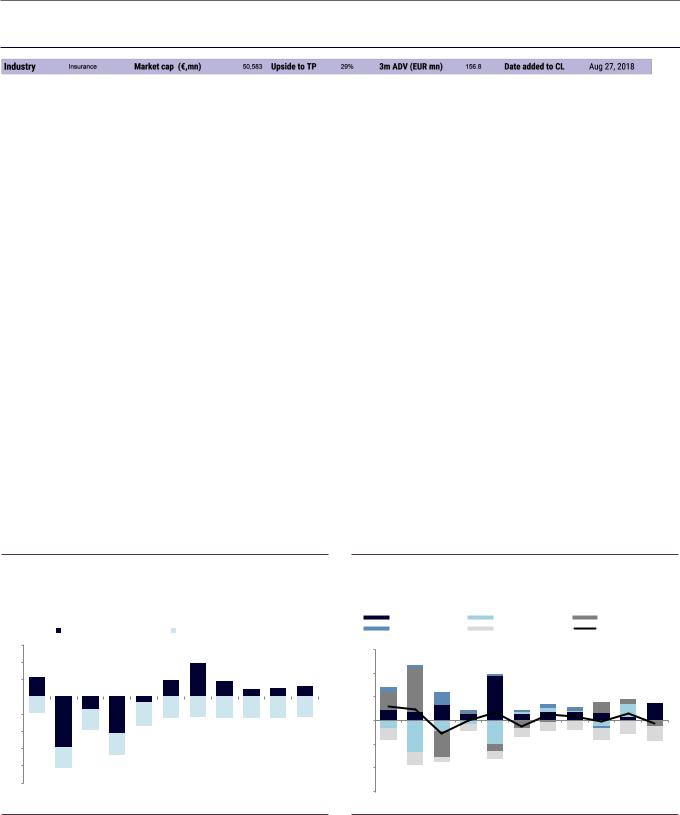
Investment thesis: We are positive on AXA given our incrementally positive view on the group’s balance sheet, from a liquidity perspective, supported by the recent sale of AXA Life Europe and the additional sell-down in AXA Equitable Holdings. While leverage has increased in 2018, we expect the group to quickly de-lever as the up-streaming of excess capital accelerates over the coming years, following divestments (historical and planned) and the acquisition of a more cash-generative P&C business.
Moving to a more cash-generative business profile: While we do not take a view on the strategic/financial rationale of the group’s acquisition of XL, we note that the long-term remittance potential of P&C businesses is significantly in excess of AXA’s pay-out ratio of 45% to 55%. This should enable AXA to de-lever and build excess central liquidity over the coming years.
Potential upside from portfolio trimming: AXA has identified an array of potentially non-core businesses that could also be disposed of, including (newly listed) AXA Equitable Holdings. Additional disposals should further improve the group’s cash position and financial flexibility. However, excluding additional disposals, the potential disposal of AXA Life Europe in addition to the announced restructuring of Switzerland should provide the group with c.€3.3bn of additional cash by the end of 2019. This exceeds the amount of debt raised by AXA SA to finance the acquisition of XL Group.
What’s it worth? We maintain our 12-month price target of €27.0. Our valuation is underpinned by our sector-wide RoC model, assuming a 9.7% cost of capital and an adjusted return of capital.
Exhibit 74: AXA has historically exhibited relatively modest unencumbered liquidity
AXA GS estimated unencumbered liquidity (€, bn)
|
Total Unencumbered Liquidity |
1.5x holding company expense |
|
||||||||
6 |
|
|
|
|
|
|
|
|
|
|
|
4 |
|
|
|
|
|
|
|
|
|
|
|
2 |
|
|
|
|
|
3.9 |
|
|
|
|
|
2.2 |
|
|
|
1.9 |
|
1.8 |
0.9 |
1.0 |
1.2 |
||
0 |
|
|
|
|
|
|
|
||||
|
-1.5 |
|
-0.7 |
|
|
|
|
|
|
||
-1.8 |
|
-2.4 |
-2.3 |
-2.4 |
-2.4 |
-2.4 |
-2.2 |
||||
-4.2 |
-2.6 |
||||||||||
-2 |
|
-2.3 |
|
|
|
|
|
|
|||
-5.8 |
|
|
|
|
|
|
|
|
|||
-4 |
|
|
|
|
|
|
|
|
|
|
|
-6 |
|
|
-2.4 |
|
|
|
|
|
|
|
|
|
|
|
|
|
|
|
|
|
|
||
-2.4
-8
-10
2007 |
2008 |
2009 |
2010 |
2011 |
2012 |
2013 |
2014 |
2015 |
2016 |
2017 |
Exhibit 75: However, the group’s business evolution should improve its cash profile over time
AXA SA summary cash-flow statement (€, bn)
Operating activities |
|
Investing activities |
|
Loan capital |
|
|||||
Equity capital |
|
Dividends |
|
|
Cash result |
|
||||
15 |
|
|
|
|
|
|
|
|
|
|
10 |
|
|
|
|
|
|
|
|
|
|
5 |
|
|
|
|
|
|
|
|
|
|
0 |
|
|
|
|
|
|
|
|
|
|
-5 |
|
|
|
|
|
|
|
|
|
|
-10 |
|
|
|
|
|
|
|
|
|
|
-15 |
|
|
|
|
|
|
|
|
|
|
2007 |
2008 |
2009 |
2010 |
2011 |
2012 |
2013 |
2014 |
2015 |
2016 |
2017 |
Source: Company data, Goldman Sachs Global Investment Research |
Source: Company data, Goldman Sachs Global Investment Research |
28 November 2018 |
44 |
vk.com/id446425943
Goldman Sachs
Banco Sabadell (SABE.MC): Post de-risking, risks to the upside
GS Analyst
Jose Abad
+44(20)7774-1279
jose.abad@gs.com
Our EPS estimates are c.30%/c.9% above I/B/E/S consensus for 2018 and 2019 respectively.
SABE guided for a COR of 45 bp in 2019 (vs. GSe of 56 bp), 40 bp for 2020 (vs. GSe of 48 bp) and indicated the potential for some marginal improvement.
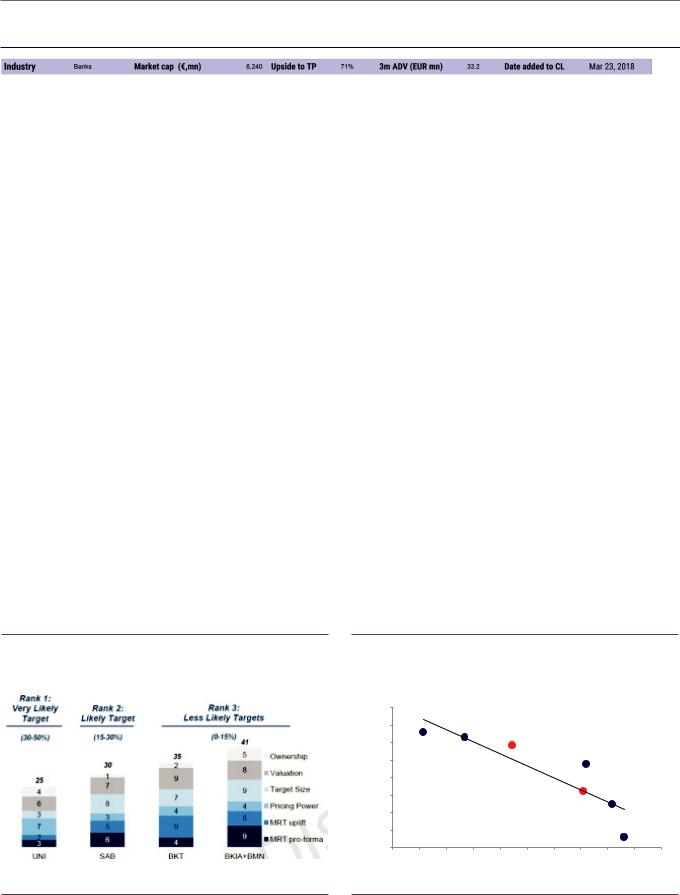
Investment thesis: We added SABE to the Conviction List in March, with an investment thesis predicated on the bank’s potential for (1) provisioning leverage, (2) multiple expansion, and (3) becoming a key beneficiary of expected consolidation in Spain. Eight months on, SAB shares have been impacted (-16% vs. SX7P) by events that we did not foresee and are negative (TSB’s IT migration issues, widening of Italy’s sovereign risk premium) but also by events that we did foresee and are positive (a turnaround in the bank’s risk profile from a large NPE sale).
A laggard of the “real estate” theme: In 2017, we highlighted that Spain’s strong macro dynamics were driving higher prices and transactions across asset classes (homes, land) and regions, with levels already well above post-crisis troughs. We see Banco Sabadell as a laggard in this trend and believe that post heavy reserving over recent years; and given the strength of Spain’s recovery, the bank is now in a good position to beat the guidance provided earlier in the year. During the 3Q results call, the bank (1) announced plans to sell Solvia; and (2) reiterated expected annual impacts of €153mn pre-tax post the closing of the large NPE sale announced in late July, assuming the sale of Solvia (€209mn if Solvia was retained).
Unprecedented de-risking and strong core trends in Spain: Post the bank’s de-risking exercise in 2Q, we view risks around the stock as tilted to the upside. Overall trends in 3Q18 were stronger than consensus expectations at the sector level, with loan and fee income growth being highlights.
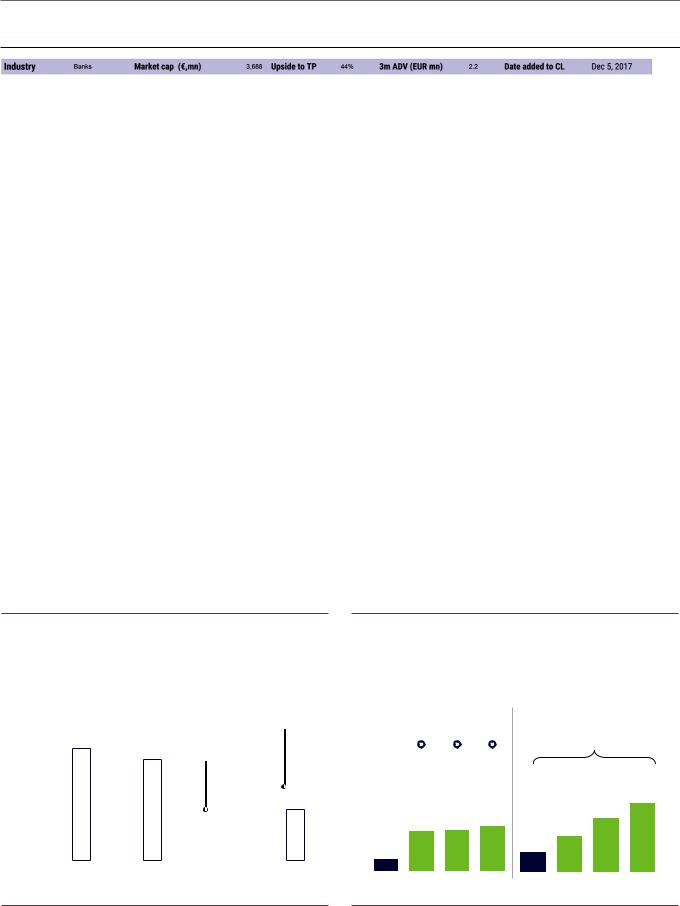
What’s it worth? Our 12m price target of €1.90 is based on an 85% weighting to our core valuation of €1.76/sh (1.18x P/TBV 2019E) and a 15% weighting to our M&A-based valuation of €2.7/sh (1.44x P/TBV 2019E, in line with precedent transactions). We see Banco Sabadell as both a possible target and as a possible consolidator in the still relatively fragmented Spanish banks sector.
Exhibit 76: SABE screens as a likely target in our framework |
Exhibit 77: Post large NPE disposal announced in 2Q18, potential |
M&A (lower value = higher M&A likelihood); (based on 6 |
for significant improvement in the bank’s profitability profile |
equal-weighted metrics |
2019E consensus ROTE; NPE as of 2Q18 or latest available |
|
20% |
|
|
18% |
|
(w/Refi) |
16% |
|
14% |
||
|
||
Ratio |
12% |
|
10% |
||
NPE |
||
8% |
||
|
6%
4%
4%
 LBK
LBK
UNI |
BKIA |
|
|
SAB |
|
|
|
|
|
|
CABK |
|
|
SAB p/f |
|
|
CABK p/f |
y = -1.3795x + 0.2579 |
|
|
|
R† = 0.8312 |
BKT |
|
|
|
5% |
6% |
7% |
8% |
9% |
10% |
11% |
12% |
13% |
14% |
|
|
|
|
ROTE |
|
|
|
|
|
Source: Company data, Goldman Sachs Global Investment Research |
Source: Company data, Goldman Sachs Global Investment Research, Datastream |
28 November 2018 |
45 |
vk.com/id446425943
Goldman Sachs
BAWAG Group (BAWG.VI): High return bank in a low-return market
GS Analyst
Pawel Dziedzic
+44(20)7774-1279
pawel.dziedzic @gs.com
We forecast c.19% ROTE by 2020E
Investment thesis: BAWAG is a high-return bank (>15% capital-adjusted ROE) based in Austria. It has a proven restructuring track record and an ambition to deploy its low-cost business model in Germany and Switzerland via organic growth as well as smaller bolt-on acquisitions. BAWAG aims to sustain the high profitability of its existing operations and targets an extra >€1 bn of capital spend on bolt-on M&A and/or special dividends & buybacks on top of a 50% payout in the medium term.
Restructuring track record drives returns, underpins growth strategy: The group’s operating turnaround in its home market allowed BAWAG to lower its C/I ratio from 70% in 2012 to 46% in 2017, supported by >30% reduction in active FTEs. During 9M18, BAWAG made further progress on network transformation in Austria and delivered on its integration roadmap for Südwestbank & Deutscher Ring Bausparkasse (German banks acquired in 2017). C/I in 3Q18 came in at 43%, consistent with the company target of <46% with the group pointing to integration and optimization of costs for new acquisitions on track and expected to bring full benefit in 2019.
Capital deployment focused on dividends, buybacks & bolt-on M&A: BAWAG aims
to sustain its high profitability and deploy >€2 bn of excess capital via dividends, buybacks and bolt-on deals through 2020 (>50% of existing market cap). While the company continues to see a robust M&A pipeline across the DACH region, the build-up of capital ratios over 2018 is likely to renew debate about the scale and form of capital deployment ahead of 4Q18 results.
What’s it worth? BAWAG trades at 8.7x P/E (2019E) and 1.1x P/TBV (2018 E), broadly on par with the sector (8.9x/1.0x) despite higher profitability, solid capitalization and an ambition to deploy over half of its market cap (>€2 bn) via dividends, buybacks and bolt-on deals through 2020. Our 12-month ROTE/COE target price is €53.
Exhibit 78: Attractive return profile with expected cost efficiencies and restructuring helping to deliver PBT growth
Key financials and mid-term financial targets
120 |
|
|
|
|
|
|
|
Captures furthercost120 |
||
|
|
|
|
|
|
|
|
efficiency measures |
||
|
|
18.4% |
|
|
|
|
|
and deal synergies |
||
100 |
|
|
6.0% |
|
Includes |
|
|
|
100 |
|
15.5% |
Mid-High |
normalisatio |
|
|||||||
Teens |
|
|
n of |
|
|
|
|
|||
|
|
|
|
corporate |
|
|
|
|
||
80 |
|
|
>5.0% |
|
|
|
|
80 |
||
|
|
|
|
|
|
|||||
|
|
|
tax rate |
|
|
|
||||
60 |
|
|
|
|
|
|
|
|
|
60 |
|
|
|
|
|
|
|
46% |
|
|
|
40 |
|
|
|
|
|
|
|
|
40% |
< 40% 40 |
|
|
|
|
|
|
|
||||
20 |
|
|
|
|
|
|
|
|
|
20 |
|
|
|
|
0.7% |
|
|
|
|
|
|
0 |
|
|
|
|
|
|
|
|
|
0 |
|
|
|
|
|
|
|
|
|
||
|
18E 20E Target |
GSe Target |
|
GSe |
|
18E 20E |
Target |
|||
|
|
ROTE |
PBT |
Earnings |
|
|
C/I |
|
||
|
(Adjusted) |
Growth |
Growth |
(ex regulatory charges) |
||||||
Exhibit 79: BAWAG targets 50% dividend payout and deployment of >€1 bn capital above 12% CT1 threshold over the medium term
Split dividends (€ bn) payout ratio (%); CT1>12% level (€ bn)
Dividend and Payout (%) |
CT1 > 12% Target |
||||||
|
|
|
|
|
|
|
|
50% |
50% |
50% |
Supported by planned roll- |
||||
out of IRB models in 2018- |
|||||||
|
|
|
|
|
|
||
|
|
|
|
|
|
20E |
|
 Paid pre-IPO
Paid post-IPO
|
|
|
|
|
|
|
1.2 |
|
|
|
0.23 |
|
|
0.9 |
|
|
0.21 |
0.21 |
|
0.6 |
|
|
|
|
|
|
|
|
|||
|
|
|
|
|
|
|
|
0.11 |
|
|
|
0.3 |
|
|
|
17A |
18E |
19E |
20E |
17A |
18E |
19E |
20E |
Source: JLL , Goldman Sachs Global Investment Research |
Source: Company data |
28 November 2018 |
46 |
vk.com/id446425943
Goldman Sachs
BNP Paribas (BNPP.PA): Increasing dividend credibility
GS Analyst
Jean-Francois Neuez
+44(20)7552-9362
jean-francois.neuez @gs.com
BNP’s solid stress test performance is contributed to by: (1) a higher hurdle rate (due to 150 bp G-SIB add on) as well as (2) starting capital ratios; the test does confirm BNP’s ability to continue to distribute capital.
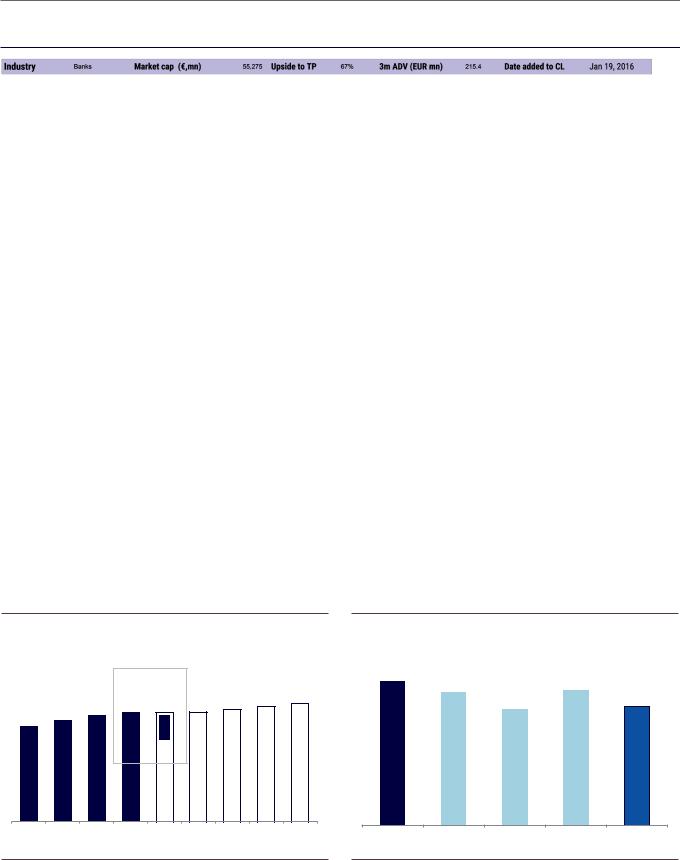
Investment thesis: Our thesis on BNP revolves around dividend credibility. Over our forecast horizon, BNP yields an attractive 8.2% on average, on a payout ratio of just 50%. We believe this discount to the sector on DY stems from the overlay of future regulatory risks on BNP’s tight capital management track record. The combination of broadly stable earnings revisions, increasing regulatory certainty and management action to increase BNP’s capital buffer should underpin share price outperformance we believe. In addition, signs of higher interest rates would suggest upside to our base-case.
Capital and dividends: BNP’s capital buffers are increasing for four reasons: (1) BNP’s returns have been stable for many years; (2) the minimum capital requirements are no longer increasing, and are even falling: BNP’s capital surcharge for being systemically important fell by 50 bp in 2017, and this was confirmed in November 2018. This could fall further if cross border exposures inside the Eurozone are no longer counted, as per the Ecofin proposal. (3) The regulatory landscape has settled, with the completion of Basel 4 last December proving less onerous than initially anticipated. (4) With a complete disposal of SBI Life, we estimate BNP will be in a position to achieve a 12% CET1 by year-end 2018.
Catalyst: BNP will report 4Q2018 on February 6, at which point the bank also plans to update its 2020 targets. With its IT investment programme to be completed earlier than foreseen and for a lower amount, we expect BNP to turn its focus on better operating expense management.
What’s it worth? BNP currently trades on 7.0x 2018E P/E, a 14% discount to French peers and 30% discount to the European banks sector. Our ROE/COE-based valuation framework gives a 12-month price target of €74.
Exhibit 80: BNP’s CET1 progresses steadily...
Basel 3 CET1 ratio, fully loaded
|
|
|
One-off change in |
|
|
|
|
|
|
|
|
accounting standard |
|
|
|
|
|
10.3% |
10.9% |
11.5% |
11.8% |
11.7% |
11.8% |
12.1% |
12.4% |
12.7% |
2014 |
2015 |
2016 |
2017 |
2018E |
2019E |
2020E |
2021E |
2022E |
Exhibit 81: ...Adding credibility to its dividends
Average 2018-22E dividend yield (%) |
|
|
||
8.20% |
|
|
7.70% |
|
|
7.60% |
|
|
|
|
|
6.60% |
|
6.80% |
|
|
|
|
|
BNP Paribas |
Societe Generale |
Credit Agricole |
Natixis |
European Banks |
Source: Company data, Goldman Sachs Global Investment Research |
Source: Goldman Sachs Global Investment Research |
28 November 2018 |
47 |
vk.com/id446425943
Goldman Sachs
ING (INGA.AS): Discount valuation, stable profitability and dividend yield
GS Analyst
Pawel Dziedzic
+44 20 7774-1279
pawel.dziedzic@gs.com
3Q18 headline earnings was a beat with PBT 11%-14% ahead of expectations. Solid cost control with C/I for 3Q falling to 50%
Our DPS forecast implies a stable and robust >6% dividend yield in 2018-20 and we forecast >10% ROTE in 2019-20
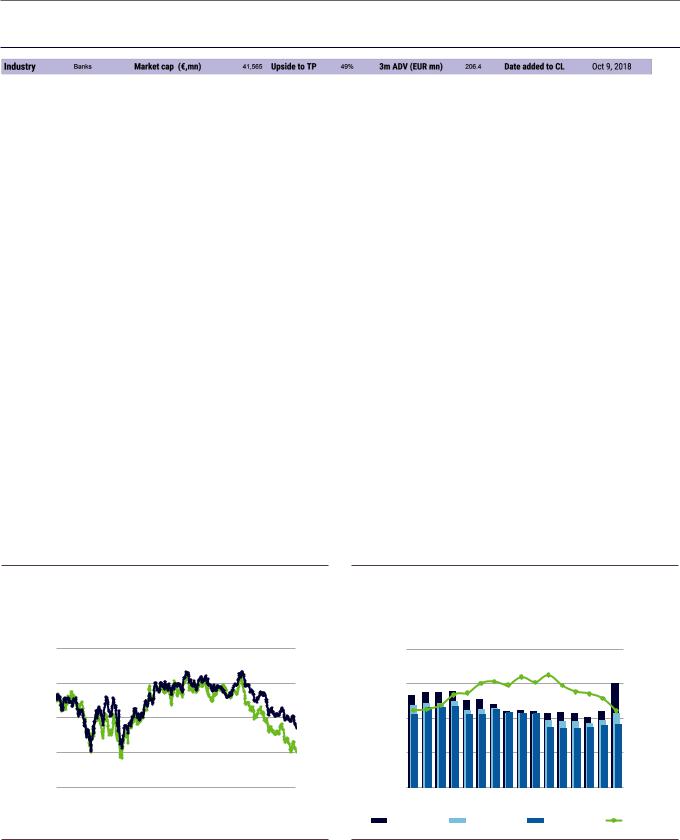
Investment thesis: ING shares have fallen sharply over the first nine months of 2018 with the stock underperforming large cap Italian banks and peers with substantial Turkish (BBVA) and Asian/EM exposures (STAN, HSBC). This has been the weakest sector relative performance for the stock in >7 years. With reset future performance expectations, solid fundamentals and a discount valuation, we remain positive.
Meaningful de-rating…...We attribute the stock’s underperformance this year to a combination of softer PPP trends, a weaker dividend outlook and concerns around Turkey/EMs. The stock’s sell off has left ING’s shares trading below peers’ and historical P/E & ROE/COE multiples. We see this as an attractive entry point.
…but non-recurring drivers: We believe the drivers responsible for the stock’s underperformance are mostly non-recurring and unlikely to put the shares under similar pressure going forward. Exposure to Turkey is well flagged and modest from the group’s consolidated standpoint. The settlement of an AML case with Dutch / US authorities (Sep 18) also removes uncertainty on its capital impact.
Healthy profitability, solid balance sheet: ING is a profitable and well diversified bank, benefiting from a solid capital base (CET at 14%), benign asset quality trends (NPLs <2%), growth in core lending exposures and AAA credit-rated Dutch sovereign.
What’s it worth? The stock trades at 0.86x P/TBV (18E) and 8.0x P/E (19E), a substantial discount to the European peers, despite solid profitability (ROE >10%) and stable dividend yield (>6%). We value the stock on a ROE/COE methodology, resulting in a 12-month price target of €16.00.
Exhibit 82: ING’s stock is down c.30% YTD and has underperformed SX7P by c.15%; it now trades at 8x P/E
Consensus P/E (12 months forward) for ING and European banks
14.0x
forward) |
12.0x |
|
|
||
P / E (12M |
10.0x |
|
8.0x |
||
|
||
|
6.0x |
15-Sep |
16-Mar |
16-Sep |
17-Mar |
17-Sep |
18-Mar |
18-Sep |
|
|
ING |
|
|
Sector |
|
|
|
|
|
|
Exhibit 83: Our DPS forecasts reflect the bank’s progressive growth policy, with higher 2018 payout capturing one-off charges in 2018
Changes in payout ratio for 2018, 2019 and 2020 (GSe) and ING share price
70% |
|
|
|
|
|
|
|
|
20.00 |
60% |
|
|
|
|
|
|
|
|
15.00 |
Payoutratio (%) |
|
|
|
|
|
|
|
|
)€(PriceShare |
50% |
|
|
|
|
|
|
|
|
10.00 |
40% |
|
|
|
|
|
|
|
|
5.00 |
30% |
|
|
|
|
|
|
|
|
0.00 |
16-Sep |
16-Oct |
16-Oct |
17-Jan |
17-Aug 17-Jun 17-Apr 17-Feb |
17-Nov |
17-Nov |
18-May 18-Apr 18-Feb 18-Jan |
18-Jul |
18-Oct |
Payout (18E) |
|
|
Payout (19E) |
|
|
Payout (20E) |
|
Share Price |
|
Source: Datastream, Goldman Sachs Global Investment Research |
Source: Company data, Goldman Sachs Global Investment Research |
28 November 2018 |
48 |
vk.com/id446425943
Goldman Sachs
Kojamo (KOJAMO.HE): Finnish market leader
GS Analyst
Jonathan Kownator
+44 20 7051-2974
jonathan.kownator@gs.co m
Kojamo attributes recent occupancy improvements to the “webstore”, a differentiated online platform allowing tenants to view and rent apartments for next day move ins.
Investment thesis: We believe Kojamo’s valuation is attractive relative to the opportunity provided by its leading position as a Finnish residential landlord, offering exposure to a modern stock of small apartments well-suited to the rental market. We believe the company’s income stream presents a low-risk profile.
Finnish markets positioned for growth: Kojamo operates in supportive underlying markets, likely helped by a recovery in GDP growth in Finland, which started later than in many other European countries. Additionally, we believe Kojamo’s underlying main markets of Helsinki and Tempere will benefit from further urbanisation, with only 29% of Finland’s population living in an urban environment (2014 data vs. 48% OECD average).
A well-placed Finnish residential landlord: We believe Kojamo has an attractive portfolio, due to its focus on relatively modern, smaller and younger market-rent based apartments in larger cities. We expect the group to benefit from rental growth in a residential market that is typically lower risk than commercial markets, and with little of the regulation that applies to landlords in many continental European countries. At the same time, we expect the company to further grow its rental income at attractive returns through an investment program combining both new development and acquisitions, which we forecast at €1.1bn until 2021.
Strong 3Q18: 3Q18 FFO was 10% ahead of our estimates, owing mainly to 15% lower-than-expected property expenses. Like-for-like rental growth improved 10bp from 1H18 to +2.0% and occupancy was up 30bp qoq to 96.8%.
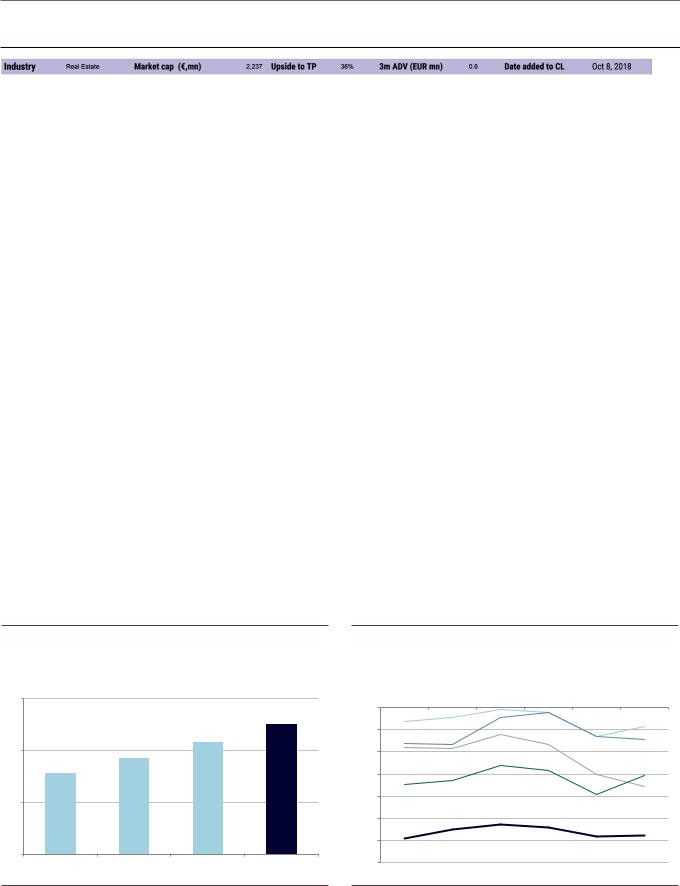
Attractive valuation: At a 25% discount to 2018E NAV and a 6.3% 2019E earnings yield, we believe Kojamo’s valuation is very attractive given the lower-risk profile of residential income. Our 12m price target of €12.3 is based 70% on our fundamental EVA® valuation of €11.5/sh, and 30% on our M&A valuation of €14.2/sh.
Exhibit 84: Kojamo’s rental yields are higher than German |
Exhibit 85: ...and it trades at the greatest discount to NAV |
residential landlords... |
EPRA NAV discounts, 12m fwd rolling basis |
EPRA Net Initial Yields, last reported (%) |
|
6% |
|
|
|
0% |
|
|
|
|
|
|
|
|
|
-5% |
4% |
|
|
|
-10% |
|
|
|
|
-15% |
2% |
|
|
|
-20% |
|
|
|
|
|
|
|
|
|
-25% |
|
|
|
|
-30% |
0% |
|
|
|
|
D. Wohnen |
Vonovia |
LEG |
Kojamo |
-35% |
Jun-18 |
Jul-18 |
Aug-18 |
Sep-18 |
Oct-18 |
Nov-18 |
|
|
|
|
|
D. Wohnen |
|
|
|
|
|
LEG |
|
|
|
|
|
Vonovia |
|
|
|
|
|
Grand City |
|
|
|
|
|
Kojamo |
Source: Company data |
Source: FactSet, Goldman Sachs Global Investment Research |
28 November 2018 |
49 |
vk.com/id446425943
Goldman Sachs
Standard Chartered (STAN.L): Valuation gap presents opportunity
GS Analyst
Martin Leitgeb
+44 20 7552-1406
martin.leitgeb@gs.com
We forecast Standard Chartered to reach an ROTE of 7.7% in 2020 and 8.6% in 2021
Investment thesis: Standard Chartered continues to trade at a meaningful discount to HSBC, a gap which we expect will narrow as Standard’s restructuring progresses. Despite assuming a lower payout ratio, we see longer-term payout potential being comparable to HSBC. We also see Standard Chartered as a key beneficiary of rising US$ rates.
Asset quality and capital improvement: STAN reported (3Q18) underlying PBT 3% above company-compiled consensus. Capital was better than we expected, increasing 30bp qoq to 14.5%, driven by quarterly profits and lower RWAs, with the group disclosing a 10bp reduction in its P2A requirement. Stage 3 loans reduced from $7.7bn in 2Q18 to $7.2bn in 3Q18, with the coverage ratio increasing slightly (57% to 58%).
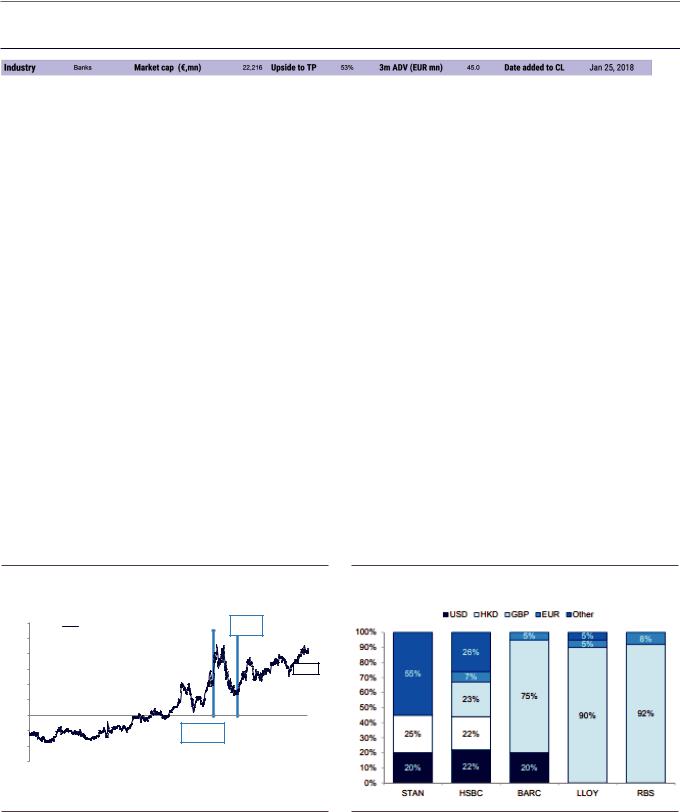
Higher rates: We estimate that rising rates will contribute c.$1 bn of incremental revenues by end 2019, representing an EPS uplift of c.20%. STAN is the most geared of the UK-listed banks to rising US rates given high structural exposure to USD/HKD (c.45% of tangible equity and non-interest bearing deposits on our estimates) and high operational gearing given lower profitability.
Core business franchises performing well: The group expects revenue growth of 5%-7% in the medium term, stemming from both volume growth and select margin expansion. We continue to believe that the outlook for revenue progression will improve as we head further into 2018 and as YoY comparisons will no longer be affected by disposals and derisking.
What’s it worth? Our 12m ROTE/COE-based target price is 920p.
Exhibit 86: HSBC trades on a c.50% premium to STAN
HSBC premium to STAN on 1-year forward P/TBV (trailing prior to 2009)
120% |
|
HSBC premium to STAN on P / TBV |
HSBC |
|
||||
|
|
buyback |
|
|||||
100% |
|
|
|
|
|
|
||
|
|
|
|
|
|
|
|
|
80% |
|
|
|
|
|
|
|
|
60% |
|
|
|
|
|
|
|
c.80% |
40% |
|
|
|
|
|
|
|
|
20% |
|
|
|
|
|
|
|
|
0% |
|
|
|
|
|
|
|
|
(20%) |
|
|
|
|
STAN |
|
|
|
(40%) |
|
|
|
|
rights issue |
|
|
|
|
|
|
|
|
|
|
|
|
(60%) |
|
|
|
|
|
|
|
|
Mar 10 |
Mar 11 |
Mar 12 |
Mar 13 |
Mar 14 |
Mar 15 |
Mar 16 |
Mar 17 |
Mar 18 |
Exhibit 87: STAN has 45% of rate sensitive assets in USD/HKD
Rate sensitive portion of balance sheet by currency
Source: Datastream |
Source: Company data, Goldman Sachs Global Investment Research |
28 November 2018 |
50 |