

2.4 Analysis of key financial performance indicators for performance
Table 5.
Key financial indicators for performance
Indicators |
Fact |
The absolute deviation |
Growth |
||||
2008 |
2009 |
2010 |
2009 |
2010 |
2009 |
2010 |
|
Revenue, incl |
14 015 777 |
18 264 359 |
20 286 704 |
+4 248 582 |
+2 022 345 |
+30,31% |
+11,07% |
Revenues from sales of products and services |
13 032 699 |
17 590 579 |
19 634 939 |
+4 557 880 |
+2 044 360 |
+34,97% |
+11,62% |
Revenue from gas sales |
10 718 821 |
16 361 603 |
17 812 009 |
+5 642 782 |
+1 450 406 |
+52,64% |
+8,86% |
Revenue from transportation of gas |
723 641 |
612 554 |
1 080 385 |
-111 087 |
+467 831 |
-15,35% |
+76,37% |
Revenue from subscription services |
144 816 |
124 093 |
143 893 |
-20 723 |
+19 800 |
-14,31% |
+15,96% |
Revenue from the calibration of gas meters |
3 639 |
1 593 |
397 |
-2 046 |
-1 196 |
-56,22% |
-75,08% |
Revenue from rendering of services |
1 355 599 |
486 735 |
598 255 |
-868 864 |
+111 520 |
-64,09% |
+22,91% |
Revenue from consulting services |
86 183 |
4 000 |
- |
-82 183 |
|
-95,36% |
|
Income from financing |
387 692 |
304 451 |
336 225 |
-83 241 |
+31 774 |
-21,47% |
+10,44% |
Other income |
595 386 |
369 330 |
315 540 |
-226 056 |
-53 790 |
-37,97% |
-14,56% |
Expenses, incl: |
13 135 485 |
17 869 937 |
19 508 320 |
+4 734 452 |
+1 638 383 |
+36,04% |
+9,17% |
Cost price |
10 637 007 |
14 800 057 |
17 256 083 |
+4 163 050 |
+2 456 026 |
+39,14% |
+16,59% |
Prime cost of the realized gas |
8 075 796 |
12 939 638 |
14 935 112 |
+4 863 842 |
+1 995 474 |
+60,23% |
+15,42% |
The cost of gas transportation |
894 422 |
970 061 |
1 289 323 |
+75 639 |
+319 262 |
+8,46% |
+32,91% |
Cost of customer service |
233 560 |
255 820 |
279 457 |
+22 260 |
+23 637 |
+9,53% |
+9,24% |
Cost of checking of devices of the accounting of gas |
21 731 |
14 794 |
10 427 |
-6 937 |
-4 367 |
-31,92% |
-29,52% |
Prime cost of services |
1 411 498 |
619 745 |
741 764 |
-791 753 |
+122 019 |
-56,09% |
+19,69% |
Expenses on realization |
323 |
0,13 |
- |
-323 |
|
-99,96% |
|
General and administrative expenses |
1 615 731 |
1 319 090 |
1 712 119 |
-296 641 |
+393 029 |
-18,36% |
+29,80% |
Expenses on financing |
354 124 |
445 135 |
348 893 |
+91 011 |
-96 242 |
25,70% |
-21,62% |
Other expenses |
528 300 |
1 305 654 |
191 225 |
+777 354 |
-1 114 429 |
+147,14% |
-85,35% |
Total profit |
1 086 049 |
115 163 |
562 549 |
-970 886 |
+447 386 |
-89,40% |
+388,48% |
negative / positive exchange rate difference |
-17293 |
-1044996 |
+56624 |
|
|
|
|
Total revenues of the Company:
In 2009 amounted to 18,264,359 thousand tenge.: in absolute terms in the 4 248 582 thousand tenge more than in 2008 or in the relative importance of an increase of 30.31% from the previous year. In order to identify the area of effect it is necessary to consider separately the income figures for the types of services, ie identify the most effective type of service or product on which you can focus, and the weakest link, which should be improved.
In 2009, revenue from gas sales increased by 5 642 782 thousand tenge or 52.64%, due to the implementation of the project "Reconstruction of the gas in Almaty and Almaty region for the period 2009-2018.", In which provides for implementation of the following activities: construction and installation of hydraulic fracturing and SHRP in areas of new construction, laying of pipelines of high, medium and low pressure to the projected and reconstructed areas.
In 2009 compared to 2008 figure of absolute deviation of income has a negative nature of the services rendered for repair, adjustment and maintenance of the pipeline -973 816 thousand tenge and is 38.76% of the amount of income on these types of services the previous year or - 61.23% less than in the previous year, due to reduced orders from outside organizations.
Thus, the bulk of the increase in income from operations account for proceeds from the sale of natural gas in 2009 (↑ 52.64% for) due to increased sales volumes of natural gas to wholesale and regional consumers;
- The value of the total income in 2010 compared to 2009 increased by 11% or in absolute terms in the 2 022 345 thousand tenge is greater than the previous year.
Based on the data table shows that the growth rates by type of service have a moderate rate of growth in a positive value and do not require their detailed consideration. The only exception is the value of an indicator of income for the transportation of gas, which reflects an increase in income for this type of service on 467 831 thousand tenge or 76.37% the previous year due to increased volumes of gas transportation to 42% as compared to the volume of sales gas in 2009
As thanks to schedules and charts the material becomes more intelligible and clear, values of an indicator of the Cumulative income should be reflected graphically.
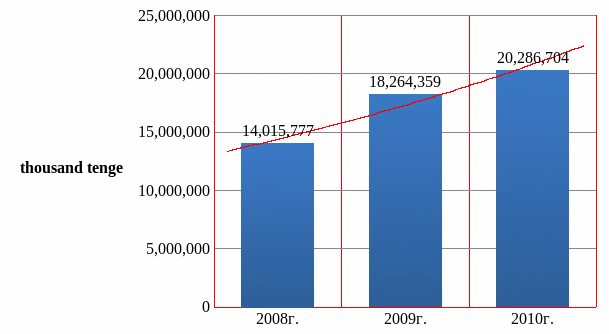
Figure 2. Volume of the cumulative income of the enterprise for 2008-2010.
As seen in Figure 2, the value of the index total income in chronological dimension tends to increase.
The consolidated expense of the Company:
- In 2009 made 17 869 937 thousand tenge.: in absolute value or it is more on +4 734 452 thousand tenge of value of 2008 or in relative measurement rate of a gain made +36 % from value of an indicator of previous year. It is expedient to reveal the abnormal phenomena, i.e. analysis sites sharply different changes in time for what it is necessary to consider items of expenditure separately:
Prime cost of the realized gas increased by +4 863 842 thousand tenges in absolute measurement or for +60,23 % in relative measurement in comparison with an indicator 2008г., in connection with growth of volumes of realization of natural gas by +170 190 thousand m 3 that is more than value of an indicator of Volume of realization of natural gas of 2008 for +18,79 %.
It is connected with that the JSC Kaztransgaz-Almaty enterprise expands the activity at the expense of increase in consumers, increases in number of gas pipelines and objects of gas farms.
Expenses on financing increased by +91 011 thousand tenge or the gain made +25,7 % in comparison with 2008г. in connection with % planning on discount bonds of JSC Kaztransgaz-Almaty in 2009, namely on accounts payable on the gas pipelines received from the foreign organizations;
Other expenses increased by +777 354 thousand tenge in absolute measurement or for +147 % in comparison with an indicator 2008г, i.e. 2,47 times more. The main reason for a deviation the developed exchange difference which made -1044996 thousand tenge in 2009 that in 60 times more values of a negative exchange difference of 2008 g which made-17293 thousand tenge, in connection with devaluation of national currency to US dollar and other main currencies on February 4 2009;
The general and administrative expenses decreased on-296 641 in absolute value or growth rate makes +81,64 % from an indicator of previous year, i.e. rate of a gain decreased for-18,36 % in comparison with 2008, in connection with economy on Compensation Fund;
Cost of check of devices of gas decreased by-6937 thousand tenge or growth rate made +68,08 % from value of cost of check of devices of gas in 2008.
Prime cost of services as differs economy in comparison with 2008 on- 791 753 thousand tenge or growth rate made +43,91 % from the sum of previous year.
In 2010г. The consolidated expense made 19 508 320 thousand тг., or for +9,17 % there is more than indicator in 2009. It is expedient to consider items of expenditure separately:
Prime cost of the realized gas increased by +15 % in comparison with 2009г., in connection with growth of volumes of realization of natural gas; In terms of money the gain made +1 995 474 thousand tenge since in natural expression the gain of volume of realization of gas made +37 555 thousand m3 or for +3,49 % more than the realized volume of gas in 2009г.
Cost of transportation of gas made 1 289 323 thousand tenge that on +319 262 thousand tenge there is more than value of previous year. In a percentage ratio the indicator grew by +32,91 %, i.e. growth rate of +132,91 %.
General and administrative expenses increased by 393 029 thousand tenge, or an increase of 29.80% compared to 2009, The bulk of the increase due to the payroll (↑ 32%);
Financing costs decreased by -96 242 thousand tenge in absolute value or growth rate of 78.38% of the previous year, ie expenses decreased by 22% compared to 2009. in connection with a reduction in interest payments to banks;
Other expenses decreased by-85 % in comparison with 2009г, i.e. growth rate made +14,65 % on value of this indicator of last year.
The main deviation is the share of the developed negative exchange difference, in connection with devaluation of national currency in January 2009, which existence ceased to be by the end of 2010. The currency difference made for the enterprise profit of +56624 thousand tenge.
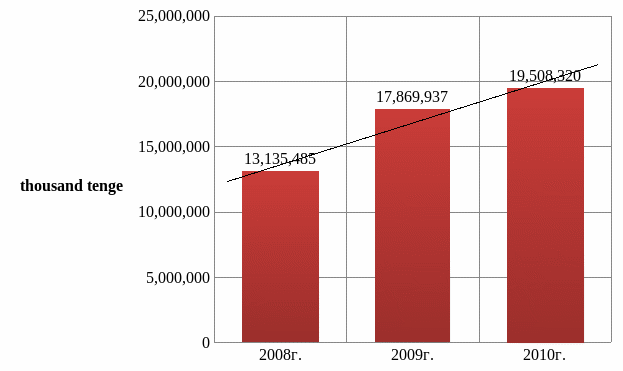
Figure 3. Consolidated expenses for the 2008 - 2010 years.
According figure 3 , it is possible to draw a conclusion that Expenses of the enterprise grow in dynamics. However, silly to argue that activity of the enterprise becomes less effective, judging by increasing items of expenditure of the enterprise in chronological measurement. One of problems of the management consists in increase in net profit at the expense of minimization of expenses.
Therefore to define the enterprise is effectively or not, it is expedient to consider an indicator Total profit during the period among dynamics.
Total profit of the Company:
- Despite that since January 1, 2009. The government of the Republic of Kazakhstan lowered a rate of corporate income tax from 30 % to 20 %, value of an indicator Net profit of the enterprise decreased by-970886 thousand tenge and growth rate makes +10,6 % from previous year or for +89,3 % less indicator of previous year. Dynamics of an indicator of Net profit is characterized by sharp recession in 2009 without watching at all at that fact that the volume of the cumulative income in 2009 grew by +36 % in comparison with 2008г.
- However, value of an indicator Net profit of the enterprise in 2010 in comparison with 2009 grew by +447386 thousand tenge and growth rate makes +488,48 % from previous year, i.e. value of an indicator of Net profit grew in 4,9 times.
In other words, the Net profit of the enterprise in 2009 is characterized by sharp decrease in value, but by the end of 2010 value of this indicator is leveled in a positive side. This results from the fact that on February 4, 2009. Tenge devaluated to US dollar and other main currencies. The exchange rate Before devaluation made 120 tenge for 1 US dollar and 150 tenge for 1 US dollar, respectively. Tenge devaluation considerably affected results of activity of the JSC Kaztransgaz enterprise for the year which has ended on December 31, 2009 as the enterprise has considerable loans and accounts payable in US dollars. An exchange difference which made -1044996 thousand tenge in 2009 that in 60 times more values of a negative exchange difference of 2008 g which made-17293 thousand tenge.
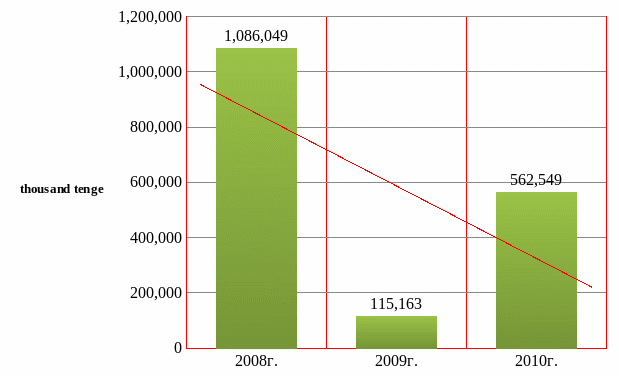
Figure 4. Total profit for 2008-2010.