- •Introduction
- •1.1 The history and description of activities of jsc "KazTransGas - Almaty"
- •Cs “KazTransGas Business Areas
- •1.2 Company's Mission , Prospects and Development Strategy
- •1.3 Occupational Health and Safety
- •1.4 Company's Investment Policy and Planning
- •1.5 Occupational safety & health & environmental protection
- •1.6 Social politic
- •1.7 The place and importance of the Department of Finance and Economy in the enterprise jsc "KazTransGas - Almaty"
- •1.8 Characteristic of technology and production organization
- •2.1 Analysis of volumes of realization of production and rendering of services
- •2.2 Horizontally - vertical analysis of structure of the Balance Sheet
- •2.3 The analysis of financial stability and liquidity of the company
- •Indicators of solvency of jsc Kaztransgaz-Almaty on the beginning and for the end of 2010.
- •2.4 Analysis of key financial performance indicators for performance
- •2.5 Analysis of structure of an indicator Income of primary activity of the enterprise
- •2.6 Analysis of profitability of realization of production and services
- •Indicators of the Income of jsc Kaztransgaz for 2009-2010.
- •3.1 Planning at the enterprise
- •3.2 Analysis of security with a manpower
- •Conclusion
2.5 Analysis of structure of an indicator Income of primary activity of the enterprise
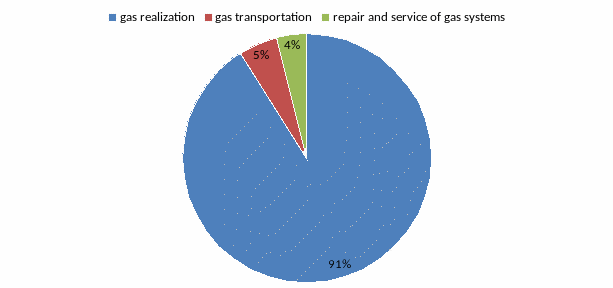
As the JSC Kaztransgaz-Almaty enterprise is provided by a wide range of rendering of services and gas realization, it is expedient to reveal a share of the income of each direction in the general structure.
Thus, the main volume of realization is the share of realization of gas which makes 91 % from all Revenue. For the end of 2010. The proceeds from sales of gas made 17 812 009.
At first the Company bases, the main direction is realization of natural gas around the city Almaty and Almaty area.
Table 6.
Structure of the income of the JSC Kaztransgaz enterprise for 2010.
Activity |
thousand tenge |
% |
- gas realization |
17812009 |
0,90716 |
- gas transportation |
1080385 |
0,05502 |
- repair and service of gas systems |
742545 |
0,03782 |
Total: |
19634939 |
100 |

Figure5. Structure of the Income of primary activity in the directions in 2010
2.6 Analysis of profitability of realization of production and services
For the analysis of profitability of realization of production the following values of indicators of the consolidated profit and loss report for 2009 and 2010 which are presented in the following table were used:
Table 7.
Indicators of the Income of jsc Kaztransgaz for 2009-2010.
thousand tenge
Indicators |
2009 |
2010 |
Revenue |
17590579 |
19634939 |
Gross profit |
2 790 522 |
2 378 856 |
Operating profit |
535108 |
791052 |
Net profit during the period |
115163 |
562549 |
The calculated factors of profitability are presented in the following table:
Table 8.
Profitability indicators for 2009-2010.
thousand tenge
Indicators of profitability of sales |
2009 |
2010
|
Indicator change |
Calculation formula |
Gross profitability of realized production |
0,16 |
0,12 |
-0,04 |
The ratio of gross profit to sales revenue |
Operational profitability of realized production |
0,03 |
0,04 |
0,01 |
The ratio of operating profit to sales revenue |
The net return on sales |
0,01 |
0,03 |
0,02 |
The ratio of net profit to sales revenue |
In 2010. The gross margin is 12%, i.e. of the total income is 12% gross profit. The gross margins in 2010 decreased by 4% compared with the value 2009, indicating a decrease in production efficiency of the enterprise. Even though the increase in volume of sales in 2010, the gross margin is characterized by a decline. This is explained by the fact that in 2010 increase in cost of goods sold and services is 16.59%, which is less than the increase in basic income, which amounted to 11.62%. Also not shown on the effectiveness of pricing policy for products and services.
In 2010 despite the increase in administrative expenses to 30.8%, ratio of operating profit increased by 1% to 4%, i.e. of the total income is 4% of operating profit, which included more sitting taxes, net income and more. In 2010, an increase in operating profit due to positive exchange rate difference, part of 56 624 thousand tenge in detachment from negative exchange rate difference of 2009, Which amounted -1,044,996 thousand tenge as a result of the devaluation of the tenge against the U.S. dollar and other major currencies.
In 2010 the net profitability has increased by 2% due to the increase in net income on a 388.5%, i.e. more than 3.5 times the result of the previous year. This circumstance is due to fortuitous external independent from the management company factors - positive exchange rate difference, which amounted to 56,624 thousand tenge in contrast to the negative exchange rate difference, which amounted in 2009 -1,044,996 thousands.
Chapter 3. Business planning
