

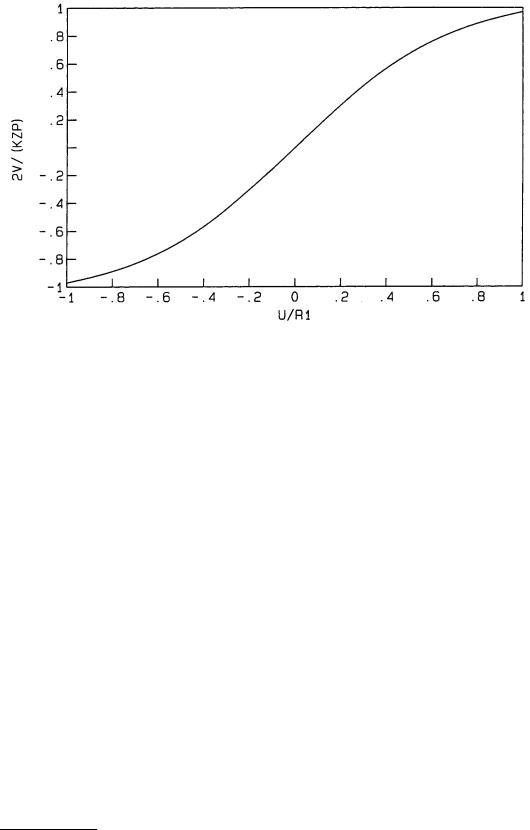
FIGURE 6.117 The normalized response 2V/KZP in a bicell detector as a function of u/r1 for y1 = y2 = r1/10.
Continuous Position Sensor
The position information in a continuous position sensor (also known as a lateral-effect photodiode) is derived from the divided path taken by photon-generated electrons to two back electrodes on the device. For a homogeneous device, the current to an electrode depends only on the distance of the centroid of the light beam from that electrode; the currents would be equal in an ideal device when the beam is located at its electrical center.
Consider the analysis of a one-dimensional continuous PSD. The current signal from each electrode is converted to a voltage signal by a transimpedance amplifier with gain, Z. Operational amplifiers are then used to provide the sum signal, Vs = KPZAs , and the difference signal, Vd = KPZAdαu, where As and Ad are the sum and difference amplifier gains, respectively. The position sensor sensitivity, α, is then given by:
α ≡ |
Vd |
As |
(6.138) |
|
|
uVs Ad
which is determined by measuring Vd and Vs as a function of u.
Characterization of PSDs
The PSD characteristics presented here were measured by mounting the device to a translation stage with an optical encoder driven by a piezoelectric motor [9]; the position accuracy was ±0.1 µm. An appropriately attenuated He–Ne laser beam was directed at normal incidence to the PSD as it was translated past the beam. The PSD sum and difference voltages were measured with GP–IB digital voltmeters as a function of displacement; the PSD displacement and voltage measurements were computer controlled.
The operation of a knife-edge PSD can be evaluated using the signal from one side of a bicell as well as from a photodetector behind a knife edge. The transimpedance amplifier output voltage corresponding
© 1999 by CRC Press LLC
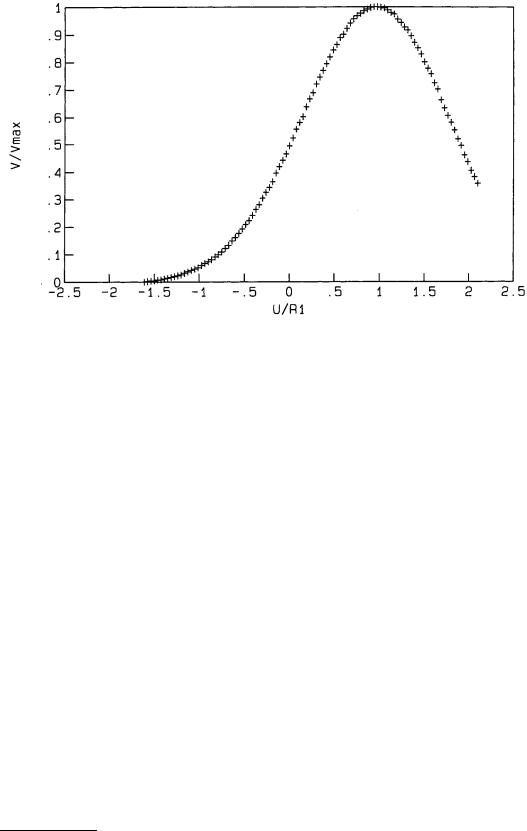
FIGURE 6.118 Transimpedance amplifier output voltage corresponding to the current signal from one cell of a United Detector Technology (UDT) SPOT2D bicell as a function of displacement. Data are plotted as normalized cell voltage vs. u/r1.
to the current signal from one cell of a United Detector Technology [10] (UDT) SPOT2D bicell is shown as a function of displacement in Figure 6.118. The data are plotted as normalized cell voltage as a function of u/r1. Since the signal from one cell of a bicell is equivalent to a knife-edge photodetector, the data can be compared with Figure 6.115. The data are in reasonable agreement for u/r1 < 1 and a best fit allows the inference of r1 = 0.4 mm; the disagreement for u/r1 ≥ 1 corresponds to the laser beam partially moving off the outside edge of the cell.
The operation of a bicell PSD is evaluated by the data of Figure 6.119 which shows the difference voltage as a function of displacement for the UDT SPOT2D. The deviations from the theoretical curve of figure 6.117 for u ≤ 0.4 mm and u ≥ 1.1 mm are due to the beam moving off the outside edges of the bicell. The linear region of the PSD is centered at the optimal quiescent point (V1 – V2 = 0); a leastsquares fit of a straight line gives a slope of A12 = 4.88 mV µm–1 for this device. For the data of Figures 6.118 and 6.119, P = 0.37 mW and Z = 5 kΩ; thus, the experimental value of the responsivity is determined
to be Kexp = 0.65 A W–1. The nominal gap size of the SPOT2D bicell is such that y1 = 63.5 µm; thus, using this value of y1 and r1 = 0.4 mm in Equation 6.137, the calculated bicell sensitivity is 3.8 × 10³ m–1. The
experimental value of sensitivity is calculated from A12, Kexp , P, and Z to be 4.1 × 10³ m–1.
Evaluation of the operation of the x-axis of a UDT SC10 two-axis continuous PSD is illustrated in Figures 6.120 through 6.122. The PSD was oriented such that the y-axis was vertical; thus, ideally, Vdy is constant as the PSD is translated, except near the edges of the 10 mm × 10 mm device. As shown in Figure 6.120, Vsx is virtually constant except near the edges of the device; this means that the optical responsivity (K) does not greatly vary with the laser beam position on this detector. Variation of Vdx with displacement is shown in Figure 6.121; this PSD has a broad linear range. The linearity of continuous PSDs can often be improved by using the ratio, Vdx /Vsx , as shown in Figure 6.122; the sensitivity of this PSD is determined from a least-squares fit of the linear part of this characteristic to be 183 m–1.
A newer class of PSDs is represented by the Sitek [11] 1L10 single-axis continuous PSD, which is typically more linear. An example of the Vd /Vs versus u characteristic is shown in Figure 6.123. The sensitivity is determined from a least-squares fit of the linear part of the characteristic to be 307 m–1.
© 1999 by CRC Press LLC
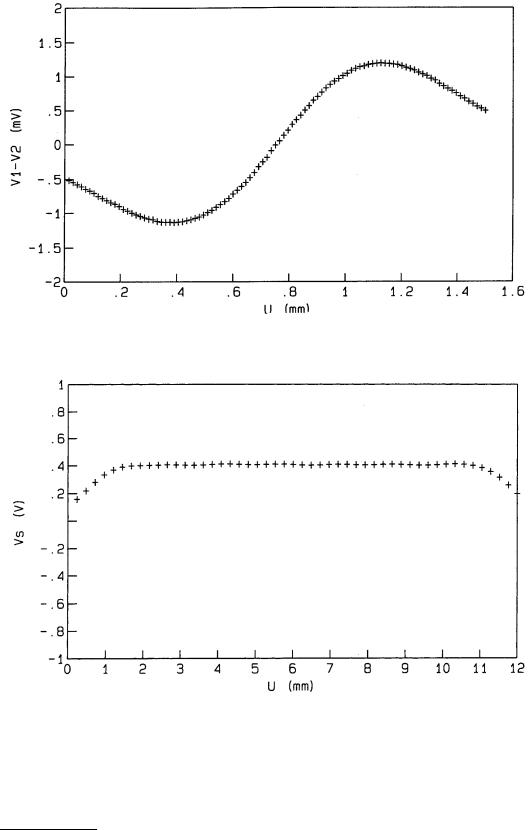
FIGURE 6.119 Difference voltage as a function of displacement for the United Detector Technology (UDT) SPOT2D bicell.
FIGURE 6.120 Sum voltage vs. displacement for x axis of UDT SCIO continuous PSD.
Summary
A PSD composed of a knife-edge photodetector is simple, has a sensitivity that depends only on the radius of the laser beam, and has a response time determined by the photodetector. Thus, for fast risetime detection of small displacements, this type of PSD is to be preferred.
© 1999 by CRC Press LLC
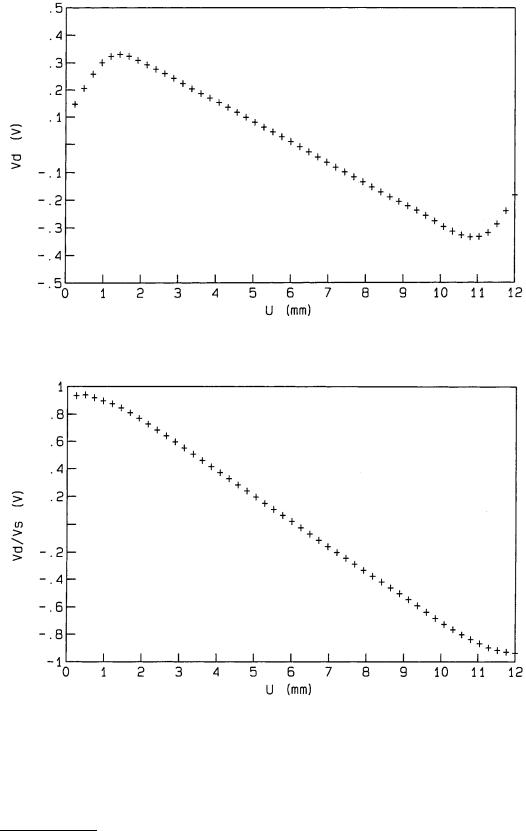
FIGURE 6.121 Difference voltage vs. displacement for x axis of UDT SCIO continuous PSD.
FIGURE 6.122 Ratio of difference voltage to sum voltage vs. displacement for x axis of UDT SCIO continuous PSD.
The maximal sensitivity of a bicell is about 20% greater than that of a knife-edge photodetector. It has the advantages of small size and economy. The nominal risetime of the UDT SPOT2D is of the order of 10 ns. Furthermore, two-axis detection can be readily obtained with a quadcell, with an increase in risetime due to the increased capacitance of the detector.
© 1999 by CRC Press LLC