

Measurement of Radiation Damage in Tissues
Assays of Tissue Response
In order to compare and contrast the responses of different tissues to radiation, assays that allow the assessment of damage as a function of dose are essential. Two criteria are necessary for an assay of tissue effect to he of value:
It must be quantifiable (i.e., assign a number to it).
The effect must increase with increasing radiation dose.
Many techniques that meet these criteria for a wide variety of normal tissue are now available for measuring tissue response to radiation in experimental animals. These techniques either provide cell survival curves or dose response curves.
There are many ways to assess the effects of radiation on tissues in vivo, but for our purposes the most critical test will be the ability of the dividing clonogenic (stem) cells to undergo unlimited division, i.e., to retain their reproductive integrity. It is clear that such an assay is reasonable for cells grown in vitro. In this situation cell survival can be assessed as a function of dose and cell survival curves obtained. The questions are whether it is possible to obtain survival curves for cclls of tissues in vivo and, if it is not, how tissue responses to radiation are then measured.
Assays of damage in organized tissues and organs can be divided into three categories:
Clonogenic (related to the reproductive integrity of the clonogenic stem cells in the tissue)
Specific tissue function
Lethality
Clonogenic Assays
Based on the previous discussion of cell populations, it is clear that if a tissue contains stem cells that divide and form clones in vivo and if these stem cells can be easily identified and quantified, ihen the construction of' survival curves for the target cells of this tissue in situ is possible. There are a number of such "clonogenic" assays for some normal tissues: bone marrow, testis, and mammary and thyroid glands, to name just a few. in some of these, clonogenic survival is assessed in situ in the same animal that was previously irradiated (skin, basal cells of the epidermis; intestine, number of surviving crypt cells; testis, number of tubules containing spermatogenic epithelium). In others, the cells arc taken from the irradiated animal (donor) and transplanted into a genetically identical mouse Гог assay.
In Situ Assays.
Withers and his colleagues have been instrumental in developing in situ clonogenic assays for a number of normal tissues, including skin, intestine, testis, and kidney. The intestine will be used to illustrate this technique.
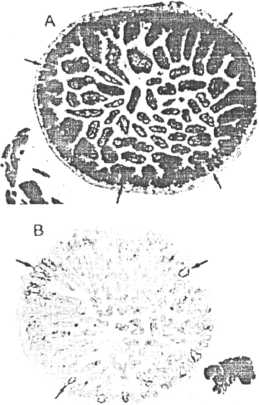
The intestine is an example of a tissue in which dividing cells are confined to one location, the crypts of Lieberkiihn. These cells divide about every 12 hours, replacing their own population, plus providing a constant supply of cells for the nondividing differentiated cells that are sloughed from the villi every 24 hours. The villi are dependent on the crypts for cell replacement; if the cells in the crypt are dead, the villi become shortened, flattened, and partially or completely denuded. In the intestine, then, damage is due to killing, with subsequent depletion of the cells in the crypts of Lieberkiihn followed by denudation of the epithelial lining of the mucosa. Figure 7-4 shows a control, nonirradiated intestine tissue (A), and two examples of irradiated intestine tissue (B and C). Because the crypts are easily identified using the light microscope, the number of surviving crypts can be counted and plotted as a function of dose. Since it is assumed that a crypt can be repopulated by one surviving cell, a cell survival curve can be constructed. An example of such a crypt cell survival curve is given in Figure 7-5. Similar techniques are used in the testis and skin to obtain cell survival curves. In all of these acutely responding normal tissues, survival is assayed within a month after irradiation, reflecting the rapid turnover of the clonogenic stem cclls in each tissue.
Recently, Withers and his colleagues have developed an in situ clonogenic assay for kidney, a late responding normal tissue. The underlying hypothesis on which the assay is based is that radiation damage in the kidney is due to depletion of the parenchymal cells, specifically the epithelial cells of the proximal tubules.
At first glance this may seem surprising, since the cells of the tubule epithelium are well differentiated and divide very slowly. However, unlike the other tissues in which damage is expressed within a month after irradiation (3 days in intestine, 2 to 3 weeks in skin, and 4 weeks in the testis), damage in the kidney is expressed at 1 year after irradiation, reflecting the slow turnover of the tubule cells suggested to be the critical
cells killed by radiation. The survival curve for epithelial cclls in kidney tubule is shown in Figure 7-6. The Du for these cells is 1.5 Gy. Thus, the target cells for this late responding normal tissue have sensitivity similar to that of the acutely responding normal tissues.
![]() •v;
•v;
Л , ■**'
‘!*nw
\
lie; 7-4.
Examples of jejunal tissue from (A) a nonirradialed mouse. (B) a mouse given a moderate single dose of radiation, and (C) a mouse given a high single dose of radiation. Crypts are easily recognizable (arrows), they are quantifiable, and cell survival curves can be constructed from the
Transplantation Assays.
The assays of clonogenic survival in bone marrow and thyroid and mammary glands require that the irradiated tissue be removed from the
' О
animal and a single cell suspension be made and then injected into another animal. In other words, the recipient animal acts like a culture dish. This technique is best illustrated by the bone marrow colony-forming units (CPUs) assay developed by Till and McCulloch: (1) animals arc irradiated to the whole body with a range of doses, (2) bone marrow is removed from their legs, and (3) single cell suspensions are made, various amounts of which are injected into previously irradiated syngeneic recipient animals. (The recipient animals must be previously irradiated so that all their bone marrow cells are destroyed, allowing the cells of the donor mice to grow.) These donor cells colonize the bone marrow and spleen, forming visible colonies in the latter. The spleen is removed 9 days later and the number of colonies counted, each of which is assumed to have arisen from the injection of one surviving cell. The number of colonies after each dose is counted; the proportion of cells surviving calculated and plotted as a function of dose. An example of a survival curve for bone marrow cells is given in Figure 7-7. Similar assays are available for thyroid and mammary glands.
FIG
7-5. Survival
of crypt cells following radiation either alone or in the presence
of a kno
i vi i rad
і о
-pro
lector. IVR-2721.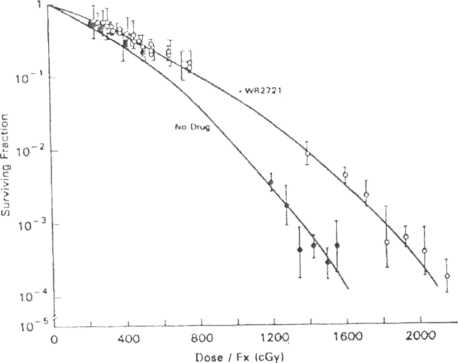
FIG
7-6.
Dose
survival curves for kidney tubule cells showing a Du of about 1.5
Gy.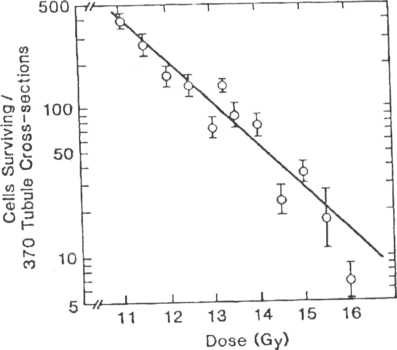
Survival curves for all clonogenic assays in vivo are plotted in Figure 7-8. Although there is a range of sensitivities, the biggest difference between these survival curves for tissues is the shoulder, not the slope (i.e.. D0 values are more similar than the shoulders). Although the data for the kidney are not plotted, it is clear that the kidney has a similar sensitivity to the more rapidly dividing normal tissues, i.e., the D0 is within the range for the rapidly dividing normal tissues.
Functional Assays
Many tissues do not have clonogenic stem cells that can be readily identified and quantified, particularly those tissues classified as late responding. Thus our knowledge of how these tissues respond to radiation has been minimal. However, it is obvious that these tissues arc as important as the acutely responding normal tissues for obtaining a favorable outcome when treating a tumor with radiation, this has prompted the development of new assays of function for many tissues. These functional endpoints meet the criteria that damage must increase as a function of dose. Such data produce dose response curves rather than cell survival curves, and although they tell little about the survival of the underlying putative target cells, they do allow comparison of tissue responses to radiation. Most of these are based on cither the physiology of the organ (e.g., breathing rate measurements after lung irradiation, frequency of urination after bladder irradiation), whereas others rely on scoring visible changes in the organ that occur after irradiation (e.g., acute skin reactions consisting of hair loss, erythema, and desquamation). Such techniques have been invaluable in increasing our understanding of the responses of late responding normal tissues to radiation.
I
lC 7-7.
Percent
survival as a function of dose for colony-forming ability of mouse
bone marrow cells. This is an example of a survival curve from a
transplantation assay. The cells are irradiated in a donor and then
transferred to a lethally irradiated recipient,
and the
resultant spleen colonies are counted.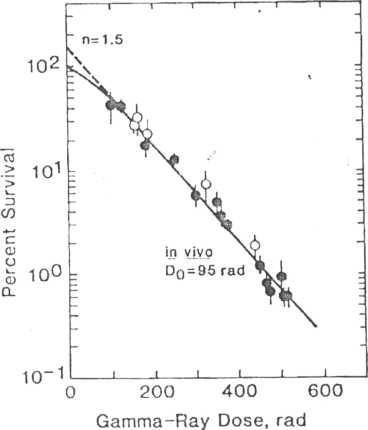
Dose
(Gy)
FIG
7-8.
Survival
curves as a function of dose for a number of clonogenic assays in
vivo, showing that the slopes of the survival curves are similar
(Do values fall within a narrow range). However, the biggest
variation in these survival curves is in the shoulder region.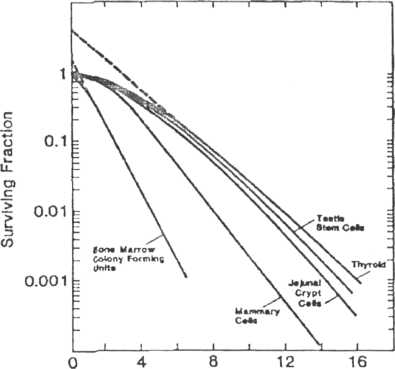
Lethality
The single most often used nonclonogenic assay for quantifying damage in normal tissues is lethality. In these studies the number of animals dead after localized irradiation of a specific organ is quantified as a function of dose and dose response curves are then constructed.
The lethal dose that kills 50% of the animals, LD50 is obtained for different normal tissues, allowing comparisons of the dose for this same effect (called isoeffect) between tissues.
The LD50 for a given tissue is further defined by the time when deaths occur. Based on the assumption that cell division is necessary for radiation damage to be expressed, deaths would occur quickly after irradiation of the intestine (by irradiating the whole abdomen), but much more slowly after irradiation of the lungs, reflecting the differences in turnover times of the critical cclls in these two tissues.
Figure 7-9 presents a series of dose response curves for lethality after localized irradiation of different normal tissues. For comparison, the dose response curve for spinal cord paralysis is also shown. The LD50 for each tissue is given in Table 7-4.
Table 7-5 lists all the quantitative endpoints which are available for assessing the response of normal tissues to radiation in experimental animals.
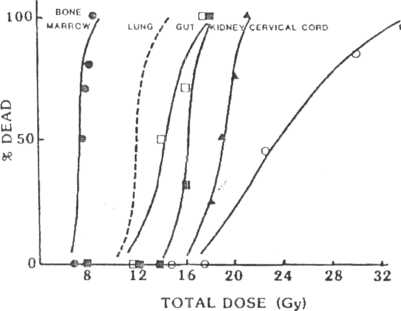
FIG 7-У.
Number of animals dead is a function of dose for six different normal tissues. In general, the curves are ve/у sleep, although they are displaced on the dose axis, bone marrow being most "sensitive," and esophagus, most "resistant."
TABLE 7-4
LDjo Values Estimated from Dose-Response Curves Гог Radiation Damage to Various Normal Tissues in F.xmerimental Animals.
Tissue |
Animal |
Assay |
1 ,D3(| 1 |
Bone marrow |
Mouse |
Death, 30 days |
7.20 |
Lung |
Mouse |
Death, 80-100 days |
12.34 |
Gul |
Mouse |
Death, 10-12 days |
14.20 |
Kidney |
Mouse |
Death, 500 days |
16.00 |
Spinal cord |
Rat |
Paralysis, 7 1110s |
19.00 |
Lsophagus |
Mouse |
Death, 20 days |
24.80 |