

Ceramic Technology and Processing, King
.pdfSlip Preparation Procedures 63
strange things in the grain, so it is a good idea to examine the grain at least with a stereo binocular or a petrographical microscope looking for extraneous materials.
Aspect Ratio
Coarse-grained particles are the result of crushing, leaving jagged particle shapes. As these do not pack very well, it may be necessary to mull the grain. Iron is introduced and may have to be removed. Dry magnetic separation is inexpensive. When this is not good enough, spend more and use an acid leach.
Fibrous materials and platey shapes are also used in refractories and alumina ceramics. One example is talc in a cordierite batch. Talc is a common source of MgO in ceramics and refractories. Platey shapes pack well, like bricks in a wall. Fibrous shapes do not pack well; they form tangles.
Platelets are more commonly found in traditional ceramics and refractories than they are in finer ceramics. Graphite, coarser Bayer alumina, micaceous minerals, and clays are platey. Plates will orient themselves during processing and will also segregate, especially when their size is large. Sometimes orientation is needed, an example being foundry crucibles where graphite platelets can be oriented parallel to the crucible wall, thereby decreasing metal penetration and thermal conductivity.
Whitewares are mostly clays reconstituted into the glassy phase during the firing process. Clays and related platey materials are slippery and sometimes are added to help in the processing.
Check List, Coarse grain
When working with coarse grains, observe the following list:
•choose a sintered or fused grain,
•select gap sizing or blending of normal distributions, and
•choose a grain shape, mull if a higher density is required.
64 Ceramic Technology and Processing
3.0 FINE PARTICLE SIZED SLIPS
This section addresses two aspects of these fine slips: particle size measurements and the physical constitution and chemistry effect on viscosity.
Particle Size Measurements
One technique for measuring particle size is microscopy. By our definition, the fine particles are too small for optical microscopy to be of much help for measuring size. So, we need to use electron microscopy. There are two main types: scanning and transmission microscopy.
Scanning Electron Microscopy (SEM)
The useful range of magnification is enormous, ranging from about 4X to about 20,000X. Resolution limitations, especially for electronic insulators, start to blur the image at extreme magnification. Depth of field is large because of the scanning method that samples one layer at a time and then assembles them into the field of view. There is no color except artificial, and there is no access to optical properties. Wave length dispersive or energy dispersive analytical techniques determine the chemical composition of the particles. The capacity to obtain compositional information on the surface is a valuable asset for the SEM instrument.
Preparation of the sample may be difficult. One strives to obtain a uniform dispersion of the particles on the sample holder, called a stub. The particles may clump up as the droplet dries due to surface tension. Dispersions in some organic liquids can produce an improvement. Acetone or low molecular weight alcohols have lower surface tension and a lesser tendency for capillary forces to agglomerate particles on the stub. After the sample is coated by sputtering with a metal to make it conductive, it is placed in the SEM. The analysis centers on particle shape, size, agglomeration, and phase composition.

Slip Preparation Procedures 65
There is no way that one sample can be truly representative of the material because it is so small. Examination of additional samples increases the confidence in the measurements, but this is time consuming and expensive. A good practice is to examine at least three fields of view.
Whenever there is more than one particle composition, energy dispersive analysis will identify each different particle composition. It is useful and advisable to have an energy dispersive capability in the microscope. Wave length dispersive capability can analyze particle compositions to atomic number 5 (Boron) and a sensitivity to parts per million for some elements. Wave length dispersive capability is more difficult to use, but it may be needed to solve certain problems. When an SEM is acquired, both energy and wave length dispersive capabilities should be available as options that can be added later.
The SEM photos can be analyzed for making measurements of particle dimensions. The microscope shows the magnification on the screen. If there is the need for exact measurements, latex spheres in a few sizes are available for such a calibration. One measures only two dimensions in the plane of view. Image analyzers are available when there is an extreme amount of work to do. For most analyses, a good ruler is sufficient to make the measurements. The technique is to place randomly spaced lines on the photo and, without regard to judgment, measure the intercept of each particle. Particle size distribution will converge quickly. Figure 4.3 is a schematic view of this measurement process.
Figure 4.3: Particle Size by Intercept Measurement. Randomly spaced lines are used to measure each particle.
66 Ceramic Technology and Processing
The field of view is transected by a randomly located line. In this illustration, there are 11 numbered particles along the line. Each particle's dimension is measured along the line intercept as shown in Table 4.1.
Table 4.1: Particle and Intercept Measurements
Particle |
Interce |
Comment |
Number |
pt |
|
|
(mm) |
|
|
|
|
1 |
|
Off the field of view |
|
|
|
2 |
10 |
|
|
|
|
3 |
10.5 |
|
|
|
|
4 |
|
Edge covered up |
|
|
|
5 |
27 |
|
|
|
|
6 |
2 |
While deceptive, it will even out |
|
|
|
7 |
8 |
|
|
|
|
8 |
8 |
Do not be concerned about elongation |
|
|
|
9 |
2 |
Measure small particles |
|
|
|
10 |
29 |
Elongation does not matter |
|
|
|
11 |
1.5 |
First measurement completed, move line |
|
|
another random location |
|
|
|
While the above data is hardly enough, the mean size and standard deviation can be calculated. The mean is 10.8 mm (divide by the magnification), and the standard deviation is 10.3 mm. The mean and standard deviation will converge quickly. An additional five lines were drawn across Figure 4.3. The resulting data, taken with a ruler, is illustrated in Figure 4.4.
The curves are cumulative as data is added. The mean levels out very quickly, while the standard deviation continues to drop at a low rate.

Slip Preparation Procedures 67
There is a total of only 29 measurements represented in these curves, with reasonable results. However, data from 10 lines would be more appropriate, as this only takes a few minutes.
Figure 4.4: Convergence of Particle Size Data. The mean converges quickly. Standard deviation starts to level out.
SEM microscopy has an advantage in that the particle shape is seen and if other phases are present, they can be observed and measured. This technique is also useful for measuring the volume % of other phases or porosity using polished sections. One can see the particles in Figure 4.5 that is an SEM view of alumina, A16-SG (Alcoa).
One can use such a field to make measurements of the PSD. However, it would be better if the particles were more dispersed and at a higher magnification.

68 Ceramic Technology and Processing
Figure 4.5: SEM View of A16-SG. Ideally, the particles should be dispersed evenly. Scale bar 1 μm.
Transmission Electron Microscopy (TEM)
The resolution from TEM is much better than the resolution obtained from SEM. Sometimes with using TEM, one can resolve the layers of atoms in a lattice plane. TEM is much more laborious and has fallen into disuse for particle measurement applications unless the particle size is below the SEM range. Wherever it is appropriate, TEM should be considered. Figure 4.6 illustrates the detail of ceramic particles when using TEM.
The micrograph shows plasma dissociated zirconia using a replica technique. Detail is superior to other methods, but it is tedious and takes skill. Whenever this amount of detail is needed for either technical or aesthetic reasons, TEM replicas should be considered.

Slip Preparation Procedures 69
Figure 4.6: TEM View of Plasma Dissociated Zirconia. Resolution is excellent with TEM. Scale bar 1 μm.
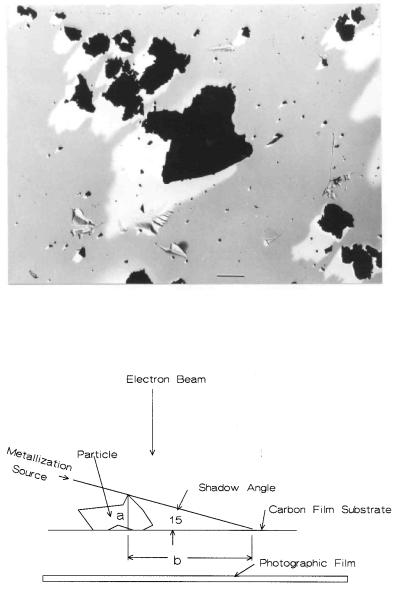
There is another technique for TEM or optical microscopy that produces data on all three particle dimensions. Particles in a dispersed state can be shadowed at an angle (15 degrees) on a carbon film. This produces a photo that shows both the dimensions in the plane and, by trigonometry, the vertical dimension. Keep in mind that particles tend to lay flat when sedimented.
A shadowed TEM photo is shown in Figure 4.7. The material is silicon carbide powder with the shadows obtained by oblique (15 degree) vapor deposition. Figure 4.8 shows the geometry.
70 Ceramic Technology and Processing
Figure 4.7: TEM Shadowed SiC Particles. Shadowing shows the vertical dimension. (Scale bar 2 μm).
Figure 4.8: Shadowing Geometry. Fifteen degrees is a useful angle for shadowing. The particle height is Tan15° = h/1.

Slip Preparation Procedures 71
Data can be represented as a triaxial plot as shown in Figure 4.9. In the photo, the longer dimension (a) is in the plane of view along with the shorter dimension (b) and the calculated vertical dimension (c). The plot shows the ratio of 'a/b' along the horizontal base and the calculated height along the vertical axis. Part of the diagram is excluded either by definition or by settling mechanics. Since the particles lay flat, 'a' is greater than 'b' by definition, and 'c' will almost always be smaller than either 'a' or 'b'.
Figure 4.9: Particle Geometry Plot. The right half of the diagram is excluded by definition. The top is improbable because particles lay flat.
Some shapes are located on the diagram for reference. A plot of all three dimensions adds a third dimension to the information on particle shape.
The data as presented is quantitative. Platelets or fibers are oriented flat because of their geometry, thus establishing a built-in bias on particle shape measurement. This is one technique to obtain the vertical dimension. With larger particles, one can use the fine focus of the optical microscope to obtain the third dimension. To obtain this, one focuses on the top of the particle and then on the slide surface, with the difference being a measure
72 Ceramic Technology and Processing
of the height. Precision depends on the magnification of the objective lens. A cover glass over the particles will protect the objective lens from being scratched.
Microscopic methods for measuring particle size, especially for fine particles, have largely given way to other techniques such as light scattering (diffraction). Over the past few years, these instruments have greatly improved in quality and many good choices are available presently. I have a conceptual problem with light diffraction or scattering as a measurement tool. The diffraction spectrum is diffuse with only a few broad bands. To put it another way, no crisp data is available in the spectrum. It is a stretch to calculate the particle size distribution in detail from such diffuse data. Nevertheless, the data reduction is fast, convenient, and reproducible. Since the distribution is periodically checked against microscopy, the author would use this method as a matter of choice.
Alternatively, there are sedimentation techniques: centrifuging and light absorption or by settling and x-ray absorption. These are good methods for particles that are larger than about 2-4 μm. Another method is to measure the electrical conductivity in an orifice as the particles stream through. Conductivity will decrease in proportion to the cross section of the particle. There are three problems with this technique. The orifice can become plugged, the measurements are not sensitive for small sizes, and the particles can be some shape other than block-like. All could result in false readings.
Sample preparation is important. One good method involves ultrasonic dispersion in a soundproof chamber and using a magnetic stirrer placed on a lab jack. A flat tipped ultrasonic horn works well. The end of the horn will erode in the center but not on the edges. It can be machined smooth but do not take off too much material or the horn will be off-tune. Use titanium for the horn. (The machinist should be informed of this as titanium is difficult to machine.) A stirring rotor is Teflon coated and works best if it has a slanted top surface that lifts the liquid so that all of the material is uniformly dispersed. Dispersants are commonly used. Dispersion time and intensity are standardized. Typical time could be about 3-5 minutes, and intensity about 60% of the instrument's capability. Establish both these factors by extending the time and intensity to where the particle size measurement stabilizes. Throwaway polyethylene pipettes are very useful to take out allocates.