

11 Mapping Agricultural Terraces in Italy. Methodologies Applied … |
183 |
11.3Result and Discussion
In some cases, especially remote zones which are not covered by high-resolution spatial data such as satellite imageries or LiDAR data, the use of traditional cartographic analysis, i.e., the long-lasting methodology described, is often required. In the maps of Italian Military Geographical Institute (IGMI) and in the maps of Carta Tecnica Regionale (CTR, Regional Technical map), the presence of cartographic symbols which represent supporting structures like dry-stone walls is often useful to directly identify terraced features and to directly extract these features by selection (in case of digital topographic map) or to indirectly map them by on-screen digitizing. The nominal scale of the maps is contingent upon both the accuracy of individuation and extraction of the features, and the spatial accuracy of the survey employed in the map construction. As an instance, the Italian Regional Technical Map (CTR) is usually an appropriate scale (1:10,000 and 1:5000) which make possible to represent dry-stone walls, for terrace steps major or equal to 10 m, among different supporting structures; however, regional technical maps are recent, edited after 1980, and their information derived from spring or summer aerial survey of the same time: Therefore, in case of abandonment of agricultural activities, growth of vegetation could hide the presence of terrace landforms. Hence, the use of this methodology has required the implementation of field and/or dedicated aerial surveys such oblique and zenithal photos in the winter season to reduce the canopy hiding effect. In Italy, many previous studies tested or applied this methodology when LiDAR or UAV data were not yet available (Varotto 2004; Tres and Zatta 2006; Rizzo et al. 2007; Varotto and Ferrarese 2008; Agnoletti et al. 2015; Modica et al. 2015). In Sicily Region, a whole mapping of agricultural terraced systems was performed at the regional scale, combining traditional cartographic analyses with use of aerial photos, field survey and on-ground photos as well. In this case, ground photos were often useful due to the arid climate and the seldom vegetation that let the terrain morphology to be seen from remote (Barbera et al. 2010). A survey on LiDAR DTM of the Filicudi Island (Fig. 11.1: 1) suggests that the total extension of terraced systems in Sicily could be underestimating (Terranova 2016). A digital map survey of the Campania Region was performed both by data collected in a topological geodatabase in GIS environment and by traditional cartographic analysis (Ronza 2006; Gravagnuolo and Di Martino 2015); however, a LiDAR DTM analysis suggests a wider extension of the terraced systems with respect to the previous surveys (Brugnaro 2016).
Often, the use of remote sense imagery lets to detect few or none features in case of high and dense canopies or wooded lands, but it is worth noting that dense vegetation could be related to the season of the aerial survey and to the environmental and climate context of the area. Forest cover generally makes optically barely visible—sometimes totally invisible (Rühl et al. 2005)—from aerial imagery terrain landforms such as agricultural terraces: So, mapping these geometries is arduous. Thus, historical maps and aerial photos produced before 1960—the beginning of abandonment of terraced agriculture—are important documents which

184 |
F. Ferrarese et al. |
Fig. 11.1 Final result of the MAPTER project. In black terraced systems. Numbers of zones are cited in the text: (1) Filicudi Island; (2) Lazio region; (3) Terragnolo Valley; (4) Cembra Valley;
(5) Brenta Valley; (6) Fumane area; (7) Costa Viola; (8) Gargano area; (9) Ischia Island; (10) Rio Freddo Valley
should be considered for mapping and surveying abandoned agricultural terraces hidden under the forest canopy. Indeed, photos and orthophotos analyses are usually combined with traditional cartographic analysis and field survey (Tres and Zatta 2006; Varotto and Ferrarese 2008). The first map of terraced systems obtained by using orthophotos, at a regional scale, was about the Liguria Region, in which
11 Mapping Agricultural Terraces in Italy. Methodologies Applied … |
185 |
the analysis has been validated with the aid of cartographic and field survey (Brancucci and Masetti 2008; Brancucci and Paliaga 2006; Brandolini et al. 2008; Brandolini 2010).
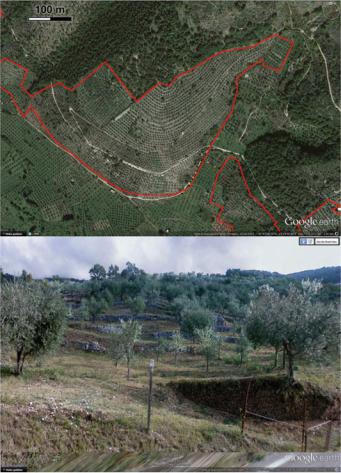
Within the MAPTER project, WMS and Geobrowsers were paramount in mapping terraced systems, especially in arid or Mediterranean semi-arid environments, like the mid-southern regions (36–42°N), where dense vegetation canopies are quite rare and so the morphology is easily visible (See Varotto et al. in this book). At the same time, it is worth noting that terraced landforms’ detection need high-resolution images, in addition to a landscape not covered by a dense canopy. Moreover, hardware needs broad bandwidth to load high-resolution imagery of WMS. Currently, an interesting geotool is represented by the Street View Service, implemented into the Geobrowser Google EarthTM: By means of on-ground 360° georeferenced photos, this application may be used as a powerful tool to perform ground truth on remotely sensed data previously analyzed, identifying terraced systems on the ground. But a strong limit of this survey is that terrestrial imagery is provided only from roads, sometimes far from terrace systems. In some study areas, during the activity of MAPTER project, we combined visual analysis on satellite images with Street View ground photos to survey terraced systems: According to GIS analysis, this methodology showed good results in the Lazio Region (Figs. 11.1: 2 and 11.2), by 5673 ha of agricultural terraces mapped (the fifth Italian Region for terraced systems on percentage of regional area); on the contrary, the same combined methodology performed poor results in Marche and Veneto Regions, due to the presence of wide canopy areas and for the high value of abandonment of terraced areas.
The MAPTER project (see Varotto et al. in this book), thanks to the availability of LiDAR DTMs for many terraced areas, was carried out by performing features extraction by the analysis of the profile curvature, which is the amount of concave or convex profile along the maximum slope (Minar and Evans 2008; Hengl and Reuter 2009). We also performed a cluster analysis of topographic derivatives, such as slope, profile curvature, high-pass filters. Moreover, we tested and compared results in three different ways: (i) by DTM derivatives for automatic features extraction; (ii) DTM and its derivatives as a background for on-screen digitizing; (iii) by traditional cartographic analysis combined with display analysis of orthophotos. The DTM derivatives analysis may need some pre-elaboration pro- cesses—such as a gentle smoothing of the surface or a striping removal—compared to the display analysis on orthophoto and satellite imagery. The profile curvature parameters strongly detect the concave high value of the top of terrace risers, so the reclassification of this parameter lets us identify the top of risers and then convert it into a vector format (shapefile) more suitable for length measure. The first application of this method was made over two different areas, of about 20 km2, in Terragnolo and Cembra valleys (Autonomous Province of Trento) (Fig. 11.1: 3 and 4 respectively). To notice that Cembra Valley LiDAR data were more suitable for an accurate landform analysis due to the non-abandonment status of agricultural terraces, characterized by no high canopy cover on the terraces. On the contrary, in the Val Terragnolo area many agricultural terraces have been abandoned and the
186 |
F. Ferrarese et al. |
Fig. 11.2 Google EarthTM and Street ViewTM show a clearly terraced system in the Vico nel Lazio Municipality (Frosinone Province, Lazio Region). The hot-summer Mediterranean climate and the high resolution of the imagery make the remote survey a quite easy and satisfactory tool
area is now completely re-vegetated by woodland with dense canopy: Here, LiDAR DTM survey allows us to quantify the extension and geometry of terraces but it is hard to detect terraces edges (walls) without extracting together a lot of spurious features. These tests were made by applying surface tools of QGIS 2.8 GIS software.
In the study area of the Brenta Valley (Veneto Region) (Fig. 11.1: 5), we were able to compare the results from a previous survey—which has been made by using traditional cartographic analysis on orthophotos plus field surveys—with the results carried out from LiDAR DTM feature extraction using both ESRI ArcGIS10.2TM and IdrisiGISTM software. It is interesting to note that the use of the traditional
11 Mapping Agricultural Terraces in Italy. Methodologies Applied … |
187 |
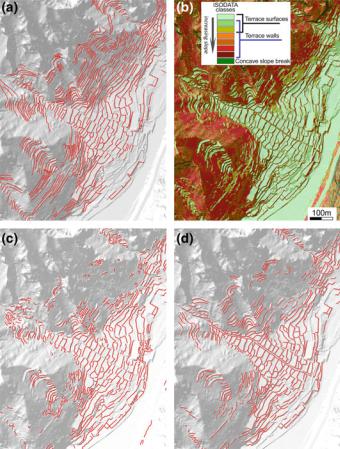
methodology (topographic maps, aerial photos, and field survey) led to the identification of 320 ha of terraced surfaces in comparison with the 317 ha obtained by LiDAR DTM analysis; but, with regard to the dry-stone walls length, we have counted, respectively, 223 against 253 linear kilometers drawn or extracted by GIS analysis (Fig. 11.3): This data comparison highlighted, through the bigger feature density, the capability of LiDAR DTM for more accurate terrace wall identification.
Of course, the width of terraced steps is a fundamental parameter for the identification of these landforms. Narrow terraces, of 1 or few meters, could not be
Fig. 11.3 San Gaetano Village in Brenta Valley (Vicenza Province, Veneto Region) lies in a terraced fan. The traditional survey shows an extensive terraced landscape, while the LiDAR survey locally performed a more accurate result. In a the first survey by aerial photos, maps, and field work: Here, it is to notice the missing of drainage channel walls, not recognized both in the aerial photos and in the map. In b a result of ISODATA routine in IDRISIgisTM to extract eight cluster classes from five DTM derivatives. In c wall features extraction and selection from cluster grouping shown in b. In d the same data of c, refined and completed by means of display analysis on slope

188 |
F. Ferrarese et al. |
detected also by an airborne LiDAR survey (read further in the text). However, aerial photos available for this area were made in spring or summer seasons, with yet a dense canopy cover. In the Brenta Valley area, there are only dry-stone walls, so the landforms extracted are only of this type. On the contrary, in a sample area of 3070 ha in the Fumane Municipality (Province of Verona, Veneto Region) (Fig. 11.1: 6), the traditional methodology, by means of cartography, aerial photo, and field survey, led to the quantification of 86.4 ha of terraced surfaces and 62.9 linear kilometers of dry-stone walls. The LiDAR DTM analysis of this same area was performed both by automatic extraction from profile curvature and from on-screen digitizing, using a background of topographic parameters such slope, hillshading a profile curvature, led to the identification of 1130 and 1104 ha, respectively, with 821 and 578 km of dry-stone walls or different terrace risers. This difference is due to the different target: only dry-stone walls in the first, traditional, survey and all terraced landforms in the LiDAR DTM analysis. The difference, instead, from automatic extraction and on-screen digitizing on LiDAR DTM is due, in this study case, to the capability of automatic extraction to detect a series of narrow and dense terraces (3 m wide), made for recent vineyard cultivation, not detected from the eye of the on-screen digitizing operator.
The automatic LiDAR DTM features extraction was performed also in two famous and wide Italian terraced systems: Costa Viola (Calabria Region, Tyrrhenian seaside) and Gargano Promontory (Puglia Region, Adriatic Sea) (Fig. 11.1: 7 and 8 respectively). The LiDAR DTM data were provided by the
Ministero dell’Ambiente e della Tutela del Territorio e delle Acque, Geoportale Nazionale. It is a 1 or 2 m cell size DTM (2 m for coastal zones) that has high evidence of terraces. In these two areas, the automatic extraction by profile curvature (ESRI ArcGIS10.2TM) and cluster analysis of topographic variables (IdrisiGISTM) produced a similar result, so we focused on the profile curvature reclassification, which is quicker and easier. Moreover, a striping effect in the LiDAR DTM was successfully mitigated applying a directional filter over the polylines carried out from profile curvature reclassification (Table 11.1).
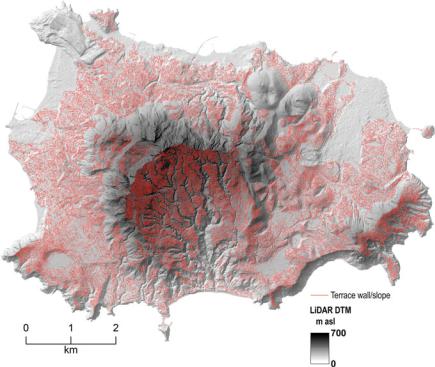
The same method of reclassifying curvature profile was applied to a wide area of the Costiera Amalfitana (Salerno Province, Campania Region) and to the Ischia island (Napoli Province, Campania Region) (Figs. 11.1: 9 and 11.4). In the former case, the narrow terraced surface was locally insufficiently detected from the 2 m cell size DTM. At this moment, we have no other available LiDAR data (such raw data) to try a different interpolation for a new and finer DTM (Brugnaro 2016).
Finally, in the MAPTER project we were able to apply a UAV method. UAV survey of a terraced system was developed in a learning environment context, where the students were involved in geospatial data collection (ground control points and GPS survey) and photogrammetric pre-processing on the field.1 Then,
1A fieldwork survey was organized in March 2016, with a classroom of the Second Level Professional Master in GIScience and Unmanned Aerial Systems for the integrated management of territory and natural resources, University of Padua.

Table 11.1 Results obtained by the on-screen digitizing and by the automatic feature extraction from profile curvature of the DTM in five polygons of Costa Viola terraced landscape (Calabria Region) and in five polygons of the Gargano landscape (Puglia Region)
|
Surface |
Length of dry-stone walls or terrain slopes |
|
|
|
||
|
|
On-screen |
Automatic DTM |
Automatic extraction with |
On-screen |
Automatic DTM |
Automatic extraction with |
|
|
digitizing |
extraction |
directional filter |
digitizing |
extraction |
directional filter |
|
(ha) |
(m) |
(m) |
(m) |
% |
% |
% |
|
|
|
|
|
|
|
|
Costa |
4.96 |
6795 |
64,304 |
5077 |
100 |
94.6 |
74.7 |
Viola 1 |
|
|
|
|
|
|
|
|
|
|
|
|
|
|
|
Costa |
8.17 |
56,313 |
96,572 |
6952 |
100 |
1715 |
1235 |
Viola 15 |
|
|
|
|
|
|
|
|
|
|
|
|
|
|
|
Costa |
842 |
100,539 |
121,293 |
878,640 |
100 |
1206 |
874 |
Viola 43 |
|
|
|
|
|
|
|
Costa |
1103 |
38,252 |
54,714 |
496,980 |
100 |
1430 |
1299 |
Viola 107 |
|
|
|
|
|
|
|
|
|
|
|
|
|
|
|
Costa |
242 |
28,079 |
29,593 |
263,310 |
100 |
1054 |
938 |
Viola 152 |
|
|
|
|
|
|
|
|
|
|
|
|
|
|
|
Gargano 1 |
126 |
6046 |
10,024 |
6085 |
100 |
1658 |
1006 |
|
|
|
|
|
|
|
|
Gargano 6 |
811 |
35,825 |
52,032 |
43,624 |
100 |
1452 |
1218 |
Gargano |
394 |
25,519 |
29,072 |
26,231 |
100 |
1139 |
1028 |
10 |
|
|
|
|
|
|
|
Gargano |
460 |
44,469 |
58,795 |
44,815 |
100 |
1322 |
1008 |
11 |
|
|
|
|
|
|
|
|
|
|
|
|
|
|
|
Gargano |
050 |
4701 |
6620 |
6099 |
100 |
1408 |
1297 |
18 |
|
|
|
|
|
|
|
|
|
|
|
|
|
|
|
These 10 polygons were randomly chosen from a set of 7 polygons for the Costa Viola, and a set of 20 polygons for the Gargano. Every polygon was on-screen digitized and represents a continue terrace system, divided from neighbor systems by morphology landforms (steep valley flanks, scarps). At the on-screen digitizing was given the best result, so that the percentage of the automatic extraction from DTM and the percentage of the same automatic extraction plus the following linear filter are shown in the last three fields. The removing of spurious features due to striping noise often gives a better result. The removing was applied using a directional filter in the set of extracted features
… Applied Methodologies .Italy in Terraces Agricultural Mapping 11
189
190 |
F. Ferrarese et al. |
Fig. 11.4 Ischia Island in front of the Sorrento and Amalfi coasts (Campania Region). The extraction of walls/slope of terraces, by means of the profile curvature reclassification, led to the count of about 1100 km of linear features
a photogrammetric survey was performed in an 8 ha area of the Veneto Region Prealps (Rio Freddo Valley, Vicenza Province, Veneto region) (Fig. 11.1: 10). In this study case, a historical terraced agricultural system was set up in a steep slope of the valley; however, due to the sudden abandonment after the drastic flood of 1966, they were totally re-vegetated by dense deciduous woodlands which made invisible both terraced features and morphology in any recent (post 1970’s) aerial or satellite image. As a result, agricultural terraces were still unmapped in any cartographic representation. A UAV survey was planned and performed in late winter, in order to have less vegetation as possible; therefore, a very high-resolution DTM at 0.05 m cell size was modeled, from stereoscopic aerial photos. Terrain analysis has clearly shown a complex terraced landforms system, generally not involved in drastic degradation processes, which is structured along the southern flank of the valley (Fig. 11.5). This UAV survey methodology highlights the possibility to map, with high accuracy and relatively at low-cost, areas of abandoned agricultural terraces for many purposes such as environmental, agricultural, and hydrogeological monitoring.