

262 |
B. Torquati et al. |
divided into two groups. The first group of actions analyses how a farmer may contribute to the conservation of the olive-growing landscape in the municipality of Trevi by considering the technical and economic characteristics of his/her olive-growing farm. The second group investigates the extent to which a farmer considers it useful to become involved in collective initiatives aimed at the conservation of the olive-growing landscape and rural development of the area. For each action, respondents specified their level of agreement or disagreement on a five-point Likert scale: strongly disagree (0), disagree (1), neutral (2), agree (3), and strongly agree (4).
In more detail, the first group of actions to be taken at farm level has been organized as follows: (1a) reducing production costs; (1b) increasing the selling price of olive oil; (1c) increasing oil yield; (1d) expanding integrated farming production method; (1e) expanding organic olive-growing production method; (1f) establishing a contribution for traditional/marginal olive growing; (1g) introducing premiums for carbon credits; (1h) introducing subsidies for the maintenance of dry-stone walls; (1i) activating an RDP measure to restore dry-stone walls with 100% of funding; and (1j) activating an RDP measure for the recovery of abandoned olive groves with up to 75% of funding.
As for the second group, the following actions were considered: (2a) creating a collective project for the restoration of dry-stone walls; (2b) establishing a cooperative for olive harvesting; (2c) establishing a dry-stone walling school; (2d) encouraging different forms of renting between smaller and leading olive-growing farms; (2e) encouraging active involvement of social cooperatives in the management of olive groves; and (2f) implementing efficient collective marketing policies.
16.4Results and Discussion
The association of each olive-growing parcel with its owner, as well as the combination of spatial and economic information, allowed a detailed reconstruction of the different types of olive-growing farms within the study area.
Marginal olives groves, where the risk of abandonment is greater, cover a total area of 61 ha. Traditional olive growing which ensures lower production costs than marginal olive growing takes up the largest area, corresponding to 520 ha (77% of the total). Intensive olive groves extend over 95 ha (14% of the total). Table 16.4 illustrates the different distributions of the three types of olive growing across farms. Olive producers and olive-growing cooperatives with a single type of olive grove are less numerous: 20 farms contain only marginal olive groves, while 47 only intensive olive groves.
This means that apart from the 47 intensive olive-growing farms, the remaining 88% farms deal with daily issues related to traditional and/or marginal agriculture.
The annual average socio-economic and environmental results are presented in Table 16.5. As for labour demand, the 230,526 olive trees located in the study area require more than 245,000 h of work, while the production amounts to 328,000 kg
16 Economic Analysis of the Traditional Cultural Terraced Olive … |
|
|
|
|
|
263 |
|
Table 16.4 Different types of olive growing across farms |
|
|
|
|
|
|
|
|
|
|
|
|
|
|
|
|
|
Farms |
|
Olive |
|
||
|
|
|
|
|
groves |
|
|
|
|
N. |
|
% |
N. |
|
% |
Marginal olive groves (olive trees/hectare < 204) |
|
20 |
|
5 |
12 |
|
2 |
Traditional olive groves (olive trees/hectare between 204 and 400) |
|
103 |
|
27 |
93 |
|
14 |
Intensive olive groves (olive trees/hectare > 400) |
|
47 |
|
12 |
15 |
|
2 |
Marginal and traditional olive groves |
|
41 |
|
11 |
96 |
|
14 |
Marginal and intensive olive groves |
|
5 |
|
1 |
3 |
|
0 |
Traditional and intensive olive groves |
|
93 |
|
24 |
152 |
|
23 |
Marginal, traditional, and intensive olive groves |
|
51 |
|
13 |
305 |
|
45 |
Other areas |
|
27 |
|
7 |
– |
|
0 |
Total |
|
387 |
|
100 |
676 |
|
100 |
Source Our elaboration |
|
|
|
|
|
|
|
of extra-virgin olive oil for a total cost of €4.4 million (note that these are production costs, including the costs of transforming olives into extra-virgin olive oil, but also the net of dry-stone wall maintenance costs and oil packaging costs). The net sequestration of CO2 equals to 427 tCO2eq.
Economic sustainability, that is, net of CAP premiums, is reached when the revenue is at least equal to estimated production costs. Figures differ according to the type of olive growing. For marginal olive groves, the revenue amounts to approximately €312,000 with a production of more than 18,000 kg of olive oil (estimated selling price of €17.20/kg). For traditional olive groves, it reaches approximately €3.5 million with a production of more than 241,000 kg of olive oil (estimated selling price of €14.30/kg). Intensive olive groves produce more than 68,000 kg of olive oil, generating a revenue of approximately €675,000 (estimated selling price of €9.86/kg).
When the annual average dry-stone wall maintenance costs, estimated at €3.7/ mc, are added, average extra-virgin olive oil selling prices that ensure economic sustainability of the olive groves increase. They are estimated at €20.21/kg for olive oil produced from marginal olive groves and at €15.71/kg for olive oil produced from traditional olive groves.
The current average selling price for 1 kg of unpackaged extra-virgin olive oil produced in the municipality of Trevi is €15. This price can be considered very high if compared with the price of extra-virgin olive oils marketed in Italy. This is mainly the result of PDO certification, which has played a crucial role in promoting the olive oil characteristics linked to its geographical origin, as well as its organoleptic qualities, thus making it recognizable by consumers.
Landscape protection through dry-stone wall restoration and subsequent maintenance is not a common practice among local olive growers, since they already have trouble remunerating factors of production, especially family labour force, at opportunity cost. Not even the 2007–2013 RDP measure for non-productive
264 |
|
|
|
|
|
|
|
B. Torquati et al. |
|||
Table 16.5 Socio-economic characterization of the three different types of olive growing |
|||||||||||
|
|
|
|
|
|
|
|
|
|
|
|
Technical/economic |
Utilised |
Number |
Labour |
Olive oil |
|
Net carbon |
|||||
data |
|
agricultural |
of olive |
force in |
production |
|
sequestration |
||||
|
|
area (ha) |
trees |
olive |
(kg) |
|
|
(tCO2eq) |
|||
|
|
|
|
|
growing |
|
|
|
|
|
|
|
|
|
|
|
(h) |
|
|
|
|
|
|
Marginal olive groves |
61 |
|
13,007 |
17,690 |
18,210 |
|
24 |
|
|||
(olive trees/ |
|
|
|
|
|
|
|
|
|
|
|
hectare < 204) |
|
|
|
|
|
|
|
|
|
|
|
Traditional olive groves |
520 |
|
172,425 |
191,391 |
241,395 |
|
319 |
|
|||
(olive trees/hectare |
|
|
|
|
|
|
|
|
|
|
|
between 204 and 400) |
|
|
|
|
|
|
|
|
|
|
|
Intensive olive groves |
95 |
|
45,094 |
36,075 |
68,543 |
|
83 |
|
|||
(olive trees/ |
|
|
|
|
|
|
|
|
|
|
|
hectare > 400) |
|
|
|
|
|
|
|
|
|
|
|
Other areas |
|
399 |
|
– |
– |
– |
|
|
– |
||
Total |
|
1075 |
|
230,526 |
245,156 |
328,147 |
|
427 |
|
||
Technical/ |
Dry-stone |
Annual cost for |
|
Annual cost |
Annual cost for |
|
|||||
economic data |
wall |
|
olive oil production |
for dry-stone |
olive oil production |
|
|||||
|
restoration |
(olive groves |
|
wall |
|
(olive groves with |
|
||||
|
costs (€) |
without dry-stone |
|
maintenance |
dry-stone walls; €) |
|
|||||
|
|
|
walls; €) |
|
(€) |
|
|
|
|
|
|
Marginal olive |
1,761,804 |
312,168 |
|
55,930 |
|
368,098 |
|
|
|||
groves (olive |
|
|
|
|
|
|
|
|
|
|
|
trees/ |
|
|
|
|
|
|
|
|
|
|
|
hectare < 204) |
|
|
|
|
|
|
|
|
|
|
|
Traditional olive |
17,965,005 |
3,448,495 |
|
344,849 |
|
3,793,344 |
|
||||
groves (olive |
|
|
|
|
|
|
|
|
|
|
|
trees/hectare |
|
|
|
|
|
|
|
|
|
|
|
between 204 and |
|
|
|
|
|
|
|
|
|
|
|
400) |
|
|
|
|
|
|
|
|
|
|
|
Intensive olive |
2,256,512 |
676,410 |
|
– |
|
676,410 |
|
|
|||
groves (olive |
|
|
|
|
|
|
|
|
|
|
|
trees/ |
|
|
|
|
|
|
|
|
|
|
|
hectare > 400) |
|
|
|
|
|
|
|
|
|
|
|
Other areas |
– |
|
– |
|
|
– |
|
– |
|
|
|
Total |
21,983,320 |
4,437,073 |
|
204,436 |
|
4,641,508 |
|
||||
Source Our elaboration
investments, which provided non-repayable grants of 80% of the cost incurred, succeeded in stimulating the restoration of dry-stone walls. Yet, they can be found in around 340 ha of the olive-growing study area. More specifically, they are located in 45% of the area covered by marginal olive groves and in 50% of the area covered by traditional olive groves. With an average presence of 161 mc of dry-stone walls per hectare of olive grove, we estimated a total of 55,000 mc of dry-stone walls. With a restoration percentage of 100% and an estimated cost of €400/mc, this would mean an overall investment of €22 million.
16 Economic Analysis of the Traditional Cultural Terraced Olive … |
265 |
The main weakness in the conservation of the olive-growing landscape clearly lies in the profitability level of olive oil production and sale. This adds up to farms being slowly, yet inevitably, transferred to the next generation. Despite being aware of the value and opportunities offered by the conservation of this ‘cultural landscape’, new generations do not share the same knowledge, skills, and commitment of their previous generation. Therefore, contractors increasingly provide farming and landscape maintenance interventions. This entails a series of issues, among which are difficulty finding appropriately trained workers and an inevitable rise in costs. Costs are therefore less and less offset by revenues, even though they are substantial, since olive oil is sold at a higher price and marketed as a high-quality and unique product.
The ownership structure is instead one of the most valuable in the conservation of the olive-growing landscape. On the one hand, the highly fragmented ownership of agricultural land, which is divided into small plots, has allowed local people to grow olive trees as a side occupation, driven by strong attachment to this species. On the other hand, the small extension has ensured rational use of resources and sufficient penetration of some rich niche markets. Furthermore, as already underlined, PDO certification has played a crucial role in making olive oil recognizable by consumers.
However, nowadays, different types of PDO olive oils are sold at reasonable prices under commercial labels in supermarkets, thus making it necessary to move beyond PDO certification and develop new ways to strengthen the relationship between products, production areas, and local people.
Possible actions and proposals formulated and discussed during meetings with stakeholders have been variously assessed by olive growers who were given the survey questionnaire. The direct survey involved 10 olive growers who together cultivate 35% of the olive-growing study area. The results, presented in Table 16.6, show that, according to respondents, conservation of the olive-growing landscape depends on the introduction of premiums for dry-stone wall maintenance and on the activation of an RDP measure for the restoration of dry-stone walls with 100% funding, both at the farm level and, on implementation of efficient collective marketing policies, at the territorial level.
At the farm level, great importance is given to the activation of an RDP measure for the recovery of abandoned olive groves with up to 75% of funding, as well as for the increase in the selling price of extra-virgin olive oil. Moreover, further efforts should be made to reduce production costs, as it would be desirable to establish a contribution for marginal and traditional olive growing and to introduce premiums for carbon credits. At the territorial level, collective projects for the restoration of dry-stone walls with the establishment of a dry-stone walling school are not considered particularly relevant.
At the farm level, less importance is given to actions related to farming and production methods and to the increase of oil yield. At the collective level, there is certain opposition to the establishment of a cooperative for olive harvesting and to the involvement of social cooperatives.

266 |
B. Torquati et al. |
Table 16.6 Results from the participatory planning process
First question: With reference to your farm, do you think these actions are effective to ensure the olive groves landscape in the municipality of Trevi?
Answers to the first question |
Average |
|
value |
Introduce bonuses for dry-stone wall maintenance |
3.4 |
Activate an RDP measure to restore dry-stone walls with 100% public cost |
3.2 |
contribution |
|
Activate measures improving the restoration to avoid olive grove degradation |
2.8 |
when abandoned, supporting up to 75% of the measure |
|
Increase olive oil price |
2.6 |
Reduce production costs |
2.4 |
Provide a contribution for traditional/marginal olive growing |
2.4 |
Introduce premiums for carbon credits |
2.4 |
Improve organic production methods |
1.8 |
Increase the olive oil yield |
1.6 |
Improve the integrated farming production method |
1.2 |
Second question: Regarding the olive groves area in the municipality of Trevi, do you think these actions could be useful to ensure olive-growing conservation and rural area development?
Answers to the second question |
Average |
|
value |
Implement efficient collective marketing policies |
3.2 |
Develop a collective dry-stone wall restoration project |
2.4 |
Establish a school where it is possible to learn how to build and restore dry walls |
2.4 |
Encourage different forms of renting between smaller olive farms and leading |
1.8 |
olive farms |
|
Establish a cooperative for olive harvesting |
1.6 |
Encourage social cooperatives to have an active role in olive grove management |
1.4 |
Source Our elaboration
Note The interviewee can answer: not at all (0), little (1), rather (2), very (3), or extremely (4)
Building upon the results of the direct survey, we focused on the olive-growing area, where the risk of abandonment is greater, and we tried to identify and assess the most appropriate actions and measures to be taken. This area was extracted from the database by selecting olive-growing parcels with a density of less than 400 trees per hectare, located above 400 m above the sea level, with a slope higher than 20%, and with dry-stone walls.
Using these parameters, 42 parcels belonging to 28 farms in a total area of 31 ha were extracted. Out of the total 31 ha, 3 are occupied by marginal olive groves, while traditional olive-growing covers 28 ha (the spatial distribution of olive groves can be seen in Fig. 16.2).
It should be noted that the selected parcels belong to farms in which the extension of the olive-growing area differs greatly (from 69 to 0.37 ha). Similarly,
16 Economic Analysis of the Traditional Cultural Terraced Olive … |
267 |
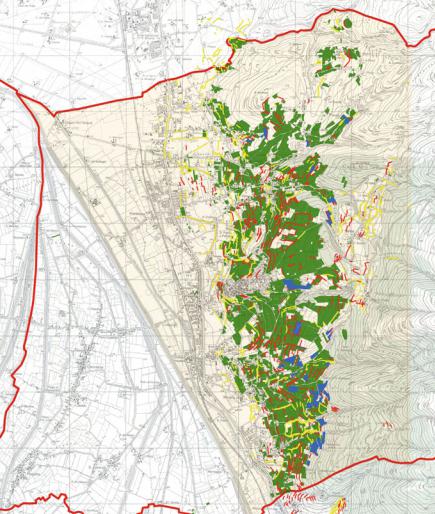
Fig. 16.2 Olive-growing area in 2012 with the position of dry-stone walls (coloured in red), slopes (coloured in yellow), and the olive-growing areas that are potentially more vulnerable to abandonment (areas in blue). Source Our elaboration
the weight of olive groves that are potentially more vulnerable to abandonment varies (from 1 to 100%). This confirms that olive-growing abandonment is a phenomenon that is spreading across several farms, in which it carries a different weight.
Public intervention in the area would entail an investment of approximately €1 million for the restoration of dry-stone walls, assuming a restoration percentage of 50%, plus €22,000 for their maintenance, corresponding to €1.5 for each kg of