

SPE-159904-MS
.pdfSPE 159904 |
11 |
|
|
Fig. 11—Proposed shale reservoir interpretation workflow when a complete logging suite is available.
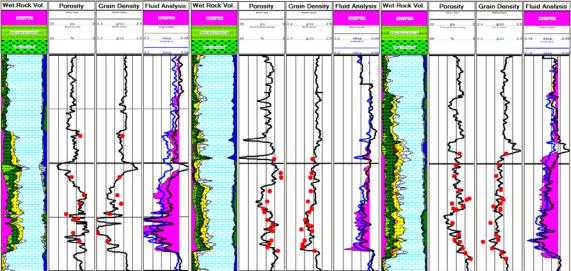
Fig. 12—Comparison of interpretations for all three wells. From left to right, Well 1, Well 2, and Well 3.
Fig. 12 presents the results for all three wells. Tracks 1, 4, and 5 present the mineralogy obtained from the geochemical well log data. Fluid analysis is presented in Tracks 2, 5, and 8, where the kerogen volume is denoted by magenta shading. The yellow curve in these tracks is the NMR porosity. Tracks 3, 6, and 9 compare the predicted water saturations to core data. Fig. 13 continues displaying the results for three wells and shows the comparison to core porosity in Tracks 2, 6, and 10, and shows the comparison to core grain density in Tracks 3, 7, and 11. Tracks 4, 8, and 12 compare the interpreted kerogen with that obtained from cross-plot porosity minus NMR porosity (blue curve) and density porosity minus NMR porosity (black curve). The results between the three wells are consistent and agree with core data.
12 |
SPE 159904 |
|
|
Fig. 13—Comparison of interpretations for all three wells and comparison to core porosity and grain density. From left to right, Well 1, Well 2, and Well 3.
The workflow proposed in Fig. 11 provides a robust method for evaluating the quality of a shale reservoir. Used in conjunction with sonic logs and rock mechanical properties, fracture simulators can be used to optimize fracture treatment design. Thus, the lateral placement can be determined to maximize production.
Conclusions
In shale reservoirs, the petrophysical evaluation components performed by the petrophysicist extend beyond the traditional formation evaluation and also include a geochemistry component. Generally, there will be large variations in the mineralogy, as shown in Fig. 2. This causes the grain density to have significant variation. This paper has shown that wireline geochemical logs can be effectively used to predict an accurate grain density, even when there are large variations in mineralogy and total organic carbon. The resulting mineral volumetric fractions (including kerogen) can also be used to compute, at each depth, the square root of an apparent complex matrix dielectric constant.
Dielectric measurements provide an alternative to micro-resistivity logs, and in tight shale plays with no invasion, an alternative to deep resistivity logs providing a high-resolution water saturation Sw because in this case, Sw ~ Sxo. The CRIM equation was effectively applied in an Eagle Ford Shale well to solve for dielectric water-filled porosity.
NMR measurements have also been shown to have value when incorporated into both gas and oil shale reservoir interpretations where there are minimal hydrogen index and polarization effects. The NMR porosity provides a minimal porosity constraint in an integrated petrophysical interpretation. When the crossplot porosity is normalized such that it overlays the NMR porosity in zones devoid of kerogen and hydrocarbon, the difference between crossplot porosity and NMR porosity is a good prediction of the kerogen volume. In addition, the difference between the NMR porosity and dielectric
apparent water-filled porosity, φwaterCRIM , is a lower bound on the volume of hydrocarbon.
Three Eagle Ford Shale wells demonstrated the value of an integrated interpretation using conventional logs, geochemical, dielectric and NMR logs.
Nomenclature |
|
TOC |
= total organic carbon |
Ro |
= vitrinite reflectance, % |
R |
= formation resistivity, Ω-m |
φ= total porosity, pu
φDensity |
= density porosity, pu |
φxplot |
= density-neutron cross-plot porosity, pu |
φNMR |
= NMR total porosity, pu |
φwaterCRIM |
= apparent water-filled porosity from CRIM, pu |
φDielectric |
= dielectric water-filled porosity, pu |
water |
|
Sw |
= water saturation, % |
Sxo |
= flushed-zone water saturation, % |
ε* |
= complex dielectric constant |
ε’ |
= real dielectric constant |
SPE 159904 |
13 |
|
|
ε’’
ε*for
εmatrix*
εHC*
εmf*
εi*
ρ
ρgrain_density
ρmin-i
ρkerogen
Vi
Vkerogen Vhydrocarbon Wmin-i
Wkerogen
c j
=imaginary dielectric constant
=measured complex dielectric constant
=matrix complex dielectric constant
=complex dielectric constant of hydrocarbon
=complex dielectric constant of water in the zone investigated by the dielectric tool
=complex dielectric constant of mineral, i
=density, g/cc
=grain density, g/cc
=density of mineral, i, g/cc
=density of kerogen, g/cc
=volume fraction of mineral, i
=kerogen volume, pu
=hydrocarbon volume, pu
=bulk dry-rock weight fraction of mineral, i
=bulk dry-rock weight fraction of kerogen
=normalizing constant, adjusted so that cross-plot and NMR porosities overlay in hydrocarbon-free zones
=counter for number of core samples
Acknowledgements
The authors wish to thank the management team of Halliburton Energy Services for granting the permission to develop and publish the content of this paper. We also express our appreciation to the respective technical review group whose input has helped to produce the final document.
References
Bittar, M., Li, J., Kainer, G., et al. 2010. A modern microwave formation evaluation sensor and its applications in reservoir evaluation. Paper B presented at the 51st Annual Logging Symposium, Perth, Australia, 19–23 June.
Dawson, W.C. 1997. Limestone microfacies and sequence stratigraphy: Eagle Ford Group (Cenomanion-Turomian) north-central Texas outcrops. Gulf Coast Association of Geological Societies Transactions 47 99–105.
Dawson, W.C. 2000. Shale microfacies: Eagle Ford group (Cenomanion-Turomian) north-central Texas outcrops and subsurface equivalents. Gulf Coast Association of Geological Societies Transactions 50 607–622.
Galford, J., Truax, J., Hrametz, A., et al. 2009a. A new neutron-induced gamma-ray spectrometry tool for geochemical logging. Paper X presented at the 50th Annual SPWLA Logging Symposium, Houston, Texas, 21–24 June.
Galford, J., Quirein, J., Shannon, S., et al. 2009b. Field test results of a new neutron-induced gamma-ray spectrometry geochemical logging tool. Paper SPE 123992 presented at the SPE Annual Technical Conference and Exhibition, New Orleans, Louisiana, 4–7 October. http://dx.doi.org/10.2118/123992-MS.
Grabowski, G.J., Jr. 1995. Organic-rich chalks and calcareous mudstones of the Upper Cretaceous Austin Chalk and Eagle Ford Formation, south-central Texas, U.S.A., in B. Katz, ed., Petroleum Source Rocks: New York, Springer-Verlag, p. 209–234.
Herron, M.M., Grau, J.A., Herron, S.L., et al. 2011. Total organic carbon and formation evaluation with wireline logs in the Green River oil shale. Paper SPE 147184 presented at the SPE Annual Technical Conference and Exhibition, Denver, Colorado, 30 October–2 November. http://dx.doi.org/10.2118/147184-MS.
Liro, L.M., Dawson, W.C., Katz, B.J, et al. 1994. Sequence stratigraphic elements and geochemical variability within a “condensed section”: Eagle Ford Group, east-central Texas. Gulf Coast Association of Geological Societies Transactions 44 393–402.
Passey, Q.R., Creaney, S., Kulla, J.B., et al. 1990. A practical model for organic richness from porosity and resistivity logs. AAPG Bulletin 74 (12): 1777-1794.
Ramirez, T.R., Klein, J.D., Bonnie, R.J.M., et al. 2011. Comparative study of formation evaluation methods for unconventional shale-gas reservoirs: application to the Haynesville shale (Texas). Paper SPE 144062 presented at the SPE North American Unconventional Gas Conference and Exhibition, The Woodlands, Texas, 14–16 June. http://dx.doi.org/10.2118/144062-MS
Robinson, C.R. 1997. Hydrocarbon source rock variability within the Austin Chalk and Eagle Ford Shale (Upper Cretaceous), East Texas.
International Journal of Coal Geology 34 287–305.
Schmitt, D.P., Al-Habra, A., Saldungaray, P., et al. 2011. Revisiting dielectric logging in Saudi Arabia: recent experiences and applications in development and application wells. Paper SPE 149131 presented at the SPE/DGS Saudi Arabia Section Technical Symposium and Exhibition, Al-Khobar, Saudi Arabia, 15–18 May. http://dx.doi.org/10.2118/149131-MS
Seleznev, N.V., Kleinberg, R.L., Herron, M.H., et al. 2011. Applications of dielectric dispersion logging to oil shale reservoirs. Paper G presented at the SPWLA 52nd Annual Logging Symposium, Colorado Springs, Colorado, 14–18 May.
Sigal, R.F. and Odusina, E. 2011. Laboratory NMR measurements on methane saturated Barnett Shale samples. Petrophysics 52 (1): 32-49.