

SPE-131350-MS
.pdfSPE 131350
From Oil-Prone Source Rock to Gas-Producing Shale Reservoir – Geologic and Petrophysical Characterization of Unconventional Shale-Gas Reservoirs
Q.R. Passey, K.M. Bohacs, W.L. Esch, R. Klimentidis, and S. Sinha, ExxonMobil Upstream Research Co.
Copyright 2010, Society of Petroleum Engineers
This paper was prepared for presentation at the CPS/SPE International Oil & Gas Conference and Exhibition in China held in Beijing, China, 8–10 June 2010.
This paper was selected for presentation by a CPS/SPE program committee following review of information contained in an abstract submitted by the author(s). Contents of the paper have not been reviewed by the Society of Petroleum Engineers and are subject to correction by the author(s). The material does not necessarily reflect any position of the Society of Petroleum Engineers, its officers, or members. Electronic reproduction, distribution, or storage of any part of this paper without the written consent of the Society of Petroleum Engineers is prohibited. Permission to reproduce in print is restricted to an abstract of not more than 300 words; illustrations may not be copied. The abstract must contain conspicuous acknowledgment of SPE copyright.
Abstract
Many currently producing shale-gas reservoirs are overmature oil-prone source rocks. Through burial and heating these reservoirs evolve from organic-matter-rich mud deposited in marine, lacustrine, or swamp environments. Key characterization parameters are: total organic carbon (TOC), maturity level (vitrinite reflectance), mineralogy, thickness, and organic matter type. Hydrogen- to-carbon (HI) and oxygen-to-carbon (OI) ratios are used to classify organic matter that ranges from oil-prone algal and herbaceous to gas-prone woody/coaly material.
Although organic-matter-rich intervals can be hundreds of meters thick, vertical variability in TOC is high (<1-3 meters) and is controlled by stratigraphic and biotic factors. In general, the fundamental geologic building block of shale-gas reservoirs is the parasequence, and commonly 10’s to 100’s of parasequences comprise the organic-rich formation whose lateral continuity can be estimated using techniques and models developed for source rocks.
Typical analysis techniques for shale-gas reservoir rocks include: TOC, X-ray diffraction, adsorbed/canister gas, vitrinite reflectance, detailed core and thin-section descriptions, porosity, permeability, fluid saturation, and optical and electron microscopy. These sample-based results are combined with full well-log suites, including high resolution density and resistivity logs and borehole images, to fully characterize these formations. Porosity, fluid saturation, and permeability derived from core can be tied to log response; however, several studies have shown that the results obtained from different core analysis laboratories can vary significantly, reflecting differences in analytical technique, differences in definitions of fundamental rock and fluid properties, or the millimeter-scale variability common in mudstones that make it problematic to select multiple samples with identical attributes.
Porosity determination in shale-gas mudstones is complicated by very small pore sizes and, thus, large surface area (and associated surface water); moreover, smectitic clays that are commonly present in mud have interlayer water, but this clay family tends to be minimized in high maturity formations due to illitization. Finally, SEM images of ion-beam-milled samples reveal a separate nanoporosity system contained within the organic matter, possibly comprising >50% of the total porosity, and these pores may be hydrocarbon wet, at least during most of the thermal maturation process. A full understanding of the relation of porosity and gas content will result in development of optimized processes for hydrocarbon recovery in shale-gas reservoirs.
Introduction/Background
The term “unconventional reservoirs” covers a wide range of hydrocarbon-bearing formations and reservoir types that generally do not produce economic rates of hydrocarbons without stimulation. Common terms for such “unconventional” reservoirs include: Tight-Gas Sandstones, Gas Hydrates, Oil Shale formations, Heavy Oil Sandstones, and Shale Gas, among others. The focus of this paper is to discuss the geological genesis and characterization of the class of “unconventional” reservoirs commonly termed Shale Gas.
Shale is a term that has been applied to describe a wide variety of rocks that are composed of extremely fine-grained particles, typically less than 4 microns in diameter, but may contain variable amounts of silt-size particles (up to 62.5 microns). In
2 |
SPE 131350 |
|
|
comparison, sandstones are rocks composed of grains (of variable composition) that are typically between 62.5 microns and 2000 microns in diameter. Just as sandstones can be composed of different mineral grains (e.g., quartz, feldspar, rock fragments, clays, etc.), shales (more properly referred to as mudstones) also exhibit a wide range in composition (clay, quartz, feldspar, heavy minerals, etc.). Moreover, the composition of a “typical” mudstone will vary much more than for typical sandstones, even though to the naked eye, many mudstones (i.e., shales) look similar.
Depositional and Geologic Controls on Organic Richness
Recent studies indicate that although these organic-matter-rich mudstone formations may be hundreds of meters in gross thickness (and may appear largely homogeneous), the vertical variability in the organic richness can vary on relatively short vertical scales (often much less than 1 meter; e.g., Bohacs, 1998; Bohacs et al., 2005; Guthrie and Bohacs, 2009). The vertical heterogeneity observed can be directly tied back to geologic and biotic conditions when deposited; keep in mind that these fine-grain sediments are deposited very slowly and with subsequent compaction and lithification, a 1 meter thick interval of rock may represent thousands to millions of years of time. In essentially all organic-rich mudstones, the basic building blocks conform to wellunderstood stratigraphic controls and architectures. The basic unit can been described as a parasequence (an upward shoaling package of genetically related beds and bedsets) or its equivalent. This depositional pattern is commonly repeated dozens of times, stacked into parasequence sets and ultimately bounded by sequence boundaries. The rigorous characterization of these packages allows for the understanding and exploration of the best intervals.
 Parasequences
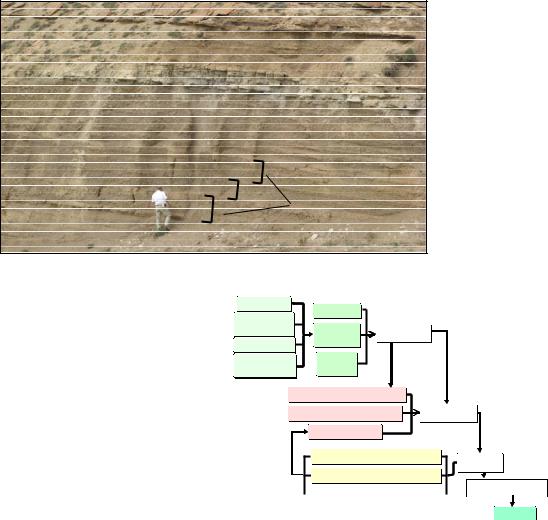
Figure 1 - Outcrop of Green River Shale, Luman Tongue, Hiawatha Section. Green River Basin, Wyoming, USA. illustrating the occurrence of 1-2 meter thick parasequences, which are the primary building blocks of organic-matter-rich packages.
The accumulation of organic-matter-rich rocks (ORRs) is a complex function of many interacting processes (as discussed more fully in Bohacs et al., 2005). Successful prediction requires the integration of plate tectonics, geodynamics, and basin structural development with reconstructions of paleo-environmental conditions as the context for process-based models for the occurrence, distribution, and character of potential source rocks or shalegas reservoirs. Organic-matter accumulation in depositional environments is controlled by complex, non-linear interactions of three main proximate control variables: rates of production, destruction, and dilution. Significant enrichment of organic matter occurs where organic-matter production is maximized, destruction is minimized, and dilution by clastic or biogenic material is optimized, in an area with sufficient accommodation rates to accumulate significant thickness of sediments. The main factors and interactions are illustrated in the following paragraphs.
Upwelling |
Water--Mass
Mixingi
Riverr Influxfl
Evaporativer ti Crossss Flow
Sunlightt |
|
Nutrientt |
Production |
Supply |
|
Waterr
Supply
Consumerr Populationl tion |
|
Oxidant Supply Rate |
Destruction |
Buriall Rate |
|
Clastictic Supply Rate |
Dilution |
|
|
Biogenicic Supply Rate |
|
|
|
|
|
Accommodation |
|
Chemicall Supply Rate |
|||
|
|
|
|
|
|
|
|
|
ORR |
Figure 2 - Controls on organic-richness highlighting the interconnected nature of the processes of organic production, destruction, and dilution and the factors that influence them.
SPE 131350 |
3 |
|
|
Production: Organic production provides the raw material upon which an ecosystem acts. Its primary proximate controls are the supply rates of solar energy, nutrients, and water. Equations 1a, and 1b indicate the relations among nutrient input and population growth of various organism classes: primary producers that generate organic-carbon rich material, and secondary consumers such as radiolaria that provide brittle material (e.g., silica). As the equations illustrate, population growth rates are quite different among these two classes of organisms because of their reproductive strategies and limits of ecosystem capacity. Both are, however, ultimately influenced by nutrient supply and solar energy input through both r, the inherent growth rate of the organism and K, the carrying capacity of the ecosystem. The equations also indicate some of the interconnections among production, destruction, and dilution illustrated in Figure 2-- nutrients are supplied to an ecosystem by the same water circulation processes that can carry destruction-enhancing oxidants, dilution-enhancing clastics, and suspended sediment that can block sunlight, decreasing production.
Production is, therefore, seldom sufficient by itself to generate significant organic accumulations because both very low and very high rates of production are detrimental to accumulations of ORR: very low rates cannot keep up with rates of destruction by consumer organisms and very high rates lead to significant dilution by non-hydrogen-rich biogenic material (tests, shells, bones; e.g., Monterey Formation and Mowry Formation examples in Bohacs et al., 2005— see also discussion in Tyson 1995). This effect is particularly significant in strata younger than Early Jurassic because of the evolutionary radiation of coccolithophores (calcareous primary producers) and is exacerbated in high-production regimes since the Late Cretaceous with the emerging dominance of diatoms (siliceous primary producers -- e.g., Berger 1976; Bogdanov et al. 1980a; Tada 1991). Organic accumulation in the rock record appears to be optimized at intermediate rates of primary organic production (e.g., Strakhov 1971; Brumsack 1980; Summerhayes and Masran 1983; Isaacs 1987; Bogdanov et al. 1980b; Schwalbach et al. 1993; Tyson 1995, 2001).
EQUATION 1a: Production rate relation for primary producers of organic carbon (‘r-controlled’, generalist organisms). Key factors are previous population size (No, a function of nutrient supply history) and inherent organism growth rate (r).
∂P = No e−rt
∂t
EQUATION 1b: Production rate relation for secondary consumers that can supply such brittle biogenic material as silica (‘K-controlled’, specialist organisms). Key factors are also previous population size (No, a function of nutrient supply history-- mostly the primary producers governed by Equation 1a) and inherent organism growth rate (r), as well as the carrying capacity of the ecosystem (K), itself a function of nutrient supply and oxygen supply (see Equation 2a), among other factors.
∂P |
= |
KNo |
∂t |
(K − No )e−rt + No |
Destruction: Organic-matter destruction occurs through ingestion by metazoans, microbial respiration, and inorganic oxidation (Equations 2a and 2b). Most organic matter is consumed within the photic zone; typically less than 10% escapes these upper 50 to 100 meters of the water column. Most of the organic matter that reaches the sea floor is consumed by metazoans and microbes in the upper decimeters of the sediment column. Destruction processes are distinctly threshold governed—for example, metazoan organisms are excluded only below certain oxygen concentrations (e.g., Savrda and Bottjer 1986, 1991). As Equation 2a indicates there are numerous oxidant species that can degrade organic matter (oxygen, sulfate, nitrate, iron, etc.).
The key factor for preservation of organic matter is maintenance of low oxidant concentrations in the sediment pore-water system, through restricted advection of oxidants in the water column and diffusion through shallow sediments. Burial rates must also be sufficiently fast to limit oxidant exposure times and move organic matter out of the shallow zone below the sea floor of most active degradation and oxidant resupply relatively quickly (e.g., Hartnett et al. 1998). As Figure 2 illustrates, the optimal burial rate includes the accumulation of both inorganic and organic material, so estimates of organic-matter destruction must factor in both primary production of hydrogen-poor biogenic material (along the lines of Equation 1b) and dilution by hydrogen-poor clastic material (see Equation 3a).
EQUATION 2a: Oxidation and respiration component of destruction rate: Oxidant level is a function of the relative magnitude of advected and diffused oxidant supply rates versus oxidant utilization by organic matter degradation:
∂O |
|
|
∂O ∂O |
|
∂O |
|
n |
∂η |
|
∂η |
||||
∂t |
= u |
∂x |
+ v |
∂y |
+ w |
∂z |
+ ∑Oi |
∂t |
+ Oi |
∂z |
− O |
|||
|
|
|
|
i=1 |
|
|
|
|||||||
|
|
|
|
|
|
|
|
|
|
|
|
|
|
|
= advection of oxidants + diffusion of oxidants – local oxidant consumption

4 |
SPE 131350 |
|
|
EQUATION 2b: Functional form of secondary consumer component of destruction rate for specific pairs of consumer and producer organisms-- population growth rate of secondary consumers is a function of the growth rate of primary producers, previous population size, and carrying capacity of the ecosystem:
∂P |
|
KNo |
|
|
− [Noe |
−rt |
] |
|
|
= |
|
|
|
|
|
||
∂t |
(K − No )e |
−rt |
|
|
||||
|
|
+ No |
|
|
|
|||
= secondary consumer growth – primary producer growth
Dilution: Organic-matter-rich rocks require a critical concentration of organic matter to function as effective hydrocarbon sources or shale-gas reservoirs. Dilution of organic matter by material that is not hydrogen rich is the predominant control on significant accumulations of organic matter because it has the widest range of mass-accumulation rates and grain size variations (Bohacs et al., 2005). Dilution can be by either clastic or biogenic material or both (Equations 1a, 1b, 3a, and 3b). Equation 3a indicates that clastic dilution (in terms of sediment flux rates) is non-linear and threshold governed -- most sensitive to shear stress ( flow velocity and depth) above the critical value for initiating and maintaining sediment motion. Hence, it is apparent that flow velocities are a key factor in the accumulation of organic matter -- it very strongly controls dilution, as well as affecting the advection of nutrients, suspensates, and oxidants for production and destruction. The threshold velocity for sediment movement is a function of grain size and its density relative to that of the transporting medium. This relation is reasonably accurate for cohesionless grains under traction transport, but each of these attributes vary significantly in mud-dominated systems— although much mud is transported as aggregates or floccules, their size and density range widely and change during transport (e.g., Schieber et al., 2007). Significant volumes of mud are also carried in suspension that changes the density of the transporting fluid and follow a different transport relation ( suspended sediment concentration and bottom slope; e.g., van Rijn, 1984). A significant factor in the formation and stability of mud aggregates is the presence and concentration of organic matter, especially extracellular polysaccharides that are effective binding agents (Passow et al., 1994; Logan et al., 1995). Consuming organisms also ingest and ‘package’ mud-sized material into sand-sized pellets (e.g., Grossart et al., 1997). Thus organic-matter production and destruction rates influence the partitioning and interchange between bed-load and suspended load transport of diluting mud as well as the size and persistence of mud aggregates/floccules ( transport rate).
Production of biogenic non-hydrogen-rich material can also be a significant factor in dilution. High biogenic dilution rates can produce relatively organic-lean, but brittle rocks in distal, low-advection environments (e.g., Monterey Formation, Mowry Shale). Low dilution rates are a necessary, but seldom sufficient condition for organic accumulation. There is an optimal rate of sediment accumulation that maximizes the portion of organic carbon that is preserved through early degradation during shallow burial (or the “burial efficiency” of Heinrichs and Reeburgh 1987). In Equation 2a, it is the accumulation of a sufficient thickness of relatively impermeable mud that limits diffusion of oxidants from the overlying water mass (Oi ∂η/∂z).
EQUATION 3a: Sediment transport relation indicating the functional form of cohesionless siliciclastic dilution processes (after Wong and Parker, 2006):
|
|
|
|
ρ s − ρ |
|
|
|
|
|
|
|
τ − τ c |
|
3/ 2 |
|
|
qs = |
|
D |
gD |
|
|
|
|
|
|
|
|
|||||
|
|
|
|
|
|
|||||||||||
|
|
ρ |
|
|
* 4 |
( |
ρ |
|
− ρ |
)gD |
||||||
|
|
|
|
|
s |
|
||||||||||
|
|
|
|
|
|
|
|
|
|
|
|
|
|
|
|
|
= resistance of particle to motion * fluid shear stress in excess of threshold of motion EQUATION 3b: Population net growth relation indicating functional form of biogenic dilution processes:
∂P |
= μ (N, I )− mP −ν |
∂P |
+ κ |
∂ 2 P |
∂t |
|
∂z |
|
∂z 2 |
= phytoplankton growth rate - consumption - sinking + mixing
When or where clastic input is the primary control on organic-matter content, the vertical distribution of TOC can be indicative of either individual parasequences, or of parasequence sets reflecting an overall progradation or transgression within a sequence. In these settings (commonly relatively proximal to shoreline), the vertical profile of TOC, either measured on closely spaced samples or estimated from well logs, provides an excellent proxy for identification of parasequences (or parasequence sets) as illustrated in Figure 3. In this situation, the characteristic “high TOC at the base, decreasing upward” signature of parasequences is readily identified (Creaney and Passey, 1993) and is useful for stratigraphic correlation as part of estimating resource distribution, as
SPE 131350 |
5 |
|
|
discussed in the following section.
TOC wt%
0 |
2 |
4 |
6 |
8 |
10 |
12 |
100 |
|
|
|
|
|
|
80 |
Member |
|
|
|
|
|
60 |
|
|
|
|
|
|
|
|
|
|
|
|
|
40 |
Springs |
|
|
|
|
|
|
|
|
|
|
|
|
20 |
Sharon |
|
|
|
|
|
0 |
|
|
|
|
|
|
|
|
|
|
|
|
|
-20 |
|
|
|
|
|
|
-40 |
|
|
|
|
Member |
|
|
|
|
|
|
|
|
-60 |
|
|
|
|
Pierre |
|
|
|
|
|
|
|
|
-80 |
|
|
|
|
Lower |
|
|
|
|
|
|
|
|
-100 |
|
|
|
|
|
|
|
|
|
a |
|
|
|
|
1280 |
Gamma Ray |
|
|
|
|
|
|
|
||
|
1285 |
|
|
|
|
(m) |
1290 |
|
|
|
|
|
|
|
|
|
|
Depth |
1295 |
|
|
|
|
|
|
|
|
|
|
|
1300 |
|
|
|
|
|
1305 |
|
|
|
|
|
1305 |
|
|
|
|
|
|
|
Nordegg Formation |
|
|
|
0 |
5 |
10 |
15 |
20 |
TOC (wt%)
b
Lithology/grainsize
|
|
|
|
|
|
|
1285.72 |
Nordegg |
Formation |
|
|
1287.08 |
|||
|
|
1288.44 |
|||||
|
|
|
|
|
|
|
|
|
|
|
|
|
|
|
1289.8 |
|
|
|
|
|
|
|
1291.16 |
|
|
|
|
|
|
|
1292.52 |
|
|
|
|
|
|
|
1293.88 |
|
|
|
|
|
|
|
|
|
|
|
|
|
|
|
1295.24 |
|
|
|
|
|
|
|
|
|
|
|
|
|
|
|
1296.6 |
|
|
|
|
|
|
|
1297.96 |
|
|
|
|
|
|
|
1299.32 |
|
|
|
|
|
|
|
1300.68 |
|
|
|
|
|
|
|
|
|
|
|
|
|
|
|
|
|
|
|
|
|
|
|
1302.04 |
|
|
|
|
|
|
|
|
|
|
|
|
|
|
|
1303.4 |
|
|
|
|
|
|
|
1304.76 |
|
|
|
|
|
|
|
|
c-vc SS |
vf-m SS |
Siltstone |
muddy sltst |
Muddy sltst |
Silty ms |
Sl. silty ms |
Mudstone |
|
|
|
Sl |
|
|
|
|
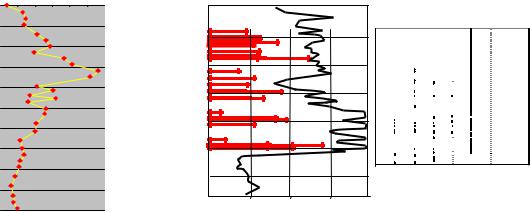
Figure 3 - a) Measured TOC profile indicating parasequence-set -scale stacking patterns of TOC in the Sharon Springs member of the Pierre Shale, Oral, South Dakota, USA. Note variations even in the interval of higher TOC values. (vertical scale in feet) b) Measured TOC profiles with grain size from core indicate high vertical variability within an overall organic-rich interval in the Nordegg formation in Alberta, Canada. The gamma-ray scale is 0 to 150 GAPI.
Interaction of processes: Although organic-matter enrichment can be expressed as a relatively simple relation, it is quite complex in detail because of the interdependencies of the variables:
Organic-matter enrichment = Production – (Destruction + Dilution)
where: Production = f(Nutrient supply), Destruction = f(Production of organic matter) + f(Oxidant exposure time) – f(Clastic sedimentation rate < burial-efficiency threshold), and Dilution = f(Clastic sedimentation rate > burial-efficiency threshold) + f(Production of biogenic silica or carbonate relative to protoplasm) (Bohacs et al., 2005). As the system of Equations 1, 2, and 3 indicate, the accumulation of organic matter is ultimately the result of competing rates: it is essential to produce organic matter faster than it is consumed or oxidized. Observations of many organic-matter-rich rocks ranging in age from Cambrian to Recent indicate that ORRS accumulate in a variety of settings and result from appropriate combinations among competing rates of production, destruction, and dilution of organic matter (e.g., Potter et al. 1980; Arthur et al. 1987; Huc 1988, 1995; Katz and Pratt 1993; Ricken 1993; Schwarzkopf 1993; Tyson 1995, 2001; Bohacs 1990, 1998; Werne et al. 2002). There are many combinations that can yield rocks enriched in organic material, especially for moderately rich potential source rocks that can serve as shale-gas reservoirs (Bohacs et al., 2005, their Table 1).
Stratigraphic Variations of Shale-Gas Reservoir Potential at Sequence and Parasequence Scales
Even within an overall background of favorable conditions for accumulation of organic matter, the properties and distribution of potential source rocks vary systematically at several vertical and lateral scales, from lamina to super sequence, spanning tenths of millimeters to thousands of meters (Bohacs, 1990, 1993, 1998; Schwalbach and Bohacs, 1992; Creaney and Passey, 1993; Bessereau and Guillocheau, 1995; Bohacs et al., 2005). These systematic variations are controlled by depositional environment and stratal stacking. Depositional processes intrinsic to the environment form lithofacies packages and stratal surfaces that are the basic building blocks of the geologic record. Extrinsically controlled accommodation stacks these facies building blocks into a nested stratal hierarchy. Each major physiographic setting accordingly accumulates characteristic vertical and lateral distributions of lithofacies recorded in their stratal stacking, mineralogy, and organic-matter content and character. These characteristic lithofacies distributions are recorded in quasi-periodic, parasequence-scale packages that stack systematically to form depositional sequences whose expression varies significantly within the marine depositional realm.
Sequence-scale variations: The marine realm includes three physiographic settings that accumulate significant organic-matter-rich rocks: constructional shelf margin, platform/ramp, and continental slope/basin (Bohacs, 1998). At the sequence scale in constructional-shelf-margin settings (Figure 4a), organic-carbon content generally increases in each parasequence up to the maximum-flooding downlap surface and then decreases step wise. In this setting, shoreline clastic dispersal systems are directly coupled to the basinal depositional areas. The result is the deposition of parasequences that tend to decrease monotonically in
6 |
SPE 131350 |
|
|
thickness and increase in organic-matter content towards the basin; organic-matter type changes systematically from terrigenous, lowhydrogen content proximally to marine, high-hydrogen content distally. In contrast, in the platform/ramp setting (Figure 4b), parasequences are relatively thick in basinward positions and thin (or lap on) toward basin margins. The distribution of organic matter differs significantly from the constructional shelf margin: the platform/ramp setting shows little or no organic-facies changes towards the limit of fine-grained deposition (Grabowski and Glaser, 1990; Wignall, 1991; Leckie et al., 1990; Bohacs, 1998; Guthrie and Bohacs, 2009). Maximum organic-carbon content occurs in the basal transgressive systems tract and decreases stepwise to background levels at the maximum-flooding downlap surface. The continental slope/basin setting occurs where distinct and significant relief develops (Figure 4c), due in large part to the transition from continental to oceanic crust (Vanney and Stanley, 1983). The position and bathymetry of this setting leads to strong interaction with open-oceanic currents and processes. Clastic dispersal systems are dominated by mass gravity flows and organic deposition by pelagic and hemipelagic sedimentation as well as by sediment-gravity flows. Relations among organic parameters and physical processes may differ significantly from those on continental shelves (Bohacs, 1990, 1993). Bathymetry and its effects on oceanic processes and circulation patterns strongly control the distribution of fine-grained sediments and the organic matter they contain.
TOC |
HIHI |
a |
|
Constructional Shelf Margin |
|
TOC |
HI |
b |
|
Platform Ramp |
|
TOC |
HIHI |
c
Continental Slope-Basin
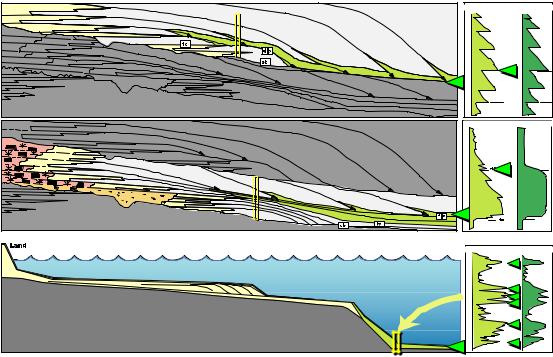
Figure 4 - Physiographic settings of the occurrence of organically enriched mudstone. a) Constructional Shelf Margin, b) Platform/Ramp, and c) Continental Slope-Basin. Also shown are typical TOC and HI stacking patterns for each setting. Vertical scale is meters to tens of meters.
Physiographic-setting-scale models provide the bridge between global and local controls on organic-matter accumulation, integrating global and derivative influences on the proximate controls of production, destruction, dilution, and accommodation. The various settings also provide a practical way to recognize key local controls and estimate the distribution and character of organic matter in a particular area. Hence, one looks at global reconstructions with an eye to areas favorable for the development of each particular physiographic setting (at the regional to basinal scale) and then uses parameters of the physiographic setting model to understand and extrapolate organic-matter-rich rock occurrences and character at the sub-basin to local scale. At any vertical section, however, significant changes in the mudstone properties occur at parasequence and parasequence-set boundaries (Miskell-Gerhardt 1989; Bohacs 1998; Bohacs et al., 2005). These changes are discussed in the following section.
Parasequence-scale variations: The basic stratigraphic building block in essentially all ORRs is the parasequence or its equivalent: a relatively conformable succession of genetically related beds or bedsets bounded by flooding surfaces or their correlative surfaces. Parasequences are typically meters to tens of meters thick and extend over significant portions of a basin, on the order of hundreds to thousands of square kilometers. In marine shelf or lacustrine settings, they typically represent one episode of shoreline progradation. They are interpreted to form in centuries to millennia.
SPE 131350 |
7 |
|
|
Rock properties vary vertically at each well or outcrop location in a systematic manner that is related to the accumulation of the entire parasequence stratal unit (Figure 5a, 5b). Systematic changes in rock character laterally also occur, as a function of proximity to sediment supply points (typically the shoreline; Guthrie and Bohacs, 2009).
|
|
|
|
|
|
|
|
|
|
|
|
|
|
e |
|
|
|
|
|
|
|
|
|
|
|
|
|
c |
|
|
|
|
|
|
|
|
|
|
|
|
|
a |
|
|
|
|
|
|
|
|
|
|
|
|
|
f |
|
|
|
|
|
|
|
|
|
|
|
|
|
r |
|
|
|
|
|
|
|
|
|
|
|
|
|
u |
|
|
|
|
|
|
|
|
|
|
|
|
|
S |
|
|
|
|
|
|
|
|
|
|
|
|
|
g |
|
|
|
|
|
|
|
|
|
|
|
|
|
n |
|
|
|
|
|
|
|
|
|
|
|
|
|
|
i |
|
|
|
|
|
|
|
|
|
|
|
|
|
d |
|
|
|
|
|
|
|
|
|
|
|
|
|
o |
|
|
|
|
|
|
|
|
|
|
|
|
|
o |
|
|
|
|
|
|
|
|
|
|
|
|
|
|
l |
|
|
|
|
|
|
|
|
|
|
|
|
|
F |
|
|
|
|
|
|
|
|
|
|
|
|
|
p |
|
|
|
|
|
|
|
|
|
|
|
|
|
o |
|
|
|
|
|
|
|
|
|
|
|
|
|
|
T |
|
|
|
|
|
|
|
|
|
|
|
|
|
|
2
|
|
|
|
|
|
|
|
|
|
|
|
|
|
e |
|
|
|
|
|
|
|
|
|
|
|
|
|
c |
|
|
|
|
|
|
|
|
|
|
|
|
|
a |
|
|
|
|
|
|
|
|
|
|
|
|
|
f |
|
|
|
|
|
|
|
|
|
|
|
|
|
r |
|
|
|
|
|
|
|
|
|
|
|
|
|
u |
|
|
|
|
|
|
|
|
|
|
|
|
|
g |
S |
|
|
|
|
|
|
|
|
|
|
|
|
in |
|
|
|
|
|
|
|
|
|
|
|
|
|
d |
|
|
|
|
|
|
|
|
|
|
|
|
|
o |
|
|
|
|
|
|
|
|
|
|
|
|
|
lo |
|
|
|
|
|
|
|
|
|
|
|
|
|
lF |
|
|
|
|
|
|
|
|
|
|
|
|
|
a |
|
|
|
|
|
|
|
|
|
|
|
|
|
s |
|
|
|
|
|
|
|
|
|
|
|
|
|
a |
|
|
|
|
|
|
|
|
|
|
|
|
|
|
B |
|
|
|
|
|
|
|
|
|
|
|
|
|
|
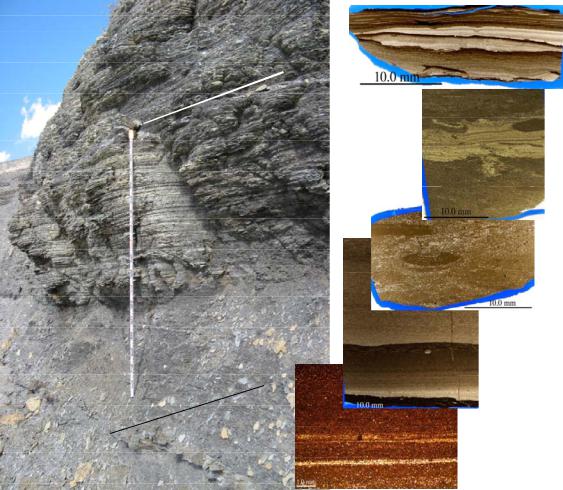
Figure 5a - Representative variation in sedimentary structures typically observed in a single parasequence deposited in a distal setting, such as this 2-meter thick one in the Cretaceous Mowry Shale, near Vernal, Utah, USA.
Proximal areas: In relatively proximal shelf areas, parasequences are 1- to 10-meter-thick coarsening-upward stratal units, defined by lithologic indices: percent sandstone, maximum grain size, thickness of individual sandstone bedsets (Figures 6a). These parasequences also demonstrate an upward increase in skeletal phosphorus content and bioturbation along with an upward decrease in total-organic-carbon content and radiolarian abundance (Figure 6a). A typical parasequence starts at base in laminated very dark grey claystone, with sparse millimeter-thick silt beds and thin lags of skeletal phosphate. The thickness of the siltstone or very fine sandstone beds gradually increases to centimeter scale; these beds commonly have planar-parallel or current bedding and horizontal burrows. Upward, sandstone beds more commonly have erosive bases and fining-upward trends, but are still interbedded with mudstone. Horizontal burrowing increases in intensity upward. Within these parasequences, the enclosing mudstones become siltier and more intensely bioturbated, upward, with minor vertical burrowing along with dominantly horizontal burrows. At the top of the parasequence, sandstone beds become coarser and more common, with very thin intervening mudstone. Sandstones tend to be dominated by current lamination or intensely bioturbated with both vertical and horizontal burrows, commonly from the mudstone of the overlying parasequence. Along with increasing bed thickness, grain size increases within the parasequences, from silt to about 0.125 mm. In the same interval, phosphorus content can double and then decrease in the relatively sandy parasequence top

8 |
|
|
|
|
|
|
|
|
|
|
|
|
|
|
|
|
|
|
|
|
|
|
|
|
|
|
|
|
|
|
|
|
|
|
|
|
|
|
|
|
SPE 131350 |
||
|
|
|
|
|
|
|
|
|
|
|
|
|
|
|
|
|
|
|
|
|
|
|
|
|
|
|
|
|
|
|
|
|
|
|
|
|
|
|
|
|
|
|
|
|
|
|
|
|
|
|
|
|
|
|
|
|
|
|
|
|
|
|
|
r |
|
|
|
|
|
|
|
|
|
|
|
|
|
|
|
|
|
|
|
|
|
|
|
|
|
|
|
|
|
|
|
|
|
|
|
|
|
|
|
|
|
|
e |
|
|
|
|
|
|
|
|
|
|
|
|
|
|
|
|
|
|
|
|
|
|
|
|
|
|
|
|
|
|
|
|
|
|
|
|
|
|
|
|
|
|
b |
|
|
|
|
|
|
|
|
|
|
|
|
|
|
|
|
|
|
|
|
|
|
|
|
|
|
|
|
|
|
|
|
|
|
|
|
|
|
|
|
|
|
m |
|
|
|
|
|
|
|
|
|
|
|
|
|
|
|
|
|
|
|
|
|
|
|
|
|
|
|
|
|
|
|
|
|
|
|
|
|
|
|
|
|
|
e |
|
|
|
|
|
|
|
|
|
|
|
|
|
|
|
|
|
|
|
|
|
|
|
|
|
|
|
|
|
|
|
|
|
|
|
|
|
|
|
|
|
|
M |
|
|
|
|
|
|
|
|
|
|
|
|
|
|
|
|
|
|
|
|
|
|
|
|
|
|
|
|
|
|
|
|
|
|
|
|
|
|
|
|
|
|
e |
|
|
|
|
|
|
|
|
|
|
|
|
|
|
s |
|
|
|
|
|
|
|
|
|
|
|
|||
|
|
|
|
|
|
|
|
|
|
|
|
|
n |
|
|
|
|
|
|
|
|
|
|
|
|
|
|
|
|
|
|
|
|
|
|
|
|
|
|
||||
|
|
|
|
|
|
|
|
|
|
o |
|
|
|
|
|
|
|
|
|
|
|
|
|
|
|
|
u |
|
|
|
|
|
|
|
|
|
|
|
|
||||
|
|
|
|
|
|
|
|
|
|
ilts |
|
|
|
TOC |
|
|
|
|
|
|
|
|
|
|
|
|
|
|
|
|
|
|
|
|
|
|
|||||||
|
|
|
|
|
|
|
|
|
|
|
|
|
|
|
|
|
|
|
|
|
|
o |
|
|
|
|
|
|
|
|
|
|
|
|
|
||||||||
|
|
|
|
|
|
|
|
|
S |
|
|
|
|
|
|
|
|
|
|
|
|
|
|
|
|
e |
|
|
|
|
|
|
|
|
|
|
|
|
|
||||
|
|
|
|
|
|
|
|
|
|
|
|
(wt%) |
|
|
|
|
|
|
|
|
r |
|
|
|
|
|
|
|
|
|
|
|
|
|
|
||||||||
|
|
|
|
|
|
|
|
w |
|
|
|
|
|
|
|
|
|
|
|
|
|
|
|
|
|
|
|
|
|
|
|
|
|
|
|
|
|||||||
|
|
|
|
|
|
|
|
|
|
|
|
|
|
|
|
|
|
|
|
|
a |
le |
|
|
|
|
|
|
|
|
|
|
|
|
|||||||||
|
|
|
|
|
|
|
a |
|
|
|
|
|
|
|
|
|
|
|
|
|
|
c |
|
|
|
|
|
|
|
|
|
|
|
|
|
||||||||
|
|
|
|
|
|
h |
|
|
|
|
|
|
|
|
|
|
|
|
|
|
|
|
|
|
l |
|
a |
|
|
|
|
|
|
|
|
|
|
|
|
|
|||
|
|
|
|
|
s |
|
|
|
|
|
|
|
|
|
|
|
1.78 |
|
|
|
|
a |
|
|
|
|
|
|
|
|
|
|
|
|
|
|
|||||||
|
|
|
|
x |
|
|
|
|
|
|
|
|
|
|
|
|
|
|
|
|
|
h |
|
|
|
|
|
|
|
|
|
|
|
|
|
||||||||
|
|
|
|
E |
|
|
|
|
|
|
|
|
|
|
|
|
|
|
|
|
|
|
|
|
c |
|
s |
|
|
|
|
|
|
|
|
|
|
|
|
|
|
||
|
|
|
|
|
|
|
|
|
|
|
|
|
|
|
|
|
|
|
|
|
|
|
r |
|
|
|
|
|
|
|
|
|
|
s |
|
|
|
|
|||||
|
|
|
|
|
|
|
|
|
|
|
|
|
|
|
|
|
|
|
|
1.57 |
|
|
e |
|
|
k |
|
|
|
|
|
|
|
|
|
|
|
|
|
||||
|
|
|
|
|
|
|
|
|
|
|
|
|
|
|
|
|
|
|
|
|
|
p |
|
|
c |
|
|
|
|
|
|
|
|
|
|
u |
|
|
|
|
|||
|
|
|
|
|
|
|
|
|
|
|
|
|
|
|
|
|
|
|
|
|
|
p |
|
a |
|
|
|
|
|
|
|
|
|
o |
|
|
|
|
|
||||
|
|
|
|
|
|
|
|
|
|
|
|
|
|
|
|
|
|
|
|
|
|
l |
|
|
|
|
|
|
|
|
|
|
|
|
|
|
|
||||||
|
|
|
|
|
|
|
|
|
|
|
|
|
|
|
|
|
|
|
|
|
|
U |
b |
|
|
|
|
|
|
|
|
|
|
e |
|
|
|
|
|
||||
|
|
|
|
|
|
|
|
|
|
|
|
|
|
|
|
|
|
|
|
2.06 |
|
|
|
|
|
|
|
|
|
r |
|
|
|
|
|
|
|||||||
|
|
|
|
|
|
|
|
|
|
|
|
|
|
|
|
|
|
|
|
|
|
|
|
|
|
|
|
|
|
|
|
|
|
|
a |
|
|
|
|
|
|
|
|
|
|
|
|
|
|
|
|
|
|
|
|
|
|
|
|
|
|
|
|
|
|
|
|
|
|
|
|
|
|
|
|
|
|
c |
|
|
|
|
|
|
|
|
|
|
|
|
|
|
|
|
|
|
|
|
|
|
|
|
|
|
|
|
|
|
|
|
|
|
|
|
|
|
|
|
|
|
l |
|
|
|
|
|
|
|
|
||
|
|
|
|
|
|
|
|
|
|
|
|
|
|
|
|
|
|
|
|
|
3.45 |
|
|
|
|
|
|
|
|
|
|
a |
le |
|
|
|
|
|
|
||||
|
|
|
|
|
|
|
|
|
|
|
|
|
|
|
|
|
|
|
|
|
|
|
|
|
|
|
|
|
|
c |
|
|
|
|
|
|
|
||||||
|
|
|
|
|
|
|
|
|
|
|
|
|
|
|
|
|
|
|
|
|
|
|
|
|
|
|
|
|
|
|
- |
|
a |
|
|
|
|
|
|
|
|||
|
|
|
|
|
|
|
|
|
|
|
|
|
|
|
|
|
|
|
|
|
|
|
|
|
|
|
|
|
|
|
|
|
|
|
|
|
|
|
|||||
|
|
|
|
|
|
|
|
|
|
|
|
|
|
|
|
|
|
|
|
|
|
3.63 |
|
|
|
|
|
|
|
|
n |
|
h |
|
|
|
|
|
|
|
|
||
|
|
|
|
|
|
|
|
|
|
|
|
|
|
|
|
|
|
|
|
|
|
|
|
|
|
|
|
|
o |
|
s |
|
|
|
|
|
|
|
|
||||
|
|
Exshaw |
|
|
|
|
|
|
|
|
|
|
|
|
|
|
|
|
|
3.91 |
|
|
|
|
|
|
n k |
|
|
|
|
|
|
|
|
|
) |
||||||
|
|
|
|
|
|
|
|
|
|
|
|
|
|
|
|
|
|
|
|
|
|
|
|
e |
la |
|
|
|
|
|
|
|
|
|
|
|
|||||||
|
|
Exshaw |
|
|
|
|
|
|
|
|
|
|
|
|
|
|
|
|
|
|
|
|
|
|
|
|
r |
|
c |
|
|
|
|
|
|
|
|
|
|
r |
|||
|
|
|
|
|
|
|
|
|
|
|
|
|
|
|
|
|
|
|
|
|
|
|
|
w b |
|
|
|
|
|
|
|
|
|
|
|
||||||||
|
|
|
|
|
|
|
|
|
|
|
|
|
|
|
|
|
|
|
|
|
|
|
|
|
|
|
|
|
|
|
|
|
|
|
|
|
e |
||||||
|
|
|
|
|
|
|
|
|
|
|
|
|
|
|
|
|
|
|
|
|
|
4.82 |
|
|
|
o |
|
|
|
|
|
|
|
|
|
|
|
|
|
|
|||
|
|
|
|
|
|
|
|
|
|
|
|
|
|
|
|
|
|
|
|
|
|
|
|
L |
|
|
|
|
|
|
|
|
|
|
|
|
|
|
|
b |
|
||
|
|
|
|
|
|
|
|
|
|
|
|
|
|
|
|
|
|
|
|
|
|
|
|
|
|
|
|
|
|
|
|
|
|
|
|
|
|
|
|
m |
|
||
|
|
|
|
|
|
|
|
|
|
|
|
|
|
|
|
|
|
|
|
|
|
4.47 |
|
|
|
|
|
|
|
|
|
|
|
|
|
|
|
e |
|
|
|||
|
|
|
|
|
|
|
|
|
|
|
|
|
|
|
|
|
|
|
|
|
|
|
|
|
|
|
|
|
|
|
|
|
|
|
|
M |
|
|
e |
|
|||
|
|
|
|
|
|
|
|
|
|
|
|
|
|
|
|
|
|
|
|
|
|
3.14 |
|
|
|
|
|
|
|
|
|
|
|
|
|
|
|
|
|
||||
|
|
|
|
|
|
|
|
|
|
|
|
|
|
|
|
|
|
|
|
|
|
|
|
|
|
|
|
|
t |
|
|
|
|
|
n |
|
|
n |
|
||||
|
|
|
|
|
|
|
|
|
|
|
|
|
|
|
|
|
|
|
|
|
|
|
|
|
|
|
|
|
|
|
|
|
|
|
a |
o |
|
|
|||||
|
|
|
|
|
|
|
|
|
|
|
|
|
|
|
|
|
|
|
|
|
|
|
|
|
|
|
|
|
|
|
|
|
|
|
t |
|
|
|
|||||
|
|
|
|
|
|
|
|
|
|
|
|
|
|
|
|
|
|
|
|
|
|
|
|
|
|
|
|
|
|
e |
|
|
|
|
|
|
|
|
|||||
|
|
|
|
|
|
|
|
|
|
|
|
|
|
|
|
|
|
|
|
|
|
|
3.08 |
|
|
|
|
|
|
e |
|
|
|
ti |
|
o |
|
|
|
|
|||
|
|
|
|
|
|
|
|
|
|
|
|
|
|
|
|
|
|
|
|
|
|
|
|
|
|
|
|
|
f |
|
|
|
|
|
|
|
|
|
|||||
|
|
|
|
|
|
|
|
|
|
|
|
|
|
|
|
|
|
|
|
|
|
|
3.79 |
|
|
|
|
|
|
|
|
|
|
l |
|
|
|
|
|
||||
|
|
|
|
|
|
|
|
|
|
|
|
|
|
|
|
|
|
|
|
|
|
|
|
|
|
5 |
|
|
|
os |
|
|
|
|
|
|
|
||||||
|
|
|
|
|
|
|
|
|
|
|
|
|
|
|
|
|
|
|
|
|
|
|
|
|
|
|
|
|
|
|
|
|
|
|
o |
|
|
|
|
|
|||
|
|
|
|
|
|
|
|
|
|
|
|
|
|
|
|
|
|
|
|
|
|
|
|
3.64 |
|
|
|
|
(C |
|
D |
|
|
|
|
|
|
||||||
|
|
|
|
|
|
|
|
|
|
|
|
|
|
|
|
|
|
|
|
|
|
|
|
|
|
4.84 |
|
is |
|
|
ndy |
|
|
|
|
|
|
|
|
||||
|
|
|
|
|
|
|
|
|
|
|
|
|
|
|
|
|
|
|
|
|
|
|
|
|
|
|
|
r |
|
|
|
|
|
|
|
|
|
|
|
||||
|
|
|
|
|
|
|
|
|
|
|
|
|
|
|
|
|
|
|
|
|
|
|
|
|
|
|
|
|
|
l |
e |
a |
|
|
|
|
|
|
|
|
|
||
|
|
|
|
|
|
|
|
|
|
|
|
|
|
|
|
|
|
|
|
|
|
|
|
|
|
|
|
|
|
|
|
|
|
|
|
|
|
|
|
|
|||
|
|
|
|
|
|
|
|
|
|
|
|
|
|
|
|
|
|
|
|
|
|
|
|
|
|
|
|
|
a |
|
S |
|
|
|
|
|
|
|
|
|
|
||
|
|
|
|
|
|
|
|
|
|
|
|
|
|
|
|
|
|
|
|
|
|
|
|
|
|
|
|
|
l |
|
|
|
|
|
|
|
|
|
|
|
|
|
|
|
|
|
|
|
|
|
|
|
|
|
|
|
|
|
|
|
|
|
|
|
|
|
|
|
|
|
|
|
P |
|
|
|
|
|
|
|
|
|
|
|
|
|
|
|
|
|
|
|
|
|
|
lli |
r |
|
|
|
|
|
|
|
|
|
|
|
|
|
|
|
|
|
|
|
|
|
|
|
|
|
|
|
|
|
|
|
|
|
|
|
|
|
|
|
|
|
|
|
|
|
|
|
|
|
|
|
|
|
|
|
|
|
|
|
|
|
|
|
|
|
|
|
|
|
|
|
|
|
|
|
|||
|
|
|
|
|
|
Palliser |
|
|
|
|
|
|
|
|
|
|
|
|
|
|
|
|
|
|
|
|
|
|
|
|
|
|
|
|
|
|
|
|
|
||||
|
|
|
|
|
|
|
|
|
|
|
|
|
|
|
|
|
|
|
|
|
|
|
|
|
|
|
|
|
|
|
|
|
|
|
|
|
|
|
|
|
|
|
|
Figure 5b - Example of organic-richness vertical profile and flooding contact in a relatively proximal setting, Exshaw type section, Jura Creek, Alberta, Canada. The flooding surface is marked by the light blue symbol
(see inset for detail of this contact), and various parasequence packages are indicated by the breaks in the weathering profile and the TOC vertical variability. A correlative surface and TOC profile are shown in Figure 15.
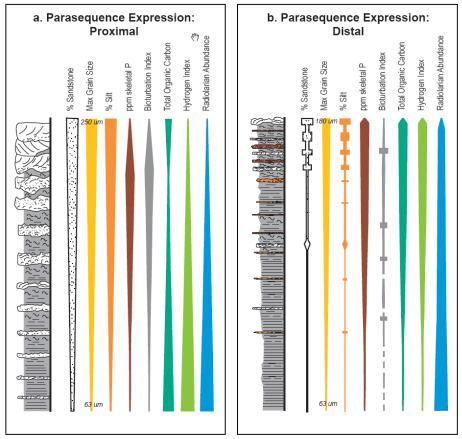
All attributes within parasequences in proximal sections record an increase in bottom energy and oxygen levels due to shoreline progradation and water-depth shallowing: grain size and sandstone percentage increase because the influence of storm currents becomes more frequent and stronger at the depositional site, phosphorus content rises due to concentration of fish debris by storm currents, TOC decreases because of increases in bioturbation (indicating emergence above a redox boundary), re-exposure and oxidation of organic matter by storm currents, and by an overall increase in grain size. These observations indicate shoaling and more proximal storm sedimentation upwards and a correspond increase in clastic sedimentation rates. The coarsening-upward trend is paralleled by increases in bioturbation and inorganic (skeletal) phosphate content, and decreases in TOC content and radiolarian abundance. The overall envelope of maximum TOC shows a peaked distribution relative to HI (Figure 6a; Bohacs et al., 2005): positively correlated where increasing maximum TOC is due to increased algal content with high inherent HI (in relatively distal environments) and inversely correlated where increasing maximum TOC is due to increased content of woody and coaly organic matter with low inherent HI (in relatively proximal areas). Radiolarian abundance decreases with shoaling because they are holoplanktonic and cannot tolerate the fluctuations of temperature, salinity, and turbidity that occur nearshore (Heckel 1972), suggesting a decreasing influence of these consumer organisms. All observations in proximal sections indicate that dilution processes are dominant in controlling enrichment in organic matter. This leads to the characteristic vertical profile of TOC referenced in the previous section and illustrated in Figure 5b.
Distal areas: In the most distal regions, parasequences are significantly thinner, and contain a larger proportion of laminated to parallel-bedded very dark gray claystone and mudstone than in proximal settings with few centimeter-scale storm layers (< 2% of the section). Lithologic indices still indicate an upward-shoaling trend: percent sandstone, percent siltstone, maximum grain size, thickness of individual sandstone or siltstone bedsets (Figure 6b). A significant portion of the siltand sand-size particles tend to be biogenic (reworked radiolaria, coccoliths, etc.). These parasequences generally demonstrate an upward increase in skeletal phosphorus content, total-organic-carbon content, hydrogen index, and bioturbation and a slight decrease in biogenic silica abundance (Figure 6b).
SPE 131350 |
9 |
|
|
Figure 6 - Schematic comparison of parasequence expression in proximal (a) and distal areas (b), based on studies of the Mowry Shale. Proximal settings appear to be controlled mostly by clastic dilution and bottom energy conditions; distal setting mostly by primary organic production, with minor influence of biogenic dilution processes
A typical distal parasequence starts at base in parallel-bedded very dark grey claystone, with very sparse millimeter-thick silt beds and thin lags of skeletal phosphate and microfossils. Siltstone beds gradually become more common and increase in thickness to centimeter scale; these beds commonly have planar-parallel or current bedding and horizontal burrows. Upward, burrowing increases in intensity and diversity with subordinate vertical burrowing along with dominantly horizontal burrows. At the top of the parasequence, microfossil lags and siltstone beds are more common, with intervening mudstone to silty mudstone. Biogenic silica or carbonate of pelagic origin becomes less abundant in the upper 10 to 20% of the parasequence whereas coarser-grained biogenic carbonate of benthic origin is commonly more abundant near the top.
Lateral changes and their controls: Parasequence sets in intermediate positions between proximal and distal areas commonly show a smooth transition upsection from one end-member parasequence type to the other. This smooth transition in the basal transgressive systems tract from proximal parasequence type to distal parasequence type records a relatively abrupt transgression into a position and water depth too far offshore to be influenced significantly by storm sedimentation and clastic supply. In a few other locations, TOC and phosphorus signals can decouple, suggesting transgression into water depths too distal for clastic storm sedimentation, but not deep or distal enough (or into the right location) to be controlled by production changes (Bohacs et al., 2005).
The patterns of changes in organic-matter enrichment from proximal to distal settings within coeval strata appear to be due to changes in the relative importance of organic production, destruction, and dilution. In proximal areas, TOC content peaks in the uppermost transgressive systems tract, the interval with the lowest total accumulation rate, and shows a strong inverse relation with clastic-detritus content (Figure 7). These observations, along with the relations of TOC to P, BI, and HI, indicate that dilution rate is the dominant control in proximal areas. This agrees with the sequence-stratigraphic model of Creaney and Passey (1993) that demonstrated the signature of progradation in organic-matter enrichment at the parasequence and depositional-sequence scale. In distal areas, total and clastic accumulation rates are significantly smaller than in proximal areas (by factor of 2 or more), whereas

10 |
SPE 131350 |
|
|
relative rates of biogenic silica accumulation are mostly greater (up to 47% in some units), especially in the uppermost portion of the highstand systems tract (Figure 7). These relations, along with the positive correlation among TOC, P, HI, and bioturbation index, indicate that primary organic production is the dominant control in distal reaches. Dilution by biogenic silica plays a secondary role, but appears to be a factor in the displacement of the TOC peak to above the maximum flooding downlap surface, to an interval with abundant to very abundant concentrations of biosilica and clay minerals.
|
|
|
|
|
|
< |
200 – 400 km |
> |
|
|
|
||
|
Proximal |
|
Mowry Shale |
0.09 |
|
|
Distal |
|
|||||
|
|
|
|
0 |
|
|
|
|
|
|
|
|
|
|
HST |
|
|
|
|
|
|
|
|
HST |
|
0.09 |
|
|
|
|
|
|
|
|
|
|
|
|
|
|
|
|
HST |
|
|
|
|
|
|
|
|
HST |
|
|
|
|
|
|
|
|
|
|
|
|
|
|
|
|
|
|
|
|
|
|
|
TOC/Total Accumulation Rate |
|
|
TOC/Total Accumulation Rate |
||||
|
|
|
|
|
|
|
|
|
|
||||
Tract |
HST |
|
|
|
|
TOC/Total Accumulation Rate |
HST |
|
|
MF-DLS |
|||
|
|
|
|
|
|
|
|
|
|
||||
|
|
|
|
|
|
|
|
|
|
|
|||
System s |
TST |
|
|
|
|
|
|
|
|
TST |
|
|
|
|
|
|
|
|
|
|
|
|
|
|
|
|
|
|
TST |
|
|
|
|
|
|
|
|
TST |
|
|
|
|
|
|
|
|
|
|
|
|
|
|
|
|
|
|
TST |
|
|
|
|
|
|
|
|
TST |
|
|
TS |
|
|
|
|
|
|
|
|
|
|
|
|
||
|
0 |
10 |
20 |
|
30 |
40 |
50 |
60 |
70 |
0 |
5 |
9 |
|
|
|
|
|
Component Accumulation Rate (mg/cm2/yr) |
|
|
|
||||||
|
|
|
|
|
|
Component Accumulation Rate |
|||||||
|
TOC |
Clastics |
|
Biosilica |
|
|
|||||||
|
|
|
|
TOC |
|
Clastics |
Biosilica |
||||||
|
|
|
|
|
TOC Detritus SiO2 |
|
|
|
(mg/cm2/yr) |
|
|||
|
|
|
|
|
|
|
|
|
|
|
|||
Figure 7 - Comparison of vertical and lateral changes in component accumulation rates (after Bohacs et al., 2005). Note the wide range of clastic dilution in proximal column compared to dominance of biogenic production in distal column.
In summary, dilution appears to be the main control in proximal areas, whereas production is dominant in distal regions. These scales of change highlight the necessity of considering the three-dimensional distribution, changes, and interplay of production, destruction, and dilution processes and their relation to local accommodation to understand fully any particular ORR or potential shale-gas unit. Detailed sequence-stratigraphic analysis reveals genetically related rock units and enables the application of process-based models to understand and predict the occurrence, distribution, and character of ORRs that serve as shale-gas reservoirs. This framework can be scaled from basin-wide formations to fieldand flow-scale units (Guthrie and Bohacs, 2009; Bohacs and Lazar, 2010). The detailed stratigraphic framework is essential for relating detailed rock-property measurements to bulk flow behavior (discussed in the following sections), for scaling up to construct reservoir models, and for estimating resource density and distribution.
Organic-matter Type and Maturity
Most current shale-gas reservoirs had their origin as organic-rich mud. These sediments could have been deposited in the marine environment, in lakes (lacustrine), or in associated swamps and mires along the margins of lakes or seas. The type of organic matter deposited, and ultimately preserved in the mud, depends on the environment of deposition. Organic geochemists (e.g., Tissot and Welte, 1984) have used hydrogen-to-carbon and oxygen-to-carbon ratios to describe the various types of organic matter (or kerogen) in organic-rich mudstones that have generated much of the oil and gas that resides in conventional reservoirs worldwide; Type I and Type II kerogen are from algal and herbaceous material, have high H:C ratios, and will typically generate oil during the thermal maturation phase associated with burial, time, and temperature; Type III kerogen is largely composed of woody/coaly material and will generate mostly gas during thermogenic maturation. If hydrocarbons are generated from these rocks, they are termed “source rocks”.